Physical fitness level is a marker of cardiovascular health in young people. The aim of this study was to analyze the effects of a school-based intervention program, focused on increasing the volume and intensity of physical education (PE) sessions, on adolescents physical fitness.
MethodsSixty-seven adolescents (12-14 years old) from three secondary school classes participated in a 16-week intervention. The classes were randomly allocated to the control group, experimental group 1 (EG1) or experimental group 2 (EG2). The control group received standard PE (2 sessions/week), the EG1 received 4 standard PE sessions/week and the EG2 received four high-intensity PE sessions/week. Aerobic fitness, muscle strength, speed-agility and flexibility were assessed using previously validated field-based tests before and after the intervention.
ResultsDoubling the number of PE sessions/week resulted in improvements in aerobic fitness and flexibility (P=.008 and P=.04, respectively). Further increases in the intensity of the sessions were related to improvements in speed-agility (P<.001). The maximal oxygen consumption increased by 3 and 5mL/kg/min in the EG1 and EG2, respectively. No differences were observed for muscle strength.
ConclusionsThe results suggest that doubling the frequency of PE sessions is a sufficient stimulus to improve physical fitness, particularly aerobic fitness, which has been shown to be a powerful indicator of cardiovascular health in children and adolescents. Future studies involving larger sample sizes should confirm or refute these findings.
Keywords
.
INTRODUCTIONPhysical fitness constitutes an integrated measure of all the functions and structures involved in the performance of physical activity and/or exercise. These include musculoskeletal function, cardiorespiratory function, blood flow and circulatory function, endocrine and metabolic function and psychoneurological function. Recent studies have shown physical fitness to be an important predictor of morbidity and mortality in adults1, 2 and a powerful indicator of health status in children and adolescents; moreover, it is closely related to obesity, a problem of primary importance in the majority of developed societies.3, 4
Other researchers have reported a considerable decrease in the levels of physical fitness in young people.5 Our previous findings in the AVENA (Alimentación y Valoración del Estado Nutricional de los Adolescentes [Diet and Assessment of the Nutritional Status in Adolescents]) study demonstrate that the physical fitness levels of the Spanish adolescent population are too low when compared to those of adolescents from other countries.6 Overall, these facts indicate the need to encourage the introduction of intervention programs focusing specifically on improving the physical fitness of adolescents as a way of promoting general health and cardiovascular health in particular.
Intervention studies to improve physical fitness in children and adolescents have focused mainly on the aerobic capacity.7, 8 However, current evidence indicates the importance of also potentiating other components of physical fitness such as strength, flexibility and speed-agility.3, 4, 9 The majority of the studies have analyzed the effect of increasing the number of weekly sessions (volume effect)10, 11, 12, 13, 14, 15 and few have evaluated the effect of the intensity.16, 17, 18 However, we have found no studies that analyze the “volume” effect and the “intensity” effect jointly and independently, an approach that would contribute to a better understanding of which elements are necessary in order to improve physical fitness.
The purpose of the present study is to examine the effect on physical fitness and body composition of: a) doubling the number of sessions of physical education (PE) per week; b) doubling the number of sessions of PE per week plus increasing their intensity; and c) increasing the intensity of the sessions, while maintaining the same number per week.
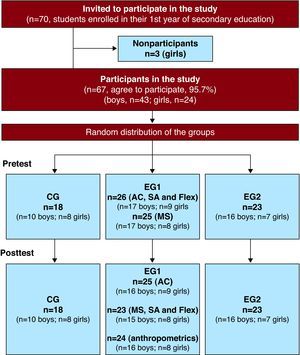
METHODS Participants and DesignA detailed description of the design and methodology of the study has previously been published.19 The preintervention and postintervention evaluations were carried out in 2007 by expert researchers who had participated in previous Spanish and European projects.6, 20, 21, 22 The intervention was performed by the PE teacher of the participating center–a public secondary school in Murcia, Spain. Most of the participating families had a middle socioeconomic status. A total of 67 adolescents (of the 70 invited), 43 boys and 24 girls (12 to 14 years of age and Tanner II-V), students from three different classes, agreed to take part in the present study, for a rate of participation of 96%. Two adolescents refused to participate due to mild disease during the pretest and a third refused to undergo certain measurements. The study groups randomly assigned to constitute the control group (CG), experimental group 1 (EG1) and experimental group 2 (EG2) corresponded to three classes previously established by the center. This type of design is referred to as a group randomized controlled trial. Figure 1 shows the flow chart corresponding to the study. In all, 84% of the participants completed all the pre- and postintervention evaluations and attended two thirds or more of the program sessions. The study was approved by the Human Research Ethics Committee of the Universidad de Granada and registered in clinicaltrial.org (NCT01098968). The parents or legal guardians of the subjects were asked to sign an informed consent form in order for them to participate in the study.

Figure 1. Flow chart corresponding to the participants included in the study and the follow-up. AC, aerobic capacity; CG, control group; EG, experimental group; Flex, flexibility; MS, muscle strength; SA, speed-agility.
InterventionA detailed description of the intervention has previously been published.19 Briefly, the CG (n=18) received the 2 sessions of PE a week (55min/session) established by the regulations currently in force in Spain. EG1 (n=26) doubled the academic load stipulated for this subject (four 55-minute sessions a week. EG2 (n=24) also received 4 sessions/week in which there was special emphasis on increasing the intensity of the sessions (4 x 55min/session plus intensity). For practical matters and questions of viability, the extra sessions were carried out during the afternoon, under the same conditions and in the same facilities as the usual sessions (held during the morning). The sessions were carried out in accordance with the established curriculum, with the approval of the educational institution and the parents. Following the 16-week intervention, the participants completed a questionnaire for the evaluation of the program and were asked if they would like it to be continued in the future.
Evaluation of Physical Fitness (Primary Outcome Variables)Physical fitness was measured by means of field-based tests that have been shown to be valid and reliable in the adolescent population21, 23, 24, 25 and have previously been utilized in Spanish and international studies.6, 22 A detailed description of the evaluation protocols has previously been published.6, 22 Aerobic capacity was assessed using the Course-Navette test, an indirect incremental maximal exercise field test consisting of a 20 m shuttle run; it was expressed on the basis of the last completed stage or half-stage, and the maximum oxygen consumption (VO2max) was calculated using the equations proposed by Léger et al.26 Muscle strength was assessed by means of the standing long jump (centimeters), which has been shown to be a good indicator of overall strength in children and adolescents. Speed-agility was evaluated on the basis of the 4 x10-meter shuttle run (seconds). Flexibility was assessed using the back-saver sit and reach test (centimeters). All the tests were performed twice, and the better of the two results was recorded, with the exception of the Course-Navette test, which was performed only once.
Anthropometric Assessment (Secondary Outcome Variables)The protocol for anthropometric assessment applied was that used in the HELENA (Healthy Lifestyle in Europe by Nutrition in Adolescence) study.27 The description of the measurements carried out, the material and the analysis of the reliability of the measurement in the adolescent population has previously been published.28 The parameters evaluated were: weight, height, skinfold thicknesses (biceps, triceps brachii, subscapular, suprailiac, thigh and triceps surae) and body measurements (arm with muscle relaxed and contracted, waist, hip and upper thigh). On the basis of these measurements, we have estimated different indices of body composition (Table 1). The sexual maturation status was self-assessed by the adolescents according to the Tanner stages,29 under the supervision of trained evaluators, as performed in the Spanish multicenter AVENA study.6
Table 1. Baseline Characteristics of the Participants.
| Participants (n=67) | CG (n=18) | EG1 (n=26) | EG2 (n=23) | P | |
| Girls (%) | 35.8 | 44.4 | 34.6 | 30.4 | |
| Age (years) | 13.0 (0.7) | 13.8 (0.5) | 12.9 (0.6) | 12.7 (0.5) | .001 |
| Tanner (%) | .21 | ||||
| Stage I Stage II Stage III Stage IV Stage V | 0 16.4 23.9 47.8 11.9 | 0 0 33.3 44.4 22.2 | 0 23.1 19.2 53.8 3.8 | 0 21.7 21.7 43.5 13.0 | |
| Weight (kg) | 54.8 (14.1) | 59.3 (15.9) | 54.6 (15.9) | 51.6 (9.1) | .22 |
| Height (cm) | 156.5 (7.2) | 157.5 (5.8) | 156.4 (8.4) | 156.0 (7.0) | .80 |
| Body mass index (kg/m2) | 22.3 (5.1) | 23.8 (6.0) | 22.2 (5.7) | 21.1 (3.0) | .24 |
| Sum of 6 skinfolds (mm) | 110.8 (48.5) | 119.9 (48.2) | 106.9 (55.4) | 108.1 (41.0) | .65 |
| Percent body fat (%) | 27.0 (11.3) | 29.8 (11.4) | 26.0 (12.2) | 26.1 (10.1) | .49 |
| Fat mass index (kg/m2) | 6.5 (4.2) | 7.7 (5.0) | 6.4 (4.6) | 5.8 (2.9) | .36 |
| Waist circumference (cm) | 71.4 (12.7) | 73.5 (10.9) | 70.3 (17.3) | 71.0 (6.8) | .71 |
| Waist circumference-to-height ratio | 0.5 (0.1) | 0.5 (0.1) | 0.5 (0.1) | 0.5 (0.0) | .83 |
| Fat-free mass (kg) | 38.8 (5.7) | 40.2 (6.4) | 38.9 (6.1) | 37.5 (4.6) | .32 |
| Fat-free mass index (kg/m2) | 15.8 (1.5) | 16.2 (1.9) | 15.8 (1.5) | 15.4 (1.1) | .26 |
CG, control group (2 sessions of standard physical education a week); EG1, experimental group 1 (4 sessions/week of standard physical education); EG2, experimental group 2 (4 sessions/week of high-intensity physical education).
The values are expressed as the means (standard deviation), unless otherwise indicated.
Analysis of variance of one factor (group). The differences in maturation status were analyzed using the chi-square test.
The performance of regular and continuous physical activity during after-school hours and sedentary behaviors prior to and after the intervention were evaluated according to the questionnaires used in the AVENA study. The intensity of the sessions was controlled by recording the heart rates of several randomly selected adolescents (n=38) during 15 sessions, which were also chosen randomly. For this purpose, a Polar 610 heart rate monitor (Polar Vantage XL, Kempele, Finland) was employed.
Statistical AnalysisThe effects of the program on physical fitness and body composition were studied using analysis of covariance (ANCOVA) applied to one factor, including group as a fixed factor, change during the preintervention-to-postintervention interval as a dependent variable and sex, maturational development (Tanner stage), preintervention levels of the variable studied and attendance rate as covariables. Post-hoc pairwise comparisons were carried out with the Bonferroni correction. The effect size was estimated using Cohen's d, with Hedge's d to correct for small samples.30 The effect size is considered to be small when it is around 0.2, medium when it is around 0.5 and large if it is around 0.8 or greater. Due to the small number of missing data (between 0 and 2, depending on the variable studied), we included in the analyses those subjects who had completed both the pretest and posttest evaluations and, thus, it was not necessary to employ imputation methods. The primary analysis was carried out on an “intention-to-treat” basis. In addition, we observed whether there were differences between the study groups in terms of extracurricular physical activity or sedentary lifestyle at the beginning and end of the program using the chi-square test and the Kruskal-Wallis test, respectively. All the statistical analyses were performed with the Statistical Package for the Social Sciences (SPSS, version 17.0 for Windows) and the level of significance was set at .05.
RESULTSThe baseline characteristics of the adolescents studied are shown in Table 1. Table 2, Table 3, Table 4, Table 5 show the effect of the intervention on the different components of physical fitness after adjustment for sex, maturational development, the initial levels of the variable of physical fitness studied and attendance at the program sessions. The comparisons between the CG and the two EG demonstrated that the increase in the volume of PE had a positive effect on the aerobic capacity (expressed as stage/VO2max) and flexibility (P=.008/.005 and .04, respectively), while the increase in volume plus intensity produced a more marked improvement in these variables (P<.001/<.001 and .002, respectively) and significantly improved speed-agility (P<.001). The intervention had no effect on strength (Table 3). The effect size observed for those study variables that were significantly changed was large or very large (ranging between 0.7 and 1.7). The most marked improvements were observed in the aerobic capacity, regardless of whether it was expressed in terms of stages (between +1 and +2, both EG vs. the CG) or as estimated VO2max (between +3 and +5mL/kg/min, both EG vs. the CG). The improvements in speed-agility and flexibility were similar, but more moderate than those achieved in the aerobic capacity. The comparisons between EG1 and EG2 showed that, for a given PE volume (4 sessions/week), the increase in intensity produced an additional improvement in the aerobic capacity, although it did not reach statistical significance (stage/VO2max, P=.07/.08; effect size=0.7/0.6). There were no differences between EG1 and EG2 for the remainder of the components of physical fitness (P≥.4).
Table 2. Effects of the Intervention on the Aerobic Capacity of the Adolescents.
| Pre | Post | Difference (post-pre) | Pairwise comparisons | |||
| Course-Navette (stages) | ||||||
| CG (n=18) | 4.0 (1.9) | 4.2 (2.1) | 0.1 (1.1) | EG1 vs. CG (Volume effect) | EG2 vs. CG (Volume+intensity effect) | EG2 vs. EG1 (Intensity effect) |
| EG1 (n=25) | 3.3 (1.9) | 4.5 (1.9) | 1.2 (1.1) | |||
| EG2 (n=23) | 4.2 (1.8) | 6.1 (2.1) | 1.9 (1.1) | |||
| Difference (groups) | 1.1 | 1.8 | 0.7 | |||
| P (groups) | <.001 | .008 | <.001 | .07 | ||
| Effect size a | 1.00 | 1.68 | 0.67 | |||
| Maximum oxygen consumption (VO2max; mL/kg/min) | ||||||
| CG (n=18) | 39.8 (5.2) | 40.3 (5.7) | 0.0 (2.9) | EG1 vs. CG (Volume effect) | EG2 vs. CG (Volume+intensity effect) | EG2 vs. EG1 (Intensity effect) |
| EG1 (n=25) | 39.5 (4.6) | 42.6 (4.6) | 3.1 (2.9) | |||
| EG2 (n=23) | 42.2 (5.0) | 47.1 (5.7) | 5.0 (2.8) | |||
| Difference (groups) | 3.1 | 5.0 | 1.9 | |||
| P (groups) | <.001 | .005 | <.001 | .08 | ||
| Effect size a | 1.04 | 1.69 | 0.64 | |||
CG, control group (2 sessions of standard physical education a week; EG1, experimental group 1 (4 sessions/week of standard physical education); EG2, experimental group 2 (4 high-intensity sessions/week of physical education).
a Standardized difference or effect size (with Hedge's d for correction), mean difference in EG1 minus mean difference in CG divided by the standard deviation of the combined differences. The same calculation was carried out for EG2 vs. CG and for EG2 vs. EG1.The values shown correspond to the means (standard deviation), unless otherwise indicated.Analysis of covariance (ANCOVA) of one factor (dependent variable: differences between postintervention and preintervention findings; fixed factor: group) with Bonferroni adjustment. The descriptive values for the differences and P values are adjusted for sex, maturational development, preintervention aerobic capacity and attendance.
Table 3. Effects of the Intervention on the Muscle Strength of the Adolescents.
| Pre | Post | Difference (post-pre) | Pairwise comparisons | |||
| Long jump (cm) | ||||||
| CG (n=18) | 142.2 (23.0) | 151.1 (19.9) | 10.1 (10.0) | EG1 vs. CG (Volume effect) | EG2 vs. CG (Volume+intensity effect) | EG2 vs. EG1 (Intensity effect) |
| EG1 (n=23) | 140.0 (26.4) | 148.6 (29.0) | 6.3 (10.2) | |||
| EG2 (n=23) | 138.3 (22.7) | 145.7 (23.3) | 7.1 (9.5) | |||
| Difference (groups) | -3.8 | -3.0 | 0.8 | |||
| P (groups) | .48 | .73 | 1.00 | 1.00 | ||
| Effect size a | 0.37 | 0.31 | 0.08 | |||
CG, control group (2 standard sessions/week of physical education); EG1, experimental group 1 (4 standard sessions of physical education a week); EG2, experimental group 2 (4 high-intensity sessions/week of physical education).
a Standardized difference or effect size (with Hedge's d for correction): mean difference in EG1 minus mean difference in CG divided by the standard deviation of the combined differences. The same calculation was carried out for EG2 vs. CG and for EG2 vs. EG1.The values shown correspond to the means (standard deviation), unless otherwise indicated.Analysis of covariance (ANCOVA) of one factor (dependent variable: differences between postintervention and preintervention findings; fixed factor: group) with Bonferroni adjustment. The descriptive values for the differences and P values are adjusted for sex, maturational development, preintervention muscle strength and attendance.
Table 4. Effects of the Intervention on the Speed-Agility of the Adolescents.
| Pre | Post | Difference (post-pre) | Pairwise comparisons | |||
| 4 x10 m shuttle run (s)a | ||||||
| CG (n=18) | 12.7 (1.0) | 12.4 (1.0) | -0.4 (0.4) | EG1 vs. CG (Volume effect) | EG2 vs. CG (Volume+intensity effect) | EG2 vs. EG1 (Intensity effect) |
| EG1 (n=23) | 13.1 (1.2) | 12.4 (1.2) | -0.7 (0.4) | |||
| EG2 (n=23) | 12.8 (0.8) | 12.0 (0.8) | -0.8 (0.4) | |||
| Difference (groups) | -0.3 | -0.4 | -0.1 | |||
| P (groups) | .002 | .09 | .001 | .39 | ||
| Effect size b | 0.71 | 1.17 | 0.45 | |||
CG, control group (2 standard sessions/week of physical education); EG1, experimental group 1 (4 standard sessions of physical education a week); EG2, experimental group 2 (4 high-intensity sessions/week of physical education).
aLower scores in seconds indicate a better test performance.
b Standardized difference or effect size (with Hedge's d for correction): mean difference in EG1 minus mean difference in CG divided by the standard deviation of the combined differences. The same calculation was carried out for EG2 vs. CG and for EG2 vs. EG1.The values shown correspond to the means (standard deviation), unless otherwise indicated.Analysis of covariance (ANCOVA) of one factor (dependent variable: differences between postintervention and preintervention findings; fixed factor: group) with Bonferroni adjustment. The descriptive values for the differences and P values are adjusted for sex, maturational development, preintervention speed-agility and attendance.
Table 5. Effects of the Intervention on the Flexibility of the Adolescents.
| Pre | Post | Difference (post-pre) | Pairwise comparisons | |||
| Back-saver sit and reach test (cm) | ||||||
| CG (n=18) | 19.8 (9.1) | 18.9 (8.3) | -0.7 (3.3) | EG1 vs. CG (Volume effect) | EG2 vs. CG (Volume+intensity effect) | EG2 vs. EG1 (Intensity effect) |
| EG1 (n=23) | 15.9 (8.4) | 18.1 (6.1) | 2.0 (3.2) | |||
| EG2 (n=23) | 16.0 (6.4) | 19.2 (6.9) | 3.0 (3.1) | |||
| Difference (groups) | 2.7 | 3.7 | 1.0 | |||
| P (groups) | .002 | .04 | .002 | .75 | ||
| Effect size a | 0.82 | 1.16 | 0.33 | |||
CG, control group (2 standard sessions/week of physical education); EG1, experimental group 1 (4 standard sessions of physical education a week); EG2, experimental group 2 (4 high-intensity sessions/week of physical education).
a Standardized difference or effect size (with Hedge's d for correction): mean difference in EG1 minus mean difference in CG divided by the standard deviation of the combined differences. The same calculation was carried out for EG2 vs. CG and for EG2 vs. EG1.The values shown correspond to the means (standard deviation), unless otherwise indicated.Analysis of covariance (ANCOVA) of one factor (dependent variable: differences between postintervention and preintervention findings; fixed factor: group) with Bonferroni adjustment. The descriptive values for the differences and P values are adjusted for sex, maturational development, preintervention flexibility and attendance.
The intervention produced no significant changes in the anthropometric or body composition variables studied: weight, height, body mass index, sum of 6 skinfolds, percent body fat, fat mass index, waist circumference, waist-to-height ratio, fat-free mass and fat-free mass index (results not shown). One hundred percent of the students belonging to the two EG said they would like to continue in the program during the following school year.
Additional Analyses (Results not Shown)Given that the age differed from one group to another at the start of the study (Table 1), the analyses were repeated after adjusting for age rather than for the sexual maturation status, and the results did not vary. The additional adjustment for all the anthropometric variables studied did not change the results. The analyses were also repeated with the exclusion of those students whose rate of attendance was lowest (less than two thirds of the sessions, n=11) and the results did not vary. No significant differences were observed among the study groups with respect to the performance of physical activity and/or sports after school or time spent in sedentary activities (television, video games and homework) at the start and the end of the study (P>.05). The mean and maximum heart rates were significantly higher in EG2 than in the CG and EG1 in the sessions analyzed (P<.001), and no differences were observed between the CG and EG1 (P>.05).
DISCUSSIONThe results observed in the present study suggest that increasing (doubling) the academic load of PE in schools results in an increase in aerobic capacity and flexibility. If, in addition, there is an increase in the intensity of the sessions, the improvement in these components is more marked and improvements are also observed in speed-agility. On the other hand, the intervention program did not improve muscle strength or body composition.
Most of the intervention programs carried out in the school setting have focused on the aerobic capacity, and the results have been similar to ours.10, 11, 15, 18, 31 After a one-year intervention program based on introducing daily PE classes, rather than the usual two sessions a week, Walther et al.15 observed an improvement of 3.7mL/kg/min in the VO2max, but found no significant gains in coordination and balance. In another study, based on the inclusion of 60min of physical activity every school day over a 2-year period vs. two 45 min-sessions of standard PE a week, the results obtained were similar to ours, with an improvement in VO2max of 3.6mL/kg/min.11 Other studies based on the increase in the number of PE sessions resulted in significant improvements in the VO2max, estimated using the Course-Navette test10, 32 or other tests.11, 31, 33 Likewise, in another intervention study based on an increase in PE sessions (from 2 to 4 sessions/week) carried out in Sweden over a 3-year period,12 the authors also observed significant improvements in the aerobic capacity, estimated by means of a test involving a 6-min run. In contrast, after carrying out a 6-month intervention program, Peralta et al.13 observed no significant differences in aerobic capacity.
Few studies have focused on the specific effect of increasing the intensity of PE classes (for a given volume or number of classes per week) on physical fitness. In this context, Baquet et al.16 compared two groups, one of which had three standard PE classes a week, whereas the other had two standard PE classes a week, plus a high-intensity class (short periods, 10s, at 100% to 120% of maximal aerobic speed). The authors observed a significant improvement in aerobic capacity.
Among the studies that have analyzed muscle strength, we found conflicting results. In a study focused on the increase from two to four sessions of PE over a 3-year period, no differences were observed between the CG and the EG.12 On the other hand, in a study involving an increase in physical activity during recesses and “down” times between classes (ABC for fitness program),34 significant increases were obtained in abdominal and upper body strength. Baquet et al.16 also observed significant differences in strength in the group in which the intensity of the PE sessions was increased, but only regarding lower body strength, there being no evidence of differences between the groups with respect to abdominal strength. In both of the aforementioned studies,16, 34 the effect of the program on flexibility was also evaluated, but no significant differences were found. In contrast, in a study carried out in Chilean children based on the introduction of active recesses and an additional 90min of physical activity a week, the authors did obtain significant improvements in lumbar flexibility,32 along the lines of our results. Finally, in both the work focusing on the increase in the intensity of PE classes16 and the other report involving the increase in the number of PE sessions a week,33 positive effects were observed in speed, in accordance with the results observed in our study.
An important contribution of EDUFIT (Education for Fitness) to the studies mentioned above is the specific and combined analysis of the volume and intensity and their effects on physical fitness. Our results suggest that, for a given volume of PE (4 sessions/week), the increase in intensity, corroborated by the higher mean and maximum heart rates in EG2 as compared to EG1, had no significant effect on physical fitness.
On the other hand, in this study, the body composition was not improved. Results similar to ours can be found in a recent review focused on the body mass index.35 However, in other intervention studies of longer duration, with a larger sample size or more accurate methods of measurement, the effect of the intervention on body composition has been satisfactory.8, 10, 14, 15, 18, 32, 34, 36 For example, Yin et al.14 observed no differences in anthropometric parameters, such as body mass index and waist circumference, after a one-year intervention, but did report a decrease in the amount of body fat measured by means of DEXA (dual-energy X-ray absorptiometry), indicating the importance of an accurate measurement.
Limitations and Strengths of the StudyThe main limitation of the present study is the small sample size. The estimated statistical power, less than 80%, affects the nonsignificant results. That is, we can not state unequivocally that the intervention is not effective in muscle strength or body composition. These results should be interpreted with caution until they can be verified in multicenter studies with larger samples. The low statistical power does not, however, affect the significant results and, thus, we should point out the high level of significance and the effect size observed in aerobic capacity, speed-agility and flexibility, even with a small sample size. However, the sample size employed here does not permit us to perform analyses stratified by sex. Another limitation is the fact that the different study groups coexist in the same school and, thus, there was a possible risk of their influencing each other. However, this circumstance could, in turn, have certain advantages, such as better control of contingencies from outside the framework of the program involving pedagogy, material and installations. The assessment of the physical activity was carried out by means of a self-administered questionnaire completed before, during and after the intervention. Future studies should utilize objective methods of measurement, for example accelerometry, which would enable a more accurate assessment of daily physical activity.
One of the strengths of the study is the standardization and validation of the physical fitness tests employed in the European adolescent population.4, 21, 23, 24, 25 The high rate of participation in the program (96%), attendance at more than two thirds of the sessions by 84% of the sample and the high degree of satisfaction of the students following the application of the program should be considered strong points of the present study. The incorporation of programs of this type in the curriculum is especially difficult due to bureaucratic and administrative issues. However, the results derived from interventions of this type can potentially be extrapolated to other educational institutions.
CONCLUSIONSThe results suggest that doubling the academic load of PE is a great enough stimulus to achieve improvements in physical fitness, especially in aerobic capacity, a component that has been shown to have a close relationship to cardiovascular health in children and adolescents. The results of the present study, although preliminary, are promising.
FUNDINGThe present study was made possible by the material and human resources provided by two European projects funded by the European Commission: the HELENA study (Contract no. FOOD-CT-2005-007034) and the ALPHA study (Ref. no. 2006120). We also acknowledge Working Group 0123/07 of the Murcia II Center for Professors and Resources of the Department of Education, Training and Employment of the Region of Murcia, Spain. Some of the researchers involved in this study are funded by grants from the Spanish Ministry of Education and Science (EX-2008-0641; EX-2009-0899; JC 2009-00238), the Swedish Council for Working Life and Social Research (FAS) and the Swedish Heart-Lung Foundation (20090635).
Conflict of interestsNone declared.
Acknowledgments
We wish to thank the students and parents for their voluntary and unconditional participation in this study. We also thank Dr. Gutiérrez, Dr. Artero and Dr. Jiménez-Pavón for their participation in the measurements and their scientific advice.
Received 29 October 2010
Accepted 1 February 2011
Corresponding author: Instituto de Enseñanza Secundaria J. Martínez Ruiz Azorín, Camino Real 3, 30510 Yecla, Murcia, Spain. daniel.navarro@murciaeduca.es