Keywords
INTRODUCTION
The right heart chambers and pulmonarycirculation have important roles in cardiovascularhomeostasis both in normal and pathologicconditions. However, changes in their anatomy andfunction associated with disease have often been considered less relevant than those occurring on theleft side, particularly in the clinical setting. One of thereasons for this disparity is the earlier and broaderavailability of noninvasive imaging modalities foraccurate and reliable evaluation of left ventricularperformance. For a long time, invasive right heartcatheterization and contrast angiography have beenthe reference standards for the study of the anatomyof the right heart and pulmonary circulation, as wellas the hemodynamic impact of different diseases.Over the past 3 decades there has been a progressiveshift to a noninvasive approach, particularly becauseof improvements in echocardiography, computed tomography (CT) and magnetic resonance imaging(MRI).
The optimal imaging modality should be ableto evaluate not only the pulmonary circulationand the right cardiac chambers, but also the leftchamber and, ideally, pulmonary ventilation. Itwould be desirable that it provides high resolutionanatomical delineation together with functionalinformation such as blood flow patterns or dynamicchanges throughout the cardiac cycle. It should beaccurate, reproducible, widely available, completelynon-obtrusive and inexpensive. Unfortunately,no single modality fulfills all these requirementsand each has specific strengths and limitations. Inthis review we will address specific applicationsof different imaging techniques for the study ofthe right heart and pulmonary circulation, with aparticular emphasis on pulmonary hypertension(PH).
CHEST RADIOGRAPHY
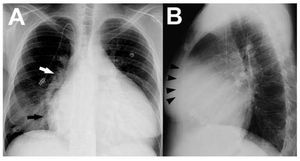
A chest roentgenogram is cheap and widelyavailable, but provides only rough informationregarding cardiopulmonary status. Althoughfairly sensitive, abnormalities in the plain chestx-ray often lack specificity.1 In the case of PH,radiographic signs tend to correlate poorly withdisease severity and commonly occur late in itscourse. Right atrial enlargement is best noted asa prominently convex lower right heart border,as the posteroanterior projection (Figure 1A).Right ventricular (RV) dilatation is best detectedon the lateral view when the cardiac silhouetteoccupies >40% of the lower retrosternal space(Figure 1B). In addition, enlargement of the rightheart chambers leads to posterior rotation of the cardiac axis and lateral displacement of the RVoutflow tract, which results in a more prominent"pulmonary artery" (PA) contour in the leftcardiac border. A radiographic examination canpotentially identify signs of underlying etiologies,such as lung parenchymal abnormalities or leftheart disease.2

Figure 1. A: postero-anterior chest roentgenogram in a patient withidiopathic pulmonary hypertension showing marked cardiomegaly, rightatrial enlargement (black arrow), dilated central pulmonary arteries (rightpulmonary artery, white arrow) and diffuse reduction in peripheralvascularity. An intravascular catheter for the infusion of medication is alsoseen. B: lateral chest x-ray in the same patient demonstrating enlargedright ventricle (black arrowheads).
Regarding the pulmonary circulation, enlargementof the central pulmonary arteries can be quantified byadding the horizontal distances of the first divisionsof the right and left pulmonary arteries to the midline,divided by the maximum transverse diameter of thethorax. A ratio >0.38 is often indicative of elevatedpulmonary pressures.3 Diameters of the right andleft descending PA diameters above 16 and 18 mm,respectively, on posteroanterior projections alsoindicate PH.4 Whereas peripheral vessel densityincreases in systemic-to-pulmonary shunts ("shuntvascularity"), a typical finding of advanced PHis reduced peripheral vessel caliber and density("pruning").2,5 Post-stenotic dilatation of the mainand left PA can be present in cases of pulmonaryvalve stenosis, whereas dilated PA and RV withoutshunt vascularity or pruning may indicate pulmonaryregurgitation. In addition, signs of PH with normallung parenchyma coupled with regional oligemiaare suggestive of chronic thromboembolic PH(CTEPH).2
ECHOCARDIOGRAPHY
Echocardiography is the most commonly usedimaging modality for routine clinical evaluationof the RV since it is widely available, extremelysafe and relatively inexpensive.5 The combinationof 2-dimensional (2D), M-mode, and Dopplerechocardiography allows for the simultaneous assessment of ventricular and valvular function.It provides invaluable hemodynamic informationwith flow characterization of both the left and rightheart. However, it is not well suited for studying thepulmonary vasculature (except for the main PA).In addition, standard techniques are limited dueto the complex RV geometry, retrosternal position,and the marked load dependence of RV functionindices, so quantification is often only an estimation.Recent advances may be used for complementaryinformation beyond standard 2D measurements(Table 1).

Standard Echocardiographic Modalities
Evaluation of the RV
Accurate evaluation of RV size, volume and,contractility requires a complete set of 2Dstandardized images.6 Typical changes in RV volumeand/or pressure overload include right atrial andRV enlargement, with or without RV hypertrophy,and RV systolic dysfunction (Figure 2A). A valueof end-diastolic free RV wall thickness above 5mm (measured in the subcostal 4-chamber view)indicates hypertrophy and is strongly associated withchronically increased afterload.7

Figure 2. A: four-chamber view of a 2Dechocardiogram in a patient with severepulmonary hypertension demonstrating anenlarged right ventricle (white arrow), asmall left ventricle (white arrowhead) andflattened septum. A pericardial effusion isindicated by the asterisk. In addition, colorDoppler demonstrated the presence oftricuspid regurgitation. B: continuousDoppler recording of the tricuspidregurgitation jet allows measurement of aregurgitant peak velocity (white arrow) of 3.9 m/s or a calculated peak pressuregradient of 60.8 mm Hg between the rightventricle and the right atrium.
RV volumes are difficult to quantify becauseof the complex RV geometry and the difficultyof tracing the markedly trabeculated endocardialsurface. Hence, 2D methods that rely on Simpson'sformula suffer from lack of standardization andtendency to underestimate volumes. Instead,visual estimation of the RV size relative to theleft ventricle or measurements of transverse andlongitudinal diameters are usually performed. Anabnormal pattern of interventricular septal motion(leftwards displacement in systole or diastolewhen pressure or volume overload, respectively,are present) reflects RV hemodynamics. Leftseptal bowing leads to ventricular under-fillingand reduced stroke volume, even in the presenceof normal systolic function (Figure 2A). The leftventricular eccentricity index is calculated as theratio of the antero-posterior to the septal-lateralshort axis cavity dimension of the left ventricle. Avalue of 1 is considered normal,8 and an elevateddiastolic eccentricity index has been associatedwith death or pulmonary transplant in idiopathicPH.9 In addition, the degree of septal curvatureand its relation to the left ventricular free wallcurvature can be used to estimate transeptalpressure gradients and RV systolic pressures.10
Longitudinal displacement of the RV annularsegment toward the apex (tricuspid annular peaksystolic excursion [TAPSE]) is measured withM-mode in the apical 4-chamber view. A value of <1.8 cm indicates RV dysfunction and has beenshown to predict survival in PH.11 This method showsa strong correlation with radionuclide angiographyRV ejection fracion12 even though it correlatedpoorly with MRI.13 Although fast and simple, itis a one-dimensional approach, reflecting mostlyregional (basal) RV systolic function. Assessmentof RV outflow tract fractional shortening may addvalue to TAPSE. Right ventricular fractional areashortening is defined as the percentage of change inthe RV chamber area in an apical 4-chamber viewduring the cardiac cycle, and seems to correlatebest with MRI.13 The Tei index or RV myocardialperformance index is a global assessment of bothRV systolic and diastolic function. It is the ratioof the total RV isovolumetric time (isovolumetriccontraction plus relaxation intervals) divided bythe RV ejection time.14 The normal value is 0.28 (0.04), and an elevated index (≥0.83) is associatedwith increased cardiac mortality and lungtransplantation in PH patients.15 The Tei indexhas shown significant correlation with RV ejectionfraction by nuclear ventriculography and has beenreported to be less affected by loading conditionsor heart rate.14,16
Hemodynamic Assessment of the PulmonaryCirculation
Doppler echocardiography allows non invasiveestimation of PA pressures and vascular resistance.The tricuspid regurgitant jet is the most commonmethod used in clinical practice to calculate thesystolic PA pressure via the Bernoulli equation as4v2 + right atrial pressure (Figure 2B), where v isthe peak regurgitant velocity (m/s). Right atrialpressure is estimated from the inferior cava veindiameter and its respiratory changes. A diameterin long axis <1.5 cm with normal respiratoryvariation (~50%) corresponds to right atrialpressures <10 mm Hg.6
The peak velocity of the pulsed-Doppler envelopeand the time to peak flow acceleration (accelerationtime) in the main PA are reduced in PH. A shorteracceleration time (<100 ms) is suggestive ofPH and a time <62 ms has been correlated withworsened survival in idiopathic PH.17 However,the acceleration time is dependent on heart rateand cardiac output and has to be interpreted withcaution. Diastolic PA pressure can be determinedalso from 4v2 + right atrial pressure, with v beingin this case the velocity of the end-diastolicpulmonary regurgitant jet. Another contributionof Doppler echocardiography is the estimation ofpulmonary vascular resistance, which is calculatedas the ratio of tricuspid regurgitation velocity(m/s) to the velocity-time interval (cm) of the RVoutflow. It has been validated in children withsevere PH18 and has shown excellent correlationwith invasive measurements.19 In addition, exerciseechocardiography may reveal exercise-inducedincrements in systolic PA pressure, a finding thatmight represent early stages of pulmonary vasculardisease.20
Emerging Echocardiographic Techniques
Three-Dimensional Echocardiography
In recent years, the introduction of newmatrix transducers as well as advances in imageacquisition and analysis have permited real-time 3Dechocardiography in the clinical setting.21 There arestill limitations related to limited temporal resolutionof real-time imaging or the need to average 4-7cardiac cycles with full volume imaging, which maycause artifacts in cases of arrhythmia.
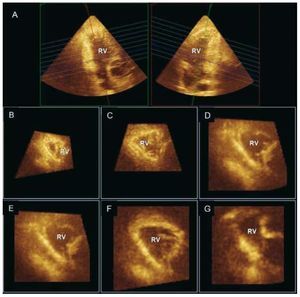
Direct visualization of the entire RV with 3Dechocardiography is possible using the full volumemode acquisition. This capability is particularlyattractive for the RV as it has the potential advantageto measure cardiac chambers without geometricassumptions. Both older22 and more recent real-time 3D techniques23,24 have been validated for RV volume quantification, information that can provideimportant prognostic information in various clinicalscenarios such as congenital heart disease.25 The non-planar geometry of the tricuspid valve hasbeen demonstrated, as well as how RV contributesto functional tricuspid regurgitation.26,27 Multiplane reconstruction analysis allows accurate evaluationof segmental RV geometry and function (Figure 3).In chronic PH secondary to left-sided heart disease,RV dilatation has been reported to occur mainly insegments closest to the outflow tract (basal and midlevels).28

Figure 3. Real-time 3D echocardiogram(Full volume mode acquisition) of the rightventricle (RV) reformatted into coronal (A,right), sagittal (A, left), and multiple short-axis views showing segmental geometryof the RV (B, C: apex; D, E: mid; and F, G:basal segments).
Tissue Doppler Imaging (TDI)
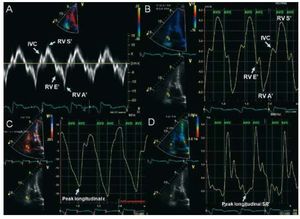
Pulsed-wave Doppler at the tricuspid annuluscan be used to measure low-frequency systolic anddiastolic velocities that reflect longitudinal RVmyocardial motion. Spectral TDI quantifies peak velocities (Figure 4A). There are good correlationsbetween TDI of the tricuspid annulus and RV ejectionfraction quantified by radionuclide angiography.29 A value of S' below 9.7 cm/s suggests abnormal RVcontractility,30 and may be useful in the detection ofearly RV dysfunction.31 S' is also lower in patientswith idiopathic PH than in normal controls, and isinversely related to PA pressures and resistance.32 Myocardial acceleration during isovolumetriccontraction is a new parameter of global RV systolicfunction, calculated as the maximal isovolumetricmyocardial velocity divided by time to peak velocity.It appears to be less load dependent than othermethods.33 Regarding RV diastolic function, TDImay be a useful modality, combined with pulsedwave Doppler analysis of the tricuspid inflow,allowing the quantification of the E/A, E/E' andE'/A' ratios. Isovolumetric relaxation time can beconsidered a simple method to estimate systolic PApressure when corrected for heart rate, and has beenshown to increase progressively in the presence ofPH.34 However, results should be interpreted withcaution when RV function is impaired.35

Figure 4. Example of tissue Dopplerimaging (TDI) and strain imaging displayedin a subject with normal right ventricular(RV) function. A: spectral TDI waveforms ofsystolic and diastolic RV function from thelateral tricuspid annulus. B: color TDIphases with the sample volume placed atthe basal RV wall. C: strain imaging withpeak longitudinal systolic strain of -26 %,and D: strain rate of -1.4 s-1, both at theRV basal level. AVO indicates aortic valveopening; AVC, aortic valve closure; IVC,isovolumetric contraction peak positivevelocity; RV A', atrial peak velocity (rightatrial contraction); RV E', early diastolicpeak velocity (during peak RV relaxation);RV S', systolic (ejection) peak velocity(during mechanical systole).
Color TDI acquires color-coded images of theRV and represents the average velocities within aspecific region of interest (Figure 4B). It allowssimultaneous evaluation of the annular, basal, mid,and apical segments within the same cardiac cyclein a reproducible fashion.36 Besides quantificationof myocardial velocity strain (percentage changein myocardial deformation) and strain rate (rateof myocardial deformation over time) can alsobe measured (Figure 4C and 4D).27 Both methodsimprove functional assessment in akinetic segmentstethered from normal myocardium that may havenormal myocardial velocities. For the RV, strainimaging has been limited to the apical 4-chamber view(longitudinal strain). Circumferential shortening isassessed in short axis view and remains a researchtool. RV myocardial velocities and deformation areimpaired in PH patients, particularly at the apex.37 Compared with spectral TDI, color TDI improvesspatial resolution of RV wall motion. However, it stillremains largely a research tool because of angle andframe rate dependence, complex post processing, lowtemporal resolution and relative lack of experience. Similarly, evaluation of RV dyssynchrony with TDIis still in early stages of development.
Speckle Tracking
Speckle tracking analyzes motion by trackingspeckles in the myocardium with an algorithm thatidentifies speckle location on sequential frames(velocity vector imaging) and derives strain values.It is less dependent on 2D image quality, frame rate,and angle, and has the ability to measure RV strainin both long and short axis planes. Several studieshave shown that it is a feasible and accurate methodto assess global and regional RV function in normalvolunteers and PH patients.38,39
Intracardiac echocardiography
An intravascular ultrasound catheter can provide 2D,color and pulsed Doppler views of intracardiac structures.Preliminary data on animal models demonstrates thefeasibility and accuracy of this technique for quantifyingRV volumes, and systolic function.40
NUCLEAR IMAGING
Advantages of nuclear techniques include thelack of geometric assumptions for count-basedmethods of RV ejection fraction quantification,high contrast-to-noise ratio and the possibility of simultaneously evaluating pulmonary ventilation/perfusion (V/Q scan). Main drawbacks includelimited spatial resolution, relatively prolongedimaging times and the need for radioisotopes.For the evaluation of the RV, many centers nowprefer other modalities such as echocardiographyor MRI that do not involve ionizing radiation andprovide superior resolution.
First-pass radionuclide ventriculography is basedon the detection and quantification with a gammacamera of the transit of a tracer bolus through theRV. The preferred agent is Technetium-99m labelleddiethylenetriamine pentaacetate (99mTc-DTPA),which has a fast renal elimination, resulting in lesspatient irradiation and allowing earlier repetitionof the study if necessary.41 A quality bolus injectionis crucial to provide enough RV counts, which willaffect the accurate determination of RV ejectionfraction. Normal values are 52% (6%) with a lowerlimit of 40%.42 Although limited by imaging in asingle plane, it allows good separation of the RVand right atrium, correlates well with right heartcatheterization and MRI (although with largelimits of agreement) and is considered the nuclearmethod of choice for RV assessment.43,44
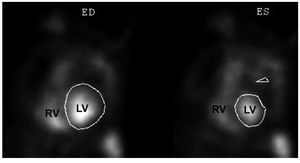
Functional indices can also be obtained duringa longer period and from multiple views withequilibrium blood pool scanning (Figure 5), which istechnically less demanding. Planar imaging is limitedbecause of overlap of the RV cavity with adjacent structures and is therefore not recommended.44,45 A promising alternative is tomographic imaging,which is theoretically advantageous as it provides atrue 3D dataset and allows for better separation ofcardiac chambers. However, this technique has notbeen extensively validated.43,46 Regarding myocardialimaging, preliminary data using positron emissiontomography in patients with PH demonstratesincreased uptake of 18F-fluorodeoxyglucose in theRV free wall that correlates with disease severity anddegree of RV overload.47

Figure 5. Left anterior oblique views of agated blood pool scan after injection ofred blood cell labeled in vivo with 99mTcpertechnetate. ED indicates end-diastole;ES, end-systole; LV, left ventricle; RV,right ventricle. Courtesy of Dr. MilenaHenzlova.
Lung V/Q scintigraphy is a well-validatedmodality for the evaluation of acute pulmonaryembolism because embolic material will causeregional hypoperfusion with preserved ventilation.These areas of perfusion mismatch constitutethe basis for diagnosis and also for grading theprobability of embolism according to establishedcriteria (Table 2 and Figure 6).48 Althoughaccurate, the relatively high rate of non-diagnosticintermediate probability scans represents oneof the most important limitations of lungscintigraphy.49 Tomographic imaging may improveimage quality and diagnostic performance.50 V/Q scanning is performed routinely in the diagnosticworkup of patients with PH. Because CTEPHmay be clinically indistinguishable from idiopathicPH, the possibility of chronic thromboembolismshould be considered in the absence of known PHetiology. In general, a lung V/Q scan is consideredthe test of choice because of higher sensitivitythan CT.2,51 A normal or "low-probability" studyportends a very low likelihood of CTEPH52,53; conversely, a relatively small perfusion defecton the V/Q scan may correspond to severeangiographic disease.54


Figure 6. Ventilation (V; top row) and perfusion (P; bottom row) lungscintigraphy in a patient with thromboembolic disease, demonstratingareas of ventilation/perfusion mismatch in the lower lobes. Perfusion wasstudied with 99mTc-macroaggregated albumin and ventilation withTechnetium-99m labelled diethylenetriamine pentaacetate (99mTc-DTPA).Ant indicates anterior; L, left; R, right; RAO, right anterior oblique. Courtesyof Dr. Josef Machac.
INVASIVE ANGIOGRAPHY
Invasive angiography remains the gold standardfor the evaluation of the pulmonary tree but hasbeen largely replaced by noninvasive modalities.Both RV and pulmonary angiography are costlyprocedures and do not come without risk, withmorbidity and mortality rates of 3.5%-6%, and 0.2%-0.5 %, respectively.55 Complications may arisefrom arrhythmia, acute increase in pulmonarypressures related to acute volume overload or othermechanisms. They appear to be more common inpatients with more severe PH and, particularly, moresevere RV dysfunction.56
RV cineangiograms obtained after theadministration of contrast through a pigtail orsimilar catheter (Figure 7) can provide accurateestimations of RV volumes and functionapplying Simpson's rule57 or simplified analyticalapproaches.58 These methods are nonethelesslimited by the need for geometrical assumptions.Invasive pulmonary digital subtraction angiography(DSA) can be employed in the diagnosis of acutepulmonary embolism when results are inconclusive,although this is an infrequent indication.49

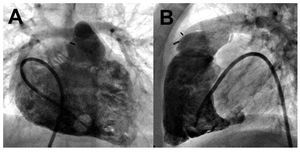
Figure 7. Biplane right heart contrastventriculography in a child with repairedtetralogy of Fallot. A: anterior projection;B: lateral projection. Courtesy of Dr. BarryLove.
However, DSA is commonly performed in thesetting of chronic PH after a positive result inthe lung V/Q scan. Typical angiographic signs ofCTEPH include: abrupt branch tapering, completevessel occlusion, luminal irregularities caused bymural clot, pouch-like regions related to occlusiveor sub-occlusive thrombi, and webs or bands thatmay cause branch narrowing and post-stenoticdilatation (Figure 8).59 It should be considered inpatients with unexplained dyspnea and segmentalor larger defects on ventilation-perfusion scanning, especially if there is echocardiographic evidenceof right atrial enlargement or RV dysfunction.The purpose of DSA is to confirm the diagnosisof CTEPH and to define the location of occlusiveemboli, as successful thromboendarterectomyis more likely if thrombi involve the main, lobar,or proximal segmental arteries.60 DSA is stillconsidered the procedure of choice for presurgicalplanning over alternative noninvasive modalitiessuch as MRI and CT.2,61 Inconclusive results ofDSA may lead to further preoperative invasiveimaging with fiberoptic angioscopy.60

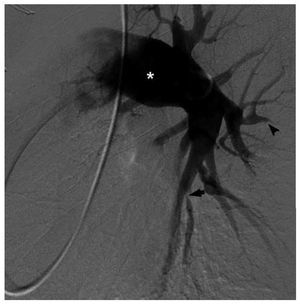
Figure 8. Digital subtraction angiography of the left pulmonary circulationin a patient with chronic thromboembolic pulmonary hypertension. There isdilatation of the central arteries (asterisk) as well as areas of luminalstenoses (arrow) and vessel occlusion (arrowhead). Courtesy of Dr. RobertLookstein.
COMPUTED TOMOGRAPHY
Contrast-enhanced CT angiography is the mostcommonly used technique for the evaluation of thepulmonary vasculature. It provides 3D datasetswith excellent isotropic spatial resolution (sub-millimeter with current multidetector scanners) invery short scanning times. In addition, the lungparenchyma can be simultaneously evaluatedand electrocardiographic gating allows for thestudy of cardiac function. On the other hand, CT offers only limited functional information (ie,flow) and requires iodinated contrast and ionizingradiation.
One of the most frequent indications is thesuspicion of acute pulmonary embolism (Figure 9).Although DSA has been traditionally consideredthe gold standard, in clinical practice CT is the firsttest performed in most centers.49 Reduced sensitivityfor the detection of sub-segmental emboli has beenconsidered the main limitation of CT, even thoughthe probability of clinical recurrence in patients witha normal study is very low.62 Multidetector scannersallow for the evaluation of pulmonary vesselsdown to 6th-order branches and appear to increasesignificantly the detection rate of distal pulmonaryemboli. In the multicenter Prospective Investigationof Pulmonary Embolism Diagnosis II (PIOPED II)study, the sensitivity, specificity, positive predictivevalue and negative predictive value of multidetectorCT angiography were 83%, 96%, 86%, and 95%,respectively.63 In comparison with pulmonary V/Qscintigraphy, CT seems to diagnose a larger numberof emboli.64 In CTEPH, CT is also highly accurateand can depict a number of findings similar to thosein DSA.65 However, using invasive DSA as the goldstandard, CTA is not yet considered sufficientlyaccurate to replace lung V/Q scintigraphy.2

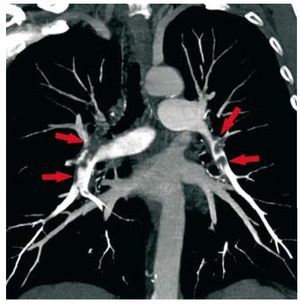
Figure 9. Coronal maximum intensity projection reconstruction of acomputed tomography pulmonary angiogram in a patient with multiple,bilateral pulmonary embolisms (arrows).
CT can reveal other findings suggestive of PH,regardless of the underlying etiology. The degree ofenlargement of central pulmonary arteries correlatesmoderately with disease severity and a ratio betweenthe main PA and the ascending aorta diameters >1or a main PA diameter ≥29 mm are fairly specificmarkers of PH, although with limited sensitivity.66,67 An asymmetrical dilatation of the main arteriessuggests CTEPH.65 In patients with an acutepulmonary embolism, a right-left maximal ventriculardiameter ratio >0.9 in a reformatted 4-chamber viewindependently predicts 30-day mortality.68 Image acquisition with retrospective electrocardiographicgating has been validated as an accurate modalityfor the quantification of RV volumes and functionin comparison with magnetic resonance (Figure 10), although at the expense of increased radiationdose.69 The feasibility of detecting RV dysfunctionin patients with an acute pulmonary embolism hasbeen reported70; however, its prognostic significanceor its application in chronic PH have not been testedsystematically.

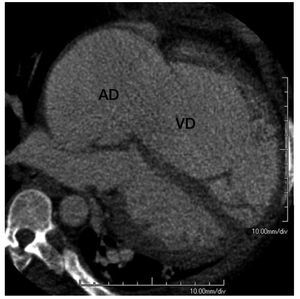
Figure 10. Multiplanar reformation in a 4-chamber view orientation ofcardiac computed tomography in a patient with severe right atrial (RA) andright ventricular (RV) enlargement due to tricuspid regurgitation.
Simultaneous evaluation of the lung parenchymamay point to specific etiologies of PH, as manyfeatures of obstructive or interstitial lung diseasecan be readily identified. A mosaic pattern incombination with signs of PH may be caused by heterogeneous lung perfusion and is highlysuggestive of CTEPH.71 Prior pulmonary infarcts(wedge-shaped consolidations in subpleuralregions) also support the diagnosis of CTEPH.65 Other indirect signs of increased systemic venouspressure include enlargement of the superior andinferior vena cava, ascitis and pericardial and/orpleural effusions.
MAGNETIC RESONANCE IMAGING
MRI has evolved in the last decade as one ofthe most attractive imaging modalities for thestudy of both the right heart and the pulmonarycirculation.72,73 It has a good balance of high spatial, temporal and contrast resolution, canobtain images in any desired orientation and hasno "acoustic" window limitations. It is also safe,highly accurate and reproducible, and provides bothanatomic and functional information. The mainlimitations are cost, less widespread availability andexperience, and constraints related to the magneticfield. In addition, there has been concern on thepotential association of gadolinium contrast agentswith nephrogenic systemic fibrosis. In the specificcontext of PH, MRI has limited ability to quantifyPA pressures.74
Evaluation of the RV
MRI is currently considered the gold standardfor the quantification of RV volumes and ejectionfraction.31 The most commonly employed approachis to apply Simpson's method to a stack ofcontiguous short-axis cine loops acquired from baseto apex. This approach is highly accurate and doesnot rely on geometrical assumptions.73,75 The good interstudy reproducibility also indicates a role forMRI in the serial follow-up of patients, for examplein the evaluation of the effect of therapies.76 The degree of RV dilatation, hypertrophy and systolicdysfunction is directly proportional to the severityof PH. As an example, an RV to left ventricularmass ratio >0.6 detects PH with a sensitivity of 84%and a specificity of 71% and has been reported tobe more specific than Doppler echocardiography.77
Importantly, quantification of RV functionalparameters appears to add prognostic information,as demonstrated in a study of patients withidiopathic PH in whom a RV end-diastolic volumeindex ≥84 mL/m2 and a left ventricular end-diastolicvolume index ≤40 mL/m2 were independentpredictors of 1-year mortality.78 More sophisticatedanalyses of RV performance can be obtained withsimultaneous quantification of pressures withMRI-compatible catheters to derive RV volume/pressure loops.79 Myocardial tagging has been used to detect abnormal regional RV strain patterns inPH, although this technique has limited resolutionand requires long post-processing times. Theselimitations can be overcome with recently developedstrain encoded MRI.80 Alternatively, myocardialvelocities can be quantified using phase-contrastimaging in a manner similar to DTI.81
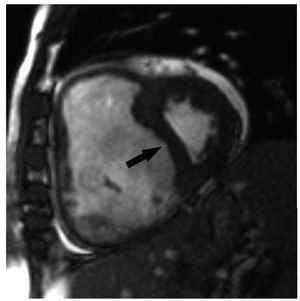
MRI can also be employed to quantifyinterventricular septal curvature (Figure 11), definedas the inverse of the radius. End-systolic septalcurvature correlates strongly with PH severity andleftwards septal bowing has been associated with asystolic PA pressure >67 mm Hg.82 The comparisonbetween the curvatures of the interventricularseptum and of the left ventricular free wall can alsobe used to quantify systolic PA pressure accurately.83 Delayed contrast enhancement indicative of fibrosiscan be noted in PH patients at the level of the septalinsertion sites of the RV and often extending into theinterventricular septum, a finding associated withparadoxical septal motion. The extent of fibrosiscorrelates directly with the degree of PH and is seenirrespective of PH etiology, probably representingincreased mechanical stress at these points.84,85 It is currently unknown if this finding carries clinicalimplications.

Figure 11. PShort axis view obtained with magnetic resonance imaging ina patient with severe pulmonary hypertension. There is severe enlargementof the right ventricle which leads to septal bowing (arrow) and compressionof the left ventricle.
Evaluation of the Pulmonary Circulation
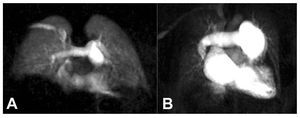
High-resolution magnetic resonance angiographycan be employed to detect pulmonary emboli or depict typical features of chronic PH or CTEPH.86,87 Using this approach, preliminary reports suggestgood diagnostic accuracy for the differentiationof idiopathic PH from CTEPH.87 In comparisonwith DSA and CT, MRI offers excellent depictionof proximal abnormalities but accuracy is lowerfor subsegmental vessels.49,86,87 In addition, time-resolved magnetic resonance angiography canbe used to visualize the dynamic passage of thecontrast through the lung vasculature (Figure 12).This technique can be employed to analyze lungperfusion in a manner that correlates well withnuclear scintigraphy.87,88 Preliminary data alsodemonstrates the feasibility of evaluating lungventilation with MRI.89

Figure 12. Coronal time-resolvedmagnetic resonance angiography in anormal subject (A) and in a patient withidiopathic pulmonary hypertension (B).Note the central pulmonary arteryenlargement and the diffuse peripheralhypoperfusion in the patient withpulmonary hypertension.
Measurement of blood velocities with phase-contrast imaging is usually employed for the accuratequantification of systemic-to-pulmonary flow ratiosin patients with congenital shunts.90 In addition,flow profiles in the cross-section of the main PAor its branches can be accurately characterized.91 Numerous parameters have shown correlationwith the degree of elevation of PA pressures and/or resistance, although with inconsistent results.74 An average blood flow velocity <11.7 cm/s providesa sensitivity and specificity of 93% and 82%,respectively, for the detection of PH.92 More recently,3D phase-contrast MRI revealed abnormal patternsin the main PA (end-systolic flow vortices andprolonged anterograde diastolic flows) that enableddifferentiating patients with PH at rest, exercise-induced PH or no PH.93 In addition, phase-contrastor cine imaging can be employed to evaluate dynamicchanges in arterial cross-section and thereforepulmonary artery stiffness.94 A change in PA cross-sectional area <16% during the cardiac cycle wasidentified recently as a predictor of mortality inPH.95 Also, alterations in PA elasticity can bedetected before overt PH occurs and these may beuseful for early detection of abnormal circulatoryphysiology.96
CONCLUSION
Several imaging modalities can be combinedtoday for the evaluation of the right heart andthe pulmonary circulation. Advances in nucleartechniques, echocardiography, CT and MRI haveexpanded our understanding of the crucial roles ofthe minor circulatory system in many pathologicstates. Continuing technological advances,particularly in the field of MRI, promise to furtherimprove our ability to detect early disease stagesor evaluate the mechanisms of action and efficacyof novel therapeutic interventions Advances inmolecular imaging with any of these modalitieswill be of particular interest in the evaluation ofmultiple biological processes in vivo.
ABBREVIATIONS
CT: computed tomography
CTEPH: chronic thromboembolic pulmonaryhypertension
DSA: digital subtraction angiography
MRI: magnetic resonance imaging
PA: pulmonary artery
PH: pulmonary hypertension
RV: right ventricle
TAPSE: tricuspid annular plane systolicexcursion
TDI: tissue Doppler imaging
V/Q: ventilation/perfusion ratio
2D: two-dimensional
3D: three-dimensional
Correspondence: Dr J. Sanz.
Cardiovascular Institute, Mount Sinai Hospital,
One Gustave L Levy Place, Box 1030. New York, NY 10029.
E-mail: Javier.Sanz@mssm.edu