An experimental model is used to analyze the characteristics of ventricular fibrillation in situations of variable complexity, establishing relationships among the data produced by different methods for analyzing the arrhythmia.
MethodsIn 27 isolated rabbit heart preparations studied under the action of drugs (propranolol and KB-R7943) or physical procedures (stretching) that produce different degrees of change in the complexity of myocardial activation during ventricular fibrillation, use was made of spectral, morphological, and mapping techniques to process the recordings obtained with epicardial multielectrodes.
ResultsThe complexity of ventricular fibrillation assessed by mapping techniques was related to the dominant frequency, normalized spectral energy, signal regularity index, and their corresponding coefficients of variation, as well as the area of the regions of interest identified on the basis of these parameters. In the multivariate analysis, we used as independent variables the area of the regions of interest related to the spectral energy and the coefficient of variation of the energy (complexity index=–0.005×area of the spectral energy regions –2.234×coefficient of variation of the energy+1.578; P=.0001; r=0.68).
ConclusionsThe spectral and morphological indicators and, independently, those derived from the analysis of normalized energy regions of interest provide a reliable approach to the evaluation of the complexity of ventricular fibrillation as an alternative to complex mapping techniques.
Keywords
.
IntroductionVentricular fibrillation (VF) is a life-threatening arrhythmia present in a great number of cases of sudden death occurring with or without a history of heart disease.1 The treatment is based on electrical cardioversion, the efficacy of which is related, among other factors, to the characteristics of the myocardial activation, which change depending on the time elapsed since the onset of the arrhythmia, metabolic deterioration, drugs administered, or the substrate.2–6
The interest in analysis of the characteristics and complexity of myocardial activation during VF is twofold. On the one hand, it is of clinical interest, as it may aid in predicting the difficulty involved in reverting the arrhythmia and restoring cardiac mechanics.7,8 On the other hand, an experimental analysis of this type makes it possible to describe the effects of different factors on the mechanisms of onset, perpetuation, and cessation of VF.9–16
Among the approaches to the analysis of myocardial activation during VF are those based on recordings obtained with electrocardiographic leads or mapping techniques using multielectrodes or optical systems.7,8,11,17 However, the available information on the relationship between the parameters obtained is limited.
The objective of the present report is to analyze in an experimental model the characteristics of VF in situations with different degrees of complexity and establish, by means of multivariate analysis, the relationship between the data provided by different methods of analyzing the fibrillation signals. The study is based on the hypothesis that it is possible to establish indicators of the degree of complexity of myocardial activation during VF other than those provided by the complex conventional mapping procedures and that this would help us to quantify the changes in VF, either spontaneous or induced by drugs or other manipulations, and thus characterize the arrhythmia. The availability of these indicators would enable us to utilize those that are most suitable or less complex, depending on the experimental conditions or the available methodology.
For this purpose, we employed a model involving isolated perfused rabbit hearts subjected to different situations (myocardial stretch and drugs) that in previous studies have exhibited different degrees of changes in the complexity of myocardial activation during VF.16,18 The recordings were obtained with a multiple-electrode epicardial lead that enabled us to process the information using procedures based on the spectral and morphological analysis of the signals, together with mapping techniques.
MethodsExperimental PreparationThe experiments were performed in accordance with Spanish Royal Decree 1201/2005, dated 10 October 2005, on the use of animals in research. The methodology applied was described in previous studies.16,18 We used rabbit preparations (n=27), isolated and perfused according to the Langendorff technique, in which unipolar epicardial recordings were obtained from the central portion of the left ventricular free wall with a multielectrode array consisting of 121 stainless steel unipolar electrodes (diameter, 0.125mm; interelectrode distance, 1mm) arranged in a quadrangle formed by 11 rows of 11 electrodes covering a surface area of 1cm2 (anterolateral wall).
The recordings of the epicardial activity were acquired using the cardiac mapping system MAPTECH® (Waalre, The Netherlands), which consists of a multichannel system equipped with amplification with a gain of 100 to 300, a band filter between 1 and 400, and multiplexing at a sampling frequency of 1kHz in each channel. Once the preparation had been established, VF was induced by stimulation at frequencies that increased from 4Hz to 20Hz. Coronary perfusion was maintained during arrhythmia. In one of the series, local stretch was induced in left ventricular free wall in accordance with the previously described method.16,18
Experimental SeriesThe VF recordings were obtained in 4 situations: a) in preparations not subjected to modifications (n=9); b) in these same preparations during the application of acute stretch on left ventricular free wall16,18; c) during propranolol perfusion (1μM) (n=9)16,19–21; and d) during the perfusion of the sodium/calcium exchanger inhibitor, KB-R794322–25 (1μM) (n=9).16
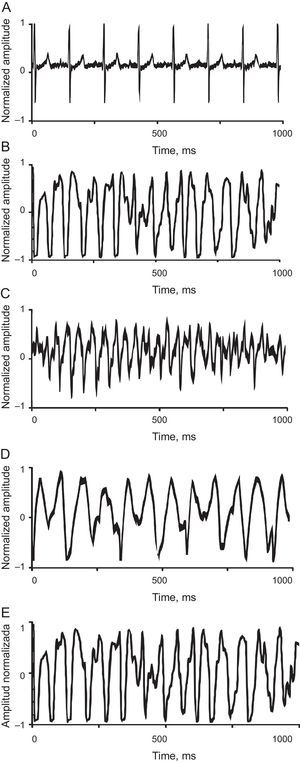
The VF recordings acquired without introducing modifications (controls) or under the effects of propranolol or KB-R7943 were obtained in a stable situation, 5min after induction of the arrhythmia. Those corresponding to myocardial stretch were obtained 3min after initiation of the stretching, which was applied 5min after induction of the arrhythmia in the control series (Fig. 1). This time window was chosen because it corresponds to the moment of maximum effect of stretch on the activation pattern during VF.16,18 The concentrations of KB-R7943 and propranolol were within the same range employed to analyze their effects.16,20,22–25

A: ventriculogram in sinus rhythm recorded in a heart from the control group. B: tracing from the control group during fibrillation. C: tracing from the control group showing fibrillation during stretch. D: tracing from the propranolol group showing fibrillation during infusion. E: tracing from the KB-R7943 group showing fibrillation during infusion. The tracings during ventricular fibrillation correspond to 1 s of recording.
Segments of 4096 samples were processed (sampling frequency, 1kHz). The regularity of the morphology of the signal and its characteristics were analyzed in the frequency domain; the latter were assessed by obtaining the frequency spectrum using the Welch periodogram.26 We identified the dominant frequency (DF) in the spectrum and the normalized energy (NE), defined as the spectral energy in a window centered on DF±1 Hz normalized by the spectral energy in the band of interest (5 Hz to 35 Hz).
The morphological regularity was analyzed by calculating, for each electrode, the regularity index (RI) proposed by Faes et al.27 in atrial fibrillation, which was modified to adapt it to the model employed here.28 This index quantifies (with a score of 0 or 1) the regularity of the signal, analyzing the similarity between local activation waves in the segment being considered. The algorithm consists of: a) bandpass filtering to eliminate fluctuations, atrial activity, and high-frequency noise (40th order FIR [finite impulse response] filter, 5-Hz to 40-Hz bandpass filter with a Kaiser window); b) detection of local activation waves (maximum slope criteria); c) determination of the activation times; d) normalization of the local activation waves, and e) calculation of the differences between the activation waves to evaluate their similarity.
The index used in the present report is a morphological RI of the local activation waves.27,28 It differs from that employed by other authors, which involves spectral techniques to avoid the utilization of DF obtained from signals with a poor signal-to-noise ratio.29
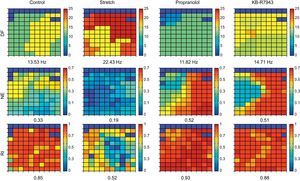
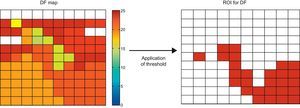
Spatial Distribution of the ParametersFor each parameter (DF, NE, and RI), we obtained a map showing the values recorded by all the electrodes (Fig. 2). We calculated the mean value and the coefficient of variation (CV) for each map. To analyze the regularity in the spatial distribution of the parameters, we calculated the corresponding regions of interest (ROI). The ROI were utilized in the field of view of the VF analysis to obtain information on the degree of dispersion of the frequency and its temporal stability.30 The generation of the ROI from the electrodes map was carried out in a first phase by determining which of them exceeded the threshold obtained experimentally on the basis of a set of recordings (Fig. 3). Subsequently, these electrodes were grouped in a single ROI according to their vicinity. Thus, in the case of the RI or the NE, a channel was included in a ROI if the value of the parameter exceeded the threshold. In the case of the DF, the criteria employed was to consider whether its value fell in the range of the mean DF (1Hz), where the mean DF was the mean value of the DF in the set of electrodes in the map. From the ROI, two additional parameters were calculated: a) the area of the ROI (AROI) that corresponds to the percentage of the area of the map occupied by the ROI, which indicates the degree of spatial regularity of the parameter, and b) the number of ROI (NROI) detected in the map, which has arbitrarily been considered to represent a measurement of spatial fragmentation, since its increase would indicate a greater variability in the parameter being considered.
 and for the 3 indices employed: dominant frequency, normalized energy, and regularity index. The mean values are indicated in each case. DF, dominant frequency; NE, normalized energy; RI, regularity index.")
Representation of the matrices corresponding to the electrodes in the multielectrode array in an example of each of the 4 situations considered (control, stretch, propranolol, and KB-R7943) and for the 3 indices employed: dominant frequency, normalized energy, and regularity index. The mean values are indicated in each case. DF, dominant frequency; NE, normalized energy; RI, regularity index.

Acquisition of regions of interest on the basis of the dominant frequency map. A threshold was applied to the dominant frequency values of each channel. A channel corresponds to a region of interest if the dominant frequency lies within the range mean dominant frequency ± 1Hz, in the group of electrodes of the map. The threshold changes depending on the type of parameter. For the regularity index and normalized energy a simple threshold is applied; thus, the channels in which the value exceeds it correspond to the region of interest. DF, dominant frequency; ROI, regions of interest.
We analyzed the activation maps during VF, segmenting the recording time into 100-ms intervals. Thus, in each recording, we constructed 20 maps in which the initiation of the time window being considered was taken as zero. After determining the local activation times with respect to this zero value, we constructed the isochrones and identified the wavefronts and the presence of conduction block lines following the methodology utilized in previous studies.4,16 Depending on the complexity of the maps, 3 types were established17,31: type I, characterized as having a single wavefront without block lines or areas of slow conduction; type II, having 2 wavefronts with areas of block or slow conduction; and type III, exhibiting the maximum complexity, with 3 or more wavefronts associated with areas of block and of slow conduction. Once the activation maps had been characterized, the complexity index (CI) was utilized, applying the formula CI=[number of type I maps×0.1)+(number of type II maps×1)+(number of type III maps×2)]/(number of maps analyzed).
Statistical CalculationsThe data are presented as the mean (standard deviation). The differences between continuous variables were analyzed using Student t test for paired samples in the comparisons of the baseline values versus stretch, as they belong to the same group, and also for independent samples to compare both the propranolol group and the KB-R7943 group with the control group. A P value less than .05 was considered to indicate statistical significance in every case. The multivariate analysis was performed using a stepwise multiple linear regression model.
The IBM SPSS Statistics® statistical software package (version 19) was employed for all the calculations.
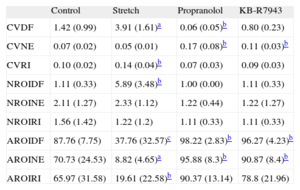
ResultsCoefficients of Variation of the Parameters Obtained in the Spectral AnalysisTable 1 shows the results obtained in the different experimental series. Compared with the control values, the CV of the DF was higher during stretch (P<.0001) and lower in the propranolol group (P<.05), whereas no significant differences were observed in the KB-R7943 group. The CV of the NE (CVNE) was higher in both the propranolol group (P<.05) and the KB-R7943 group (P<.05).
Values of the Coefficients of Variation Related to the Spectral Values and to the Regions of Interest Obtained in Each of the Experimental Series
| Control | Stretch | Propranolol | KB-R7943 | |
| CVDF | 1.42 (0.99) | 3.91 (1.61)a | 0.06 (0.05)b | 0.80 (0.23) |
| CVNE | 0.07 (0.02) | 0.05 (0.01) | 0.17 (0.08)b | 0.11 (0.03)b |
| CVRI | 0.10 (0.02) | 0.14 (0.04)b | 0.07 (0.03) | 0.09 (0.03) |
| NROIDF | 1.11 (0.33) | 5.89 (3.48)b | 1.00 (0.00) | 1.11 (0.33) |
| NROINE | 2.11 (1.27) | 2.33 (1.12) | 1.22 (0.44) | 1.22 (1.27) |
| NROIRI | 1.56 (1.42) | 1.22 (1.2) | 1.11 (0.33) | 1.11 (0.33) |
| AROIDF | 87.76 (7.75) | 37.76 (32.57)c | 98.22 (2.83)b | 96.27 (4.23)b |
| AROINE | 70.73 (24.53) | 8.82 (4.65)a | 95.88 (8.3)b | 90.87 (8.4)b |
| AROIRI | 65.97 (31.58) | 19.61 (22.58)b | 90.37 (13.14) | 78.8 (21.96) |
AROIDF, area of the regions of interest for the dominant frequency; AROINE, area of the regions of interest for normalized energy; AROIRI, area of the regions of interest for the regularity index; CVDF, coefficient of variation of the dominant frequency; CVNE, coefficient of variation of the normalized energy; CVRI, coefficient of variation of the regularity index; NROIDF, number of regions of interest for the dominant frequency; NROINE, number of regions of interest for the normalized energy; NROIRI, number of regions of interest for the regularity index. The area of the regions of interest is expressed in arbitrary units.
The RI was lower during myocardial stretch, and higher under the action of either propranolol or KB-R7943 (control, 0.80 [0.04]; stretch, 0.64 [0.11], P<.0001; propranolol, 0.92 [0.04], P<.0001; KB-R7943, 0.87 [0.02], P<.001). The CV of the RI was higher during stretch, and no significant differences were observed under the other conditions (Table 1).
Spatial Distribution of the Parameters: Regions of InterestNumber of Regions of InterestTable 1 shows the NROI in relation to the parameters DF, NE, and RI. During myocardial stretch, the NROI generated in the assessment of the DF was higher (P<.05) and there were no differences under the other conditions. There were no differences in the NROI associated with the NE or in the NROI constructed when the RI was considered.
Area of the Regions of InterestDuring stretch, the AROI related to the DF was smaller (P<.001); it was greater (P=.05) under the other conditions. The AROI related to the NE (AROINE) decreased during stretch (P<.0001), and was greater with both propranolol (P<.05) and KB-R7943 (P<.05). That associated with the RI was smaller during myocardial stretch (P<.05) (Table 1).
Complexity Index Derived From the Analysis of the Activation MapsThe CI was higher during stretch (baseline, 1.09 [0.26]; stretch, 1.48 [0.21]; P<.05) and lower in the group perfused with propranolol (0.57 [0.23]; P<.0001). There were no differences compared to the group perfused with KB-R7943 (1.00 [0.25]).
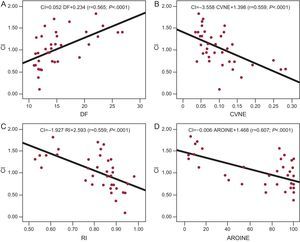
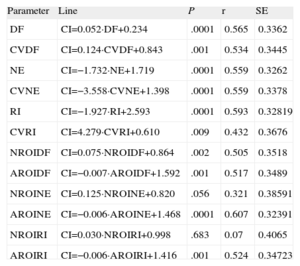
Multivariate AnalysisThe correlation coefficients obtained when the CI was related to the remaining variables considered separately (Fig. 4) were significant in every case except for the evaluation of the NROI for the NE (P=.056) and the NROI for the RI (P=.68). Table 2 shows the regression lines obtained in each case.

Regression lines obtained upon relating the complexity index to the dominant frequency in graph A, to the coefficient of variation of normalized energy in graph B, to the regularity index in graph C, and to the area of the regions of interest of the normalized energy in graph D. AROINE, area of the regions of interest of the normalized energy; CI, complexity index; CVNE, coefficient of variation of normalized energy; DF, dominant frequency; RI,regularity index.
Regression Lines Obtained Upon Relating the Complexity Index of the Activation Maps to the Remainder of the Parameters Considered
| Parameter | Line | P | r | SE |
| DF | CI=0.052·DF+0.234 | .0001 | 0.565 | 0.3362 |
| CVDF | CI=0.124·CVDF+0.843 | .001 | 0.534 | 0.3445 |
| NE | CI=−1.732·NE+1.719 | .0001 | 0.559 | 0.3262 |
| CVNE | CI=−3.558·CVNE+1.398 | .0001 | 0.559 | 0.3378 |
| RI | CI=−1.927·RI+2.593 | .0001 | 0.593 | 0.32819 |
| CVRI | CI=4.279·CVRI+0.610 | .009 | 0.432 | 0.3676 |
| NROIDF | CI=0.075·NROIDF+0.864 | .002 | 0.505 | 0.3518 |
| AROIDF | CI=−0.007·AROIDF+1.592 | .001 | 0.517 | 0.3489 |
| NROINE | CI=0.125·NROINE+0.820 | .056 | 0.321 | 0.38591 |
| AROINE | CI=−0.006·AROINE+1.468 | .0001 | 0.607 | 0.32391 |
| NROIRI | CI=0.030·NROIRI+0.998 | .683 | 0.07 | 0.4065 |
| AROIRI | CI=−0.006·AROIRI+1.416 | .001 | 0.524 | 0.34723 |
AROIDF, area of the regions of interest for the dominant frequency; AROINE, area of the regions of interest for the normalized energy; AROIRI, area of the regions of interest for the regularity index; CI, complexity index; CVDF, coefficient of variation of the dominant frequency; CVNE, coefficient of variation of the normalized energy; CVRI, coefficient of variation of the regularity index; DF, dominant frequency; NE, normalized energy; NROIDF, number of regions of interest for the dominant frequency; NROINE, number of regions of interest for the normalized energy; NROIRI, number of regions of interest for the regularity index; RI, regularity index; SE, standard error.
Units employed: the area of the regions of interest is expressed in arbitrary units. The dominant frequency is expressed in hertz.
Three models were considered in the multivariate analysis when the CI obtained from the mapping analysis was utilized as a dependent variable. In the first model, we took as independent variables all those that reached P<.1 in simple regression analyses. This model accepted two variables, the AROINE and the CVNE. The equation obtained was: CI=−0.005·AROINE−2234·CVNE+1578 (P<.0001; r=0.681; standard error of the estimate=0.30).
In the second model, we included as independent variables those identified in the spectral and morphological analyses, excluding those related to the ROI. In this model, we accepted the variables NE and CVNE. The equation obtained was: CI=−1265·NE−2331·CVNE+1773 (P<.0001; r=0.680; standard error of the estimate=0.30).
In the third model, we considered those of the second model except those related to the NE. In this model, the only variable accepted was the RI. The equation obtained was: CI=−1927·RI+2593 (P<.0001; r=0.593; standard error of the estimate=0.33).
DiscussionThis report has three main findings: a) the complexity of VF, evaluated by analyzing the characteristics of the epicardial activation maps, correlates with the parameters derived from the spectral and morphological analyses of the signals with their CVs; b) the AROI identified using parameters derived from the spectral and morphological analyses of the signals also correlate with said complexity, and c) the multivariate analysis demonstrates an independent association when the AROI identified on the basis of the NE and its CV are considered.
Spectral Analysis and Complexity of Ventricular FibrillationThe spectral analysis of the fibrillation signals has facilitated the study of a number of aspects of myocardial activation during both atrial and VF.3,4,16,30,32–38 The determination of the DF provides information directly related to the activation cycles and enables us to rapidly obtain information on local and temporal changes in the activation processes during arrhythmias of this type. On the other hand, the analysis of the dispersion of the energy of the frequency spectrum using parameters such as the spectral concentration around the DF provides information on the regularity of the arrhythmia and even enables the establishment of correlations between the degree of fractionation of the signals and their DF.39 Among the limitations of these techniques are a number of aspects related to the type of recordings, the presence of artifacts, the stability of the signals, or the rate of the temporal changes.33,34,40 In the present report, we used unipolar recordings and, when considering the parameters derived directly from the spectral analysis (DF, NE, and their CVs) separately, we observed that they were related to the complexity of the VF established by the analysis of the activation maps. Both the increase in the DF—that is, the acceleration of the arrhythmia—and that of its CVs have been associated with greater complexity and lack of organization of the activation during VF. On the other hand, the decrease in NE—that is, a lower concentration of the frequency spectrum around the DF—and its CV have also been associated with activation maps that are more complex, with a greater number of activation fronts and areas of conduction block. The univariate analysis demonstrated an inverse correlation with the latter parameters, a fact that would be associated with a reduced presence of high spectral concentration levels in the cases of greatest complexity of myocardial activation and, thus, a lower degree of variability in this parameter.
Morphological Analysis of the SignalsThe morphological analysis of the electrograms was utilized to define patterns of organization of the myocardial activation in the context of different arrhythmias, both atrial and ventricular. Among the characteristics analyzed are aspects related to the regularity of the signals, the presence of alternans, the fractionation of electrograms, and the association of certain types of signals with the existence of rotors, areas of slow conduction or block, or the collision of activation fronts.17,27,28,31,40–43 This type of analysis has been used in atrial fibrillation to establish associations between the complexity of the electrical activation and the anatomical regions in which the recordings are made.42 Studies of myocardial activation during atrial fibrillation have demonstrated a decrease in the RI as the complexity increases.27 In the present report, we used this index in VF and evaluated its relationship to the complexity. Univariate analysis demonstrated a good correlation between the parameters obtained from the morphological approach to signal analysis and those resulting from the mapping approach based on the analysis of activation maps. In the multivariate analysis, the information provided by the RI was not independent of that obtained with the parameters derived from the analysis of the ROI or of the spectral energy; thus, we only considered the RI after excluding the parameters mentioned above.
Regions of Interest Obtained From the Spectral and Morphological AnalysisChoi et al.30 applied the analysis of the regional and temporal changes in the activation frequency during VF to study the characteristics of this arrhythmia. They used analytical procedures based on the identification of clusters of frequencies grouped around the predominant values, which constitutes the basis for the procedure utilized in the present study to characterize the so-called ROI, from which we obtained variables related to their area and number. Although the latter did not provide relevant information, the AROI constructed from the NE of the spectrum constitute one of the variables accepted in the multivariate model when we considered all the variables employed in the present study. Thus, the high values for the AROI obtained using the information provided by the analysis of the spectral energy concentration are related to a lower degree of complexity of the myocardial activation during VF. This relationship is independent of that observed with the other variables.
Clinical UtilityThe availability of indicators of the degree of complexity of VF could be useful in circumstances in which it is necessary to characterize the effects of different factors on fibrillation processes, which include metabolic deterioration, ischemia and reperfusion,3–6 drugs,4,16 and hypothermia,10 and in certain cases to help to establish situations more suitable for achieving effective defibrillation.7
LimitationsThe extrapolation of the results obtained to the clinical setting must take into account the characteristics of the experimental model employed, in which interspecies differences and those related to the recording techniques influence the results. Moreover, in this study, we did not consider other situations involving changes in the characteristics of the VF, such as those observed during the metabolic deterioration induced by the absence of myocardial perfusion, as occurs when VF develops in the in situ heart.
ConclusionsThe spectral and morphological indicators and, independently, those derived from the analysis of the ROI in the NE provide a reliable approach to the evaluation of the complexity of VF, constituting an alternative to complex mapping procedures.
FundingThis study was carried out with research grants from the Instituto de Salud Carlos III (FIS PS09/02417 and RETIC REDINSCOR RD06/0003/0010) and the Generalitat Valenciana (PROMETEO 2010/093), Spain.
Conflicts of interestNone declared.