The value of socioeconomic status as a prognostic marker in acute myocardial infarction is controversial. The aim of this study was to evaluate the impact of educational level, as a marker of socioeconomic status, on the prognosis of long-term survival after acute myocardial infarction.
MethodsWe conducted a prospective, observational study of 5797 patients admitted to hospital with acute myocardial infarction. We studied long-term all-cause mortality (median 8.5 years) using adjusted regression models.
ResultsWe found that 73.1% of patients had primary school education (n=4240), 14.5% had secondary school education (including high school) (n=843), 7.0% was illiterate (n=407), and 5.3% had higher education (n=307). Patients with secondary school or higher education were significantly younger, more were male, and they had fewer risk factors and comorbidity. These patients arrived sooner at hospital and had less severe heart failure. During admission they received more reperfusion therapy and their crude mortality was lower. Their drug treatment in hospital and at discharge followed guideline recommendations more closely. On multivariate analysis, secondary school or higher education was an independent predictor and protective factor for long-term mortality (hazard ratio=0.85; 95% confidence interval, 0.74-0.98).
ConclusionsOur study shows an inverse and independent relationship between educational level and long-term mortality in patients with acute myocardial infarction.
Keywords
Advances in the management of coronary artery disease have led to an overall improvement in treatment and prognosis.1 However, the high cost of these measures means that their impact is observed in more developed countries, with marked differences compared with all other countries.2 Furthermore, the greatest burden of coronary artery disease and associated mortality is focused in poor countries, where lower socioeconomic classes are a majority.3 This imbalance is partly caused by a higher prevalence of vascular risk factors,4 but it may also be caused by differences in level of health care, and in particular by less diagnostic testing, fewer coronary interventions and less use of evidence-based medicine.5,6 However, the mechanisms underlying the association between lower socioeconomic status and poor prognosis have not been fully elucidated. Within the field of socioeconomic status, which is multidimensional and complex, the scientific community has placed great interest on educational level as a secondary or intermediate marker, because it is related to the socioeconomic status of parents and income, which in turn contribute to an individual's social position.7 This educational level is closely linked to occupational class and sex.7
Furthermore, coronary risk stratification has been based traditionally on scales with biological variables alone, and little attention has been paid to psychosocial factors such as educational level. These factors could be important because every aspect of a patient would be considered.8 Findings in other countries suggest that evaluating educational level could provide a relevant prognostic factor in patients with acute myocardial infarction (AMI).4,9–11 Some studies in our setting have analyzed the relationship between socioeconomic status and AMI risk,12 in-hospital treatment,13 and quality of life.14
The taxpayer-funded public health system in Spain ensures universal access, in theory at least, to medical and health services. This should provide a suitable scenario to assess the relationship between educational level and prognosis.
The objective of our study was to analyze the long-term prognostic impact of educational level in patients admitted to our heart unit after an AMI.
METHODSRecruitmentWe recruited all patients with AMI seen within 24hours of symptom onset and admitted to the coronary care unit between January 1998 and March 2008 at 2 hospitals in the Region of Murcia: Hospital Universitario Virgen de la Arrixaca (Murcia) and Hospital Universitario de Santa Lucía (Cartagena). The diagnosis of AMI was established if 2 of the following conditions were met: characteristic precordial pain lasting>30min, ST-segment elevation or depression in 2 contiguous leads, and creatine kinase MB fraction at least twice the upper reference limit. On admission, the AMI was classified as ST-segment elevation, non—ST-segment elevation, or indeterminate location with left bundle-branch block or pacemaker. Acute myocardial infarction with ST-segment elevation was established if there was presumed-new ST-segment elevation in ≥ 2 precordial leads measuring>0.2mm in V1, V2 or V3 and>0.1mm in lateral leads (aVL, I) or inferior leads (II, III and aVF). Exclusion criteria were: a) refusal to sign the consent; b)>24hours since onset; c) infarction associated with coronary revascularization; d) myocardial infarction later confirmed to have other etiology (eg, severe anemia, arrhythmias, hypoxemia), and e) patients with unstable angina. The patients were enrolled in an observational, longitudinal, prospective study. The study was approved by the ethics committees at each participating site, and patients gave their written consent to participate in the registry.
Variables. General DefinitionsWe obtained detailed demographic data for each patient by means of an interview at the time of admission. “Major or severe bleeding complications” were defined as brain and retroperitoneal hemorrhages or bleeding at any other site leading to hemodynamic compromise and/or requiring a whole blood or blood product transfusion. “Reperfusion” was defined as any combination of fibrinolysis, primary angioplasty, next-day angioplasty after successful fibrinolysis, and other nonsurgical revascularization procedures. “Heart rupture” was defined as any combination of rupture of the free wall, ventricular septum or mitral chord.
Definition of Educational Level and Occupational GroupWe used the following definitions for educational level: “illiterate” (no schooling), “primary education” (equivalent to elementary or junior school education); “secondary education” (equivalent to secondary or high school educatin), and “higher education” (university studies). We also defined the following occupational groups for this study: “unskilled” (jobs not requiring specific skills or knowledge), “housework” (domestic and family chores), “skilled” (jobs requiring specific, nonuniversity studies, including managerial positions) and “academic” (jobs filled by university graduates and postgraduates). The above educational and occupational classifications were specifically designed for this research study.
Follow-upWe followed up patients at discharge for a median 8.5 years by means of telephone contacts, follow-up at outpatient clinics, and reviews of medical records and death registries. We achieved a 98% follow-up rate.
Statistical AnalysisThe relationship between dichotomous variables was studied using contingency tables and chi-square or Fisher's exact test, as appropriate. Quantitative variables were compared using an analysis of variance or Kruskal-Wallis test, as appropriate. For the statistical analysis, we considered educational level as a dichotomous variable (secondary school and higher education vs primary school and no schooling) in view of their prognostic similarities in the survival analysis. We calculated odds ratios and their respective 95% confidence intervals. We used a Kaplan-Meier plot for the survival analysis and the Mantel-Haenszel test for the between-group comparison. A Cox regression was performed to study total cumulative mortality, and we estimated the hazard ratio and its 95% confidence interval as a measure of association. Non-Gaussian distribution variables were transformed by base-10 logs before being plotted. Model fit was adjusted by introducing variables that were considered relevant in the published literature, that were the following: age, sex, diabetes mellitus, history of previous myocardial infarction, New York Heart Association functional class ≥ 2, stroke, peripheral arterial disease, chronic kidney disease, chronic obstructive pulmonary disease, neoplasm, atrial fibrillation, heart rate and systolic blood pressure, Killip class>I on admission, reperfusion, left ventricular ejection fraction, and time to admission. We also considered body mass index and active smoking.
We checked the log-linear assumption by plotting the data. Discrimination of the final model was estimated using the C statistic and calibration was assessed with the Hosmer-Lemeshow test. We checked the proportional hazards assumption by log minus log plots. The most relevant first-order interactions were tested through hierarchical modeling.
The percentage of lost values per variable was<2% for almost all variables (99%). Statistical significance was defined as P<.05. All analyses were calculated with the statistical package SPSS version 20 (IBM, United States) and STATA 9.1 (College Station, Texas, United States).
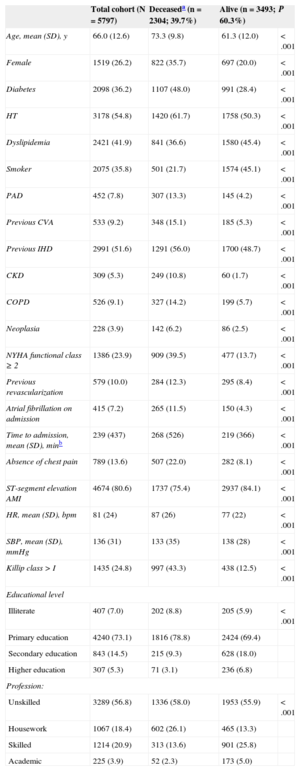
RESULTSBaseline Characteristics of the SampleTables 1 and 2 show the baseline characteristics of the patients in our study (n=5797). The mean age was 66 years (range, 18-99), and 26.2% of the patients were female. A total of 4674 (80.6%) patients had ST-segment elevation AMI. Most patients had received primary school education (n=4240; 73.1%), followed by those with secondary school education (n=843; 14.5%). Illiterate patients only accounted for 7.0% of the sample, and patients with higher education for 5.3%. With regard to occupational group, most patients had unskilled jobs (n=3289; 56.8%). Housework was also very common (n=1067; 18.4%), as were skilled jobs (n=1214; 20.9%). Academic jobs were the most uncommon (n=225; 3.9%). Most patients who were illiterate or had received primary school education held unskilled jobs or did housework (n=4245; 91.4%), while patients with secondary school or higher education mainly had skilled or academic jobs (n=1039; 90.4%).
Baseline Characteristics of the Sample
| Total cohort (N=5797) | Deceaseda (n=2304; 39.7%) | Alive (n=3493; 60.3%) | P | |
|---|---|---|---|---|
| Age, mean (SD), y | 66.0 (12.6) | 73.3 (9.8) | 61.3 (12.0) | <.001 |
| Female | 1519 (26.2) | 822 (35.7) | 697 (20.0) | <.001 |
| Diabetes | 2098 (36.2) | 1107 (48.0) | 991 (28.4) | <.001 |
| HT | 3178 (54.8) | 1420 (61.7) | 1758 (50.3) | <.001 |
| Dyslipidemia | 2421 (41.9) | 841 (36.6) | 1580 (45.4) | <.001 |
| Smoker | 2075 (35.8) | 501 (21.7) | 1574 (45.1) | <.001 |
| PAD | 452 (7.8) | 307 (13.3) | 145 (4.2) | <.001 |
| Previous CVA | 533 (9.2) | 348 (15.1) | 185 (5.3) | <.001 |
| Previous IHD | 2991 (51.6) | 1291 (56.0) | 1700 (48.7) | <.001 |
| CKD | 309 (5.3) | 249 (10.8) | 60 (1.7) | <.001 |
| COPD | 526 (9.1) | 327 (14.2) | 199 (5.7) | <.001 |
| Neoplasia | 228 (3.9) | 142 (6.2) | 86 (2.5) | <.001 |
| NYHA functional class ≥ 2 | 1386 (23.9) | 909 (39.5) | 477 (13.7) | <.001 |
| Previous revascularization | 579 (10.0) | 284 (12.3) | 295 (8.4) | <.001 |
| Atrial fibrillation on admission | 415 (7.2) | 265 (11.5) | 150 (4.3) | <.001 |
| Time to admission, mean (SD), minb | 239 (437) | 268 (526) | 219 (366) | <.001 |
| Absence of chest pain | 789 (13.6) | 507 (22.0) | 282 (8.1) | <.001 |
| ST-segment elevation AMI | 4674 (80.6) | 1737 (75.4) | 2937 (84.1) | <.001 |
| HR, mean (SD), bpm | 81 (24) | 87 (26) | 77 (22) | <.001 |
| SBP, mean (SD), mmHg | 136 (31) | 133 (35) | 138 (28) | <.001 |
| Killip class >I | 1435 (24.8) | 997 (43.3) | 438 (12.5) | <.001 |
| Educational level | ||||
| Illiterate | 407 (7.0) | 202 (8.8) | 205 (5.9) | <.001 |
| Primary education | 4240 (73.1) | 1816 (78.8) | 2424 (69.4) | |
| Secondary education | 843 (14.5) | 215 (9.3) | 628 (18.0) | |
| Higher education | 307 (5.3) | 71 (3.1) | 236 (6.8) | |
| Profession: | ||||
| Unskilled | 3289 (56.8) | 1336 (58.0) | 1953 (55.9) | <.001 |
| Housework | 1067 (18.4) | 602 (26.1) | 465 (13.3) | |
| Skilled | 1214 (20.9) | 313 (13.6) | 901 (25.8) | |
| Academic | 225 (3.9) | 52 (2.3) | 173 (5.0) | |
AMI, acute myocardial infarction; CKD, chronic kidney disease; COPD, chronic obstructive pulmonary disease; CVA, cerebrovascular accident; HR, heart rate; HT, hypertension; IHD, ischemic heart disease; NYHA, New York Heart Association; PAD, peripheral artery disease; SBP, systolic blood pressure; SD, standard deviation.
Unless otherwise indicated, data are expressed as No. (%) or mean (standard deviation).
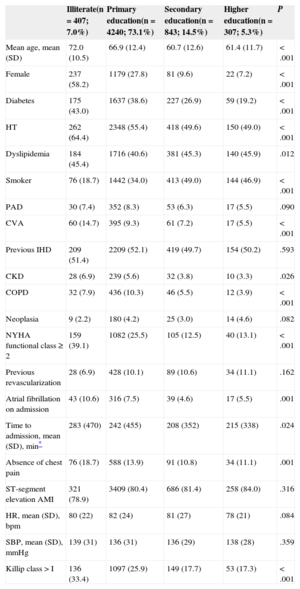
Baseline Characteristics by Educational Level
| Illiterate(n = 407; 7.0%) | Primary education(n = 4240; 73.1%) | Secondary education(n = 843; 14.5%) | Higher education(n = 307; 5.3%) | P | |
|---|---|---|---|---|---|
| Mean age, mean (SD) | 72.0 (10.5) | 66.9 (12.4) | 60.7 (12.6) | 61.4 (11.7) | <.001 |
| Female | 237 (58.2) | 1179 (27.8) | 81 (9.6) | 22 (7.2) | <.001 |
| Diabetes | 175 (43.0) | 1637 (38.6) | 227 (26.9) | 59 (19.2) | <.001 |
| HT | 262 (64.4) | 2348 (55.4) | 418 (49.6) | 150 (49.0) | <.001 |
| Dyslipidemia | 184 (45.4) | 1716 (40.6) | 381 (45.3) | 140 (45.9) | .012 |
| Smoker | 76 (18.7) | 1442 (34.0) | 413 (49.0) | 144 (46.9) | <.001 |
| PAD | 30 (7.4) | 352 (8.3) | 53 (6.3) | 17 (5.5) | .090 |
| CVA | 60 (14.7) | 395 (9.3) | 61 (7.2) | 17 (5.5) | <.001 |
| Previous IHD | 209 (51.4) | 2209 (52.1) | 419 (49.7) | 154 (50.2) | .593 |
| CKD | 28 (6.9) | 239 (5.6) | 32 (3.8) | 10 (3.3) | .026 |
| COPD | 32 (7.9) | 436 (10.3) | 46 (5.5) | 12 (3.9) | <.001 |
| Neoplasia | 9 (2.2) | 180 (4.2) | 25 (3.0) | 14 (4.6) | .082 |
| NYHA functional class ≥ 2 | 159 (39.1) | 1082 (25.5) | 105 (12.5) | 40 (13.1) | <.001 |
| Previous revascularization | 28 (6.9) | 428 (10.1) | 89 (10.6) | 34 (11.1) | .162 |
| Atrial fibrillation on admission | 43 (10.6) | 316 (7.5) | 39 (4.6) | 17 (5.5) | .001 |
| Time to admission, mean (SD), min* | 283 (470) | 242 (455) | 208 (352) | 215 (338) | .024 |
| Absence of chest pain | 76 (18.7) | 588 (13.9) | 91 (10.8) | 34 (11.1) | .001 |
| ST-segment elevation AMI | 321 (78.9) | 3409 (80.4) | 686 (81.4) | 258 (84.0) | .316 |
| HR, mean (SD), bpm | 80 (22) | 82 (24) | 81 (27) | 78 (21) | .084 |
| SBP, mean (SD), mmHg | 139 (31) | 136 (31) | 136 (29) | 138 (28) | .359 |
| Killip class>I | 136 (33.4) | 1097 (25.9) | 149 (17.7) | 53 (17.3) | <.001 |
AMI, acute myocardial infarction; CKD, chronic kidney disease; COPD, chronic obstructive pulmonary disease; CVA, cerebrovascular accident; HR, heart rate; HT, hypertension; IHD, ischemic heart disease; NYHA, New York Heart Association; PAD, peripheral artery disease; SBP, systolic blood pressure; SD, standard deviation.
Unless otherwise indicated, data are expressed as No. (%) or mean (standard deviation).
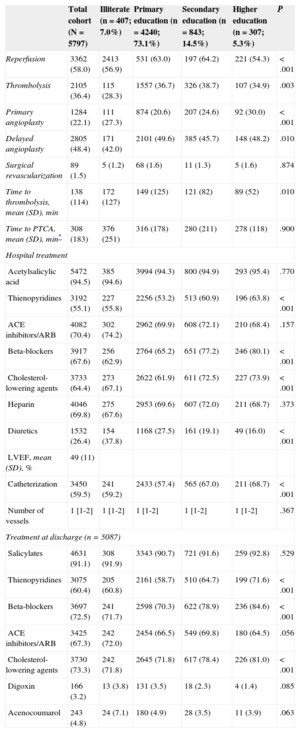
Compared with patients who were illiterate or had received primary school education, those with secondary school or higher education were significantly younger (60 vs 67 years; P<.001), more were male (91.0% vs 69.5%; P<.001); fewer had previous diabetes mellitus (24.9% vs 39.0%; P<.001), hypertension (49.4% vs 56.2%; P<.001), previous stroke (6.8% vs 9.8%; P<.002), and chronic kidney disease (3.7% vs 5.7%; P<.005); more of these patients had dyslipidemia (45.5% vs 41.0%; P<.007), were active smokers (48.4% vs 32.7%; P<.001), and had a better previous functional class (New York Heart Association functional class<1, 26.7% vs 12.6%; P<.001) (Table 2). These patients presented to hospital sooner after symptom onset (mean 210min vs 246min; P<.004). On admission, they had less heart failure (Killip class I, 73.4% vs 82.4%; P<.001), less absence of chest pain (10.9% vs 14.3%; P<.002), and they received more reperfusion therapy (63.3% vs 56.7%; P<.001). During admission, they received more treatment with thienopyridines (61.7% vs 53.4%; P<.001) and beta-blockers (78.0% vs 65.0%; P<.001), and fewer diuretics (18.3% vs 28.4%; P<.001). They also underwent more catheterization procedures (67.5% vs 57.5%; P<.001). At discharge they were prescribed more thienopyridines (66.5% vs 58.5%; P<.001), beta-blockers (80.4% vs 70.4%; P<.001), and cholesterol-lowering agents (79.1% vs 71.8%; P<.001), and they received fewer diuretics (12.1% vs 19.9%; P<.001). In-hospital treatment, reperfusion, and drug therapy at discharge are shown in Table 3 and Table 1 of the supplementary material.
Reperfusion, Treatment in Hospital and at Discharge, by Educational Level
| Total cohort (N=5797) | Illiterate (n=407; 7.0%) | Primary education (n=4240; 73.1%) | Secondary education (n=843; 14.5%) | Higher education (n=307; 5.3%) | P | |
|---|---|---|---|---|---|---|
| Reperfusion | 3362 (58.0) | 2413 (56.9) | 531 (63.0) | 197 (64.2) | 221 (54.3) | <.001 |
| Thrombolysis | 2105 (36.4) | 115 (28.3) | 1557 (36.7) | 326 (38.7) | 107 (34.9) | .003 |
| Primary angioplasty | 1284 (22.1) | 111 (27.3) | 874 (20.6) | 207 (24.6) | 92 (30.0) | <.001 |
| Delayed angioplasty | 2805 (48.4) | 171 (42.0) | 2101 (49.6) | 385 (45.7) | 148 (48.2) | .010 |
| Surgical revascularization | 89 (1.5) | 5 (1.2) | 68 (1.6) | 11 (1.3) | 5 (1.6) | .874 |
| Time to thrombolysis, mean (SD), min | 138 (114) | 172 (127) | 149 (125) | 121 (82) | 89 (52) | .010 |
| Time to PTCA, mean (SD), min* | 308 (183) | 376 (251) | 316 (178) | 280 (211) | 278 (118) | .900 |
| Hospital treatment | ||||||
| Acetylsalicylic acid | 5472 (94.5) | 385 (94.6) | 3994 (94.3) | 800 (94.9) | 293 (95.4) | .770 |
| Thienopyridines | 3192 (55.1) | 227 (55.8) | 2256 (53.2) | 513 (60.9) | 196 (63.8) | <.001 |
| ACE inhibitors/ARB | 4082 (70.4) | 302 (74.2) | 2962 (69.9) | 608 (72.1) | 210 (68.4) | .157 |
| Beta-blockers | 3917 (67.6) | 256 (62.9) | 2764 (65.2) | 651 (77.2) | 246 (80.1) | <.001 |
| Cholesterol-lowering agents | 3733 (64.4) | 273 (67.1) | 2622 (61.9) | 611 (72.5) | 227 (73.9) | <.001 |
| Heparin | 4046 (69.8) | 275 (67.6) | 2953 (69.6) | 607 (72.0) | 211 (68.7) | .373 |
| Diuretics | 1532 (26.4) | 154 (37.8) | 1168 (27.5) | 161 (19.1) | 49 (16.0) | <.001 |
| LVEF, mean (SD), % | 49 (11) | |||||
| Catheterization | 3450 (59.5) | 241 (59.2) | 2433 (57.4) | 565 (67.0) | 211 (68.7) | <.001 |
| Number of vessels | 1 [1-2] | 1 [1-2] | 1 [1-2] | 1 [1-2] | 1 [1-2] | .367 |
| Treatment at discharge (n=5087) | ||||||
| Salicylates | 4631 (91.1) | 308 (91.9) | 3343 (90.7) | 721 (91.6) | 259 (92.8) | .529 |
| Thienopyridines | 3075 (60.4) | 205 (60.8) | 2161 (58.7) | 510 (64.7) | 199 (71.6) | <.001 |
| Beta-blockers | 3697 (72.5) | 241 (71.7) | 2598 (70.3) | 622 (78.9) | 236 (84.6) | <.001 |
| ACE inhibitors/ARB | 3425 (67.3) | 242 (72.0) | 2454 (66.5) | 549 (69.8) | 180 (64.5) | .056 |
| Cholesterol-lowering agents | 3730 (73.3) | 242 (71.8) | 2645 (71.8) | 617 (78.4) | 226 (81.0) | <.001 |
| Digoxin | 166 (3.2) | 13 (3.8) | 131 (3.5) | 18 (2.3) | 4 (1.4) | .085 |
| Acenocoumarol | 243 (4.8) | 24 (7.1) | 180 (4.9) | 28 (3.5) | 11 (3.9) | .063 |
ACE, angiotensin-converting enzyme; ARB, angiotensin receptor blockers; LVEF, left ventricular ejection fraction; PTCA, percutaneous transluminal coronary angioplasty; SD, standard deviation.
Unless otherwise indicated, data are expressed as No. (%), mean (standard deviation) or median [interquartile range].
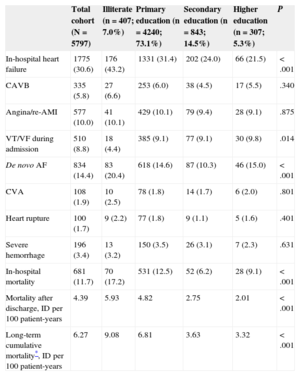
During admission, patients with a higher educational level had less heart failure (23.3% vs 32.4%; P<.001) and de novo atrial fibrillation (11.6% vs 15.1%; P=.002). The other complications evaluated showed no significant differences (Table 4). During admission, mortality declined (linear tendency P<.001) as educational level progressed from the lowest to highest level.
Complications, and In-hospital and Long-term Mortality by Educational Level
| Total cohort (N=5797) | Illiterate (n=407; 7.0%) | Primary education (n=4240; 73.1%) | Secondary education (n=843; 14.5%) | Higher education (n=307; 5.3%) | P | |
|---|---|---|---|---|---|---|
| In-hospital heart failure | 1775 (30.6) | 176 (43.2) | 1331 (31.4) | 202 (24.0) | 66 (21.5) | <.001 |
| CAVB | 335 (5.8) | 27 (6.6) | 253 (6.0) | 38 (4.5) | 17 (5.5) | .340 |
| Angina/re-AMI | 577 (10.0) | 41 (10.1) | 429 (10.1) | 79 (9.4) | 28 (9.1) | .875 |
| VT/VF during admission | 510 (8.8) | 18 (4.4) | 385 (9.1) | 77 (9.1) | 30 (9.8) | .014 |
| De novo AF | 834 (14.4) | 83 (20.4) | 618 (14.6) | 87 (10.3) | 46 (15.0) | <.001 |
| CVA | 108 (1.9) | 10 (2.5) | 78 (1.8) | 14 (1.7) | 6 (2.0) | .801 |
| Heart rupture | 100 (1.7) | 9 (2.2) | 77 (1.8) | 9 (1.1) | 5 (1.6) | .401 |
| Severe hemorrhage | 196 (3.4) | 13 (3.2) | 150 (3.5) | 26 (3.1) | 7 (2.3) | .631 |
| In-hospital mortality | 681 (11.7) | 70 (17.2) | 531 (12.5) | 52 (6.2) | 28 (9.1) | <.001 |
| Mortality after discharge, ID per 100 patient-years | 4.39 | 5.93 | 4.82 | 2.75 | 2.01 | <.001 |
| Long-term cumulative mortality*, ID per 100 patient-years | 6.27 | 9.08 | 6.81 | 3.63 | 3.32 | <.001 |
AF, atrial fibrillation; AMI, acute myocardial infarction; CAVB, complete atrioventricular block; CVA, cerebrovascular accident; ID: incidence density; VF: ventricular fibrillation; VT, ventricular tachycardia.
Unless otherwise indicated, data are expressed as No. (%).
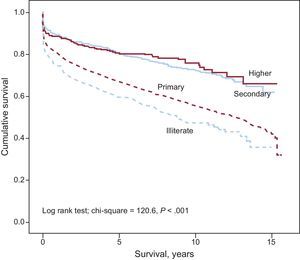
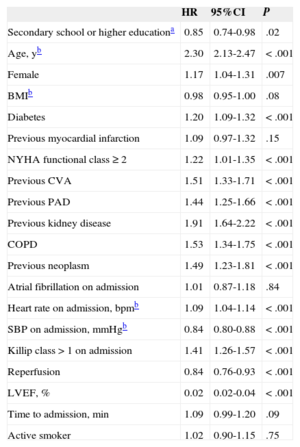
We conducted a long-term follow-up over a median 8.5 years (25th percentile-75th percentile, 6.5-11.2 years). A total of 2304 deaths were registered, representing a long-term incidence density of 6.3 deaths per 100 patient-years. Incidence density at discharge was 4.4 deaths per 100 patient-years in the total cohort. This Figure was 5.9 deaths per 100 patient-years in illiterate patients, 4.8 in those with primary school education, 2.7 in those with secondary school education, and 2.0 in patients with higher education. The Figure shows the survival curve by educational level. During follow-up, patients who died were older and had a worse clinical profile at baseline (Table 1). They also had a more critical hemodynamic profile on admission. During admission and at discharge, they received fewer drugs recommended in guidelines and had more serious complications (Tables 3 and 4). On multivariate analysis (Table 5, and Tables 2 and 3 of the supplementary material), secondary school or higher education was an independent predictor and protective factor for long-term mortality. In this model, compared with unskilled work, none of the other occupational groups (housework [hazard ratio=0.86; 95% confidence interval, 0.72-1.03], skilled work [hazard ratio=0.84; 95% confidence interval, 0.59-1.18], academic work [hazard ratio=1.09; 95% confidence interval, 0.99-1.20]) was associated with mortality during follow-up. We also checked first-order interactions for sex, AMI with and without ST-segment elevation, age dichotomized by the median and recruitment period, and found P>0.05 in all cases.
 “primary education” (equivalent to elementary or junior school education); “secondary education” (equivalent to secondary or high school education), and “higher education” (university studies).")
Kaplan-Meier survival curves for total mortality during follow-up by educational level. Educational level: “illiterate” (no schooling) “primary education” (equivalent to elementary or junior school education); “secondary education” (equivalent to secondary or high school education), and “higher education” (university studies).
Predictors of Long-term Total Mortality
| HR | 95%CI | P | |
|---|---|---|---|
| Secondary school or higher educationa | 0.85 | 0.74-0.98 | .02 |
| Age, yb | 2.30 | 2.13-2.47 | <.001 |
| Female | 1.17 | 1.04-1.31 | .007 |
| BMIb | 0.98 | 0.95-1.00 | .08 |
| Diabetes | 1.20 | 1.09-1.32 | <.001 |
| Previous myocardial infarction | 1.09 | 0.97-1.32 | .15 |
| NYHA functional class ≥ 2 | 1.22 | 1.01-1.35 | <.001 |
| Previous CVA | 1.51 | 1.33-1.71 | <.001 |
| Previous PAD | 1.44 | 1.25-1.66 | <.001 |
| Previous kidney disease | 1.91 | 1.64-2.22 | <.001 |
| COPD | 1.53 | 1.34-1.75 | <.001 |
| Previous neoplasm | 1.49 | 1.23-1.81 | <.001 |
| Atrial fibrillation on admission | 1.01 | 0.87-1.18 | .84 |
| Heart rate on admission, bpmb | 1.09 | 1.04-1.14 | <.001 |
| SBP on admission, mmHgb | 0.84 | 0.80-0.88 | <.001 |
| Killip class>1 on admission | 1.41 | 1.26-1.57 | <.001 |
| Reperfusion | 0.84 | 0.76-0.93 | <.001 |
| LVEF, % | 0.02 | 0.02-0.04 | <.001 |
| Time to admission, min | 1.09 | 0.99-1.20 | .09 |
| Active smoker | 1.02 | 0.90-1.15 | .75 |
95%CI, 95% confidence interval; BMI, body mass index; COPD, chronic obstructive pulmonary disease; CVA, cerebrovascular accident; HR, hazard ratio; LVEF, left ventricular ejection fraction; NYHA, New York Heart Association; PAD, peripheral artery disease; SBP, systolic blood pressure.
Median follow-up was 8.5 years (interquartile range: 6.5-11.2).
The proportional hazards assumption was checked for the educational level variables.
Left ventricular ejection fraction and time to admission were transformed by base-10 logs before plotting.
Our study shows that a higher education level, as a marker of higher socioeconomic status, is associated with a more favorable prognosis for long-term mortality after AMI. This protective impact on mortality is observed even in the first few years after discharge.
Previous studies have shown that patients with a lower educational level generally have a higher-risk clinical profile,4,12,15 mainly because of the presence of more risk factors and comorbidity, leading to a worse outcome. We found that educational level was still an independent predictor of mortality, even after careful adjustment for the characteristics that carried a high risk as independent variables. In addition, our findings show that the magnitude and direction of this association did not vary by sex or type of infarction. The reason why a higher educational level afforded protection is open to speculation. Also, we cannot rule out an association with 1 or more variables that are independently associated with a better prognosis, although this is unlikely. Beyond our findings that patients with a higher educational level were younger, had fewer risk factors and comorbidity, and received more intense drug therapies and more reperfusion procedures, other authors have already observed that these patients are more likely to quit smoking after admission,16 live in less social isolation, and suffer less life stress.17 One small study also reported that these patients had a lower reinfarction rate and found it easier to return to work.18 Other potentially influential factors are a higher salary, a greater likelihood of having health insurance, better access to health care, greater adherence to strategies of secondary prevention, including greater compliance with recommended healthy-heart lifestyle changes.4 However, these factors, and income-related factors in particular, which are closely linked to occupational level, may be less relevant in countries such as Spain, which have a universal public health system. For this reason, we considered educational level rather than occupational level as the main marker of socioeconomic status and for potential impact on mortality.
Health literacy has also been analyzed as a potential marker, particularly by authors conducting studies in English-speaking countries. Health literacy refers to a person's ability to process and understand the health information needed to make appropriate health decisions. Persons with a lower educational level might be affected by a lower health literacy level.19
Our study coincides with a recent study by Mehta et al,4 which evaluated more than 11 300 patients enrolled in the GUSTO-III (Global Use of Strategies to Open Occluded Coronary Arteries) trial. The authors confirmed that the number of years of education was an independent predictor of mortality in patients with ST-segment elevation AMI treated with fibrinolysis. The study recruited widely geographically-distributed patients (from the United States, Canada, Australia and Europe) and consistently found a favorable impact on mortality in patients with a higher level of education. Our study complements and furthers these findings, because it confirms an association between educational level and mortality after AMI, based on patients enrolled in an observational registry, implying a lower selection bias. In addition, we found that this association also applied to patients with non—ST-segment elevation myocardial infarction.
Another study, based on a Danish registry,9 enrolled patients who were more similar to ours. The authors found that educational level and income were both independently associated with mortality after AMI. The main limitation of this large study with more than 37 500 patients was a lack of clinically relevant data, such as vascular risk factors, comorbidity, hemodynamic variables, and heart failure on admission, whereas our study performed a multivariate analysis covering the main clinical determinants of mortality after AMI.
Our findings shed light on the difficult task of predicting the prognosis of patients with AMI.20,21 Our study coincides with some studies that have reported that the prognostic impact of socioeconomic status on a patient's clinical outcome is not fully explained by the differences in the baseline characteristics of these patients,4,22–24 but our study disagrees with others.25,26 The last 2 cited studies, unlike ours, used data from administrative records designed for other purposes and provided less clinical information.
In Spain, Machón et al27 found that socioeconomic differences could have a prognostic impact in patients after AMI, particularly in men. However, our study showed that educational level was a protective factor for men and women alike.
Strengths and LimitationsOur study has some limitations, such as unmeasured confounders inherent in all observational studies (eg, medical or invasive treatment after discharge), and lack of data on the number of years of education and specific causes of death. Furthermore, this study focused on educational level as the only measure of socioeconomic status, and so we were unable to explore other facets or dimensions of this complex concept. In addition, we did not consider other potential social determinants of health, such as physical and social setting. The strengths of our study are its prospective design, the relatively large sample size and number of events, as well as the meticulous multivariate adjustment.
CONCLUSIONSOur study shows an inverse and independent relationship between educational level and long-term mortality in patients after AMI. Therefore, secondary prevention strategies should be strengthened in patients with a low educational level, and these patients should be monitored more closely.28
CONFLICTS OF INTERESTNone declared.