In patients with heart failure and type 2 diabetes, low glycosylated hemoglobin has been related with higher risk of mortality but information regarding morbidity is scarce. We sought to evaluate the association between glycosylated hemoglobin and 30-day readmission in patients with type 2 diabetes and acute heart failure.
MethodsGlycosylated hemoglobin was measured before discharge in 835 consecutive patients with acute heart failure and type 2 diabetes. Cox regression analysis adapted for competing events was used.
ResultsMean (standard deviation) age was 72.9 (9.6) years and median glycosylated hemoglobin was 7.2% (6.5%-8.0%). Patients treated with insulin or insulin/sulfonylurea/meglitinides were 41.1% and 63.2% of the cohort, respectively. At 30 days post-discharge, 109 (13.1%) patients were readmitted. A multivariate analysis revealed that the effect of glycosylated hemoglobin on the risk of 30-day readmission was differentially affected by the type of treatment (P for interaction<.01). Glycosylated hemoglobin (per 1% decrease) was inversely associated with higher risk in those receiving insulin (hazard ratio = 1.45; 95% confidence interval, 1.13-1.86; P=.003) or insulin/sulfonylurea/meglitinides (hazard ratio = 1.44; 95% confidence interval, 1.16-1.80; P=.001). Conversely, glycosylated hemoglobin (per 1% increase) had no effect in non-insulin dependent diabetes (hazard ratio = 1.01; 95% confidence interval, 0.87-1.17; P=.897) or even a positive effect in patients not receiving insulin/sulfonylurea/meglitinides (hazard ratio = 1.12; 95% confidence interval, 1.03-1.22; P=.011).
ConclusionsIn acute heart failure, glycosylated hemoglobin showed to be inversely associated to higher risk of 30-day readmission in insulin-dependent or those treated with insulin/sulfonylurea/meglitinides. A marginal effect was found in the rest. Whether this association reflects a treatment-related effect or a surrogate of more advanced disease should be clarified in further studies.
Keywords
Risk of early readmission in patients recently discharged for acute heart failure (AHF) remains prohibitively high.1,2 Readmissions are usually associated to increased mortality and constitute an excessive health-care burden.1 Contemporary heart failure (HF) programs and institutional initiatives set reduction in the rate of early readmissions as a main target.3–5 Unfortunately, there are no well-established risk factors to identify patients at higher/maximum risk.6 Diabetes mellitus is a common comorbidity in HF and its optimal management remains unclear. Recent studies and current guidelines have stressed the potential deleterious effects of intensive glucose-lowering strategies and subsequent higher risk of hypoglycemic events in certain subgroups, such as those with advanced cardiovascular (CV) diseases.7–10 In accordance with these statements, some epidemiological and observational studies have shown a U-shape pattern or inverse relationship between glycosylated hemoglobin (HbA1c) and mortality in patients with HF and diabetes mellitus.11–13 Nevertheless, no data are available regarding the effect of HbA1c on the risk of readmission, especially after an episode of decompensation and according to the type of antidiabetic treatment.
Hypoglycemia occurs mainly through activation of the sympathoadrenal system, but also by promoting endothelial dysfunction and inflammation. Among the effects are increased systolic blood pressure, heart rate, risk of arrhythmias, myocardial ischemia, and fluid accumulation/redistribution, conditions that are well known as precipitating factors for HF decompensation.8,14,15 Along this line, we postulate that lower HbA1c values in type 2 diabetes mellitus (DM2) patients with a recent hospitalization for AHF, especially those treated with antidiabetic drugs that increase the risk of hypoglycemia, could possibly identify those at higher risk of early readmission.
The aim of this study was to evaluate the association of HbA1c, measured during an index admission for AHF, and the risk of 30-day unplanned readmission, and determine whether the type of antidiabetic treatment differentially modifies this association.
METHODSStudy SampleWe included 2079 consecutive patients admitted to the cardiology department of a tertiary center (Hospital Clínico Universitario de Valencia, Spain) from January 1, 2006, to December 31, 2013 with a principal diagnosis of AHF. This was defined as rapid onset of symptoms and signs of abnormal cardiac function together with objective evidence of structural or functional abnormality of the heart at rest (cardiomegaly, third heart sound, cardiac murmur, abnormal echocardiogram, or increased natriuretic peptides).16–18 In all patients, intravenous treatment with furosemide was prescribed, at least during the first 48h of admission. By design, patients without prior diagnostic of DM2 at the index hospitalization (n=1173) were excluded. Additionally, hospital deaths (n=34) and patients with final diagnosis of acute coronary syndrome (n=20) and pneumonia (n=16) were also excluded from this analysis. The final sample included 835 individuals (Figure of the supplementary material).
Before discharge, information related to demography, medical history, vital parameters, 12-lead electrocardiogram, standard laboratory, echocardiographic parameters, and pharmacologic therapies were routinely recorded using pre-established registry questionnaires. Standard laboratory tests were obtained before discharge (median of 4 days [interquartile range, 3-6 days]). Treatment with angiotensin-converting enzyme inhibitors, angiotensin receptor blockers, beta-blockers, aldosterone antagonists, anticoagulants, diuretics, and other therapeutic strategies were individualized following established guidelines in effect at the time the patient was recruited in the registry.16–18
Diabetes Treatment and Glycosylated Hemoglobin MeasurementAntidiabetic treatment (insulin, sulfonylureas, meglitinides, metformin, thiazolidinedione, inhibitors of dipeptidyl peptidase 4 and alpha glucosidase inhibitors) was recorded at discharge. Blood HbA1c along with standard laboratory tests were measured during hospitalization (median of 4 days [interquartile range, 3-6 days] after admission). For analysis purposes, patients were categorized in 2 groups, according to the hazard of hypoglycemic events: a) high risk of hypoglycemic events (insulin/sulfonylurea/meglitinides [Ins/SU/MG], and b) low risk of hypoglycemic events (dipeptidyl peptidase 4 and alpha glucosidase inhibitors).
OutcomesThe primary endpoint was 30-day all-cause unplanned readmission after discharge. Secondary endpoints were 30-day CV cause and AHF readmission. Readmission definition included unplanned in-hospital stay longer than 24h and was classified as CV and non-CV causes (including AHF hospitalizations). These endpoints were ascertained by a physician blinded to the exposures (HbA1c values and antidiabetic treatment) through a review of hospital records. This study conforms to the principles outlined in the Declaration of Helsinki and was approved by an institutional review committee. All patients gave informed consent.
Statistical AnalysisContinuous variables were expressed as mean (1 standard deviation) or median [interquartile range] when appropriate. Discrete variables were summarized as percentages. Baseline characteristics were compared among the quartiles (Q1, Q2, Q3, and Q4) of HbA1c. An adapted version of Cox regression that takes into account the effect of all-cause mortality and other causes of readmission as competing events (method of Fine and Gray) was used to examine the independent association between HbA1c and 30-day unplanned all-cause, CV, and AHF readmissions.19 For any regression model, all covariates shown in Table 1 were evaluated for prognostic purposes. Reduced and parsimonious models were derived by using backward stepwise selection with a p-value of 0.157 (AIC criterion) for variable inclusion. During this selection process, the linearity assumption for all continuous variables was simultaneously tested and the variable transformed, if appropriate, with fractional polynomials.20 Covariates included in the final multivariate model for 30-day all-cause readmission were age, prior admission for AHF, Charlson comorbidity index, the interaction between atrial fibrillation and heart rate, the interaction between left ventricular ejection fraction ≤ 35% and systolic blood pressure, plasma antigen carbohydrate 125, urea, and the dose of furosemide equivalent prescribed at discharge. Covariates included in the final multivariate model for 30-day CV readmission were prior admission for AHF, etiology, Charlson comorbidity index, the interaction between atrial fibrillation and heart rate, the interaction between left ventricular ejection fraction ≤ 35% and systolic blood pressure, high sensitivity troponin, and furosemide dose at discharge. Covariates included in the final multivariate model for AHF readmission were prior admission for AHF, Charlson comorbidity index, the interaction between atrial fibrillation and heart rate, the interaction between left ventricular ejection fraction ≤ 35% and systolic blood pressure, antigen carbohydrate 125, and urea. Proportionality assumption for the hazard function over time was tested by means of the Schoenfeld residuals. Discriminative ability of the multivariate models was evaluated with Harrell's C-statistics.
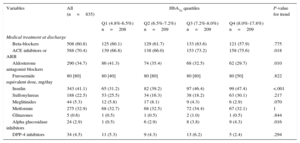
Baseline Characteristics According to Glycosylated Hemoglobin Levels
| Variables | All (n=835) | HbA1c quartiles | P-value for trend | |||
|---|---|---|---|---|---|---|
| Q1 (4.8%-6.5%) (n=208) | Q2 (6.5%-7.2%) (n=209) | Q3 (7.2%-8.0%) n=209 | Q4 (8.0%-17.8%) n=209 | |||
| Demographic and medical history | ||||||
| Age, mean (SD), years | 72.8 (9.50) | 73.5 (9.50) | 73.7 (8.52) | 73.2 (9.20) | 70.9 (10.60) | .012 |
| Male | 424 (50.8) | 108 (51.9) | 109 (52.1) | 113 (54.1) | 94 (45.0) | .221 |
| First admission for AHF | 397 (47.6) | 91 (43.7) | 113 (54.1) | 99 (47.4) | 94 (45.2) | .877 |
| LOS, days | 8 (6) | 8 (7) | 8 (6) | 8 (6) | 8 (6) | .950 |
| Hypertension | 713 (85.4) | 182 (87.5) | 182 (87.1) | 182 (87.1) | 167 (79.9) | .037 |
| Dyslipidemia | 493 (59.0) | 133 (63.9) | 132 (63.2) | 114 (54.5) | 114 (54.5) | .016 |
| Current smoker | 85 (10.2) | 15 (7.2) | 16 (7.7) | 16 (7.7) | 38 (18.3) | <.001 |
| Previous smoker | 203 (24.3) | 61 (29.3) | 52 (24.9) | 59 (28.2) | 31 (14.9) | .003 |
| Ischemic heart disease | 393 (47.1) | 95 (45.7) | 106 (50.7) | 101 (48.3) | 91 (43.5) | .568 |
| Valvular heart disease | 180 (21.6) | 51 (24.5) | 56 (26.9) | 36 (17.2) | 37 (17.7) | .018 |
| Charlson index | 2 [3] | 3 [3] | 2 [3] | 2 [2] | 2 [2] | <.001 |
| COPD | 179 (21.4) | 51 (24.5) | 41 (19.6) | 41 (19.6) | 46 (22.0) | .555 |
| PAD | 115 (13.8) | 27 (13.0) | 35 (16.7) | 30 (14.3) | 23 (11.0) | .434 |
| Stroke | 90 (10.8) | 17 (8.2) | 26 (12.4) | 28 (13.4) | 19 (9.1) | .702 |
| Prior known renal failure | 181 (21.7) | 59 (28.4) | 54 (25.8) | 38 (18.2) | 30 (14.3) | <.001 |
| Radiological pleural effusion | 399 (47.8) | 109 (52.4) | 101 (48.3) | 94 (45.0) | 95 (45.4) | .104 |
| Peripheral edema | 533 (63.8) | 131 (63.0) | 141 (67.5) | 130 (62.2) | 131 (62.7) | .639 |
| Vital signs | ||||||
| Heart rate, mean (SD), bpm | 97 (27) | 93 (26) | 95 (26) | 99 (26) | 102 (28) | <.001 |
| SBP, mean (SD), mmHg | 150 (35) | 146 (34) | 147 (32) | 153 (35) | 156 (39) | .001 |
| DBP, mean (SD), mmHg | 81 (19) | 79 (19) | 78 (18) | 82 (18) | 85 (22) | <.001 |
| Electrocardiogram | ||||||
| Atrial fibrillation | 298 (35.7) | 72 (34.6) | 82 (39.2) | 69 (33.0) | 75 (35.9) | .870 |
| QRS > 120 ms | 258 (30.9) | 68 (32.7) | 66 (31.6) | 71 (34.0) | 53 (25.4) | .170 |
| Laboratory | ||||||
| Hemoglobin, mean (SD), g/dL | 12.2 (2.0) | 11.7 (1.9) | 12.0 (1.9) | 12.5 (1.9) | 12.6 (2.0) | <.001 |
| Leukocyte count, mean (SD), 103 cells/mL | 10 389 (4203) | 9759 (4025) | 9721 (3495) | 11 005 (3929) | 11 070 (5035) | <.001 |
| Fasting glucose, mean (SD), mg/dL | 147 (64) | 122 (39) | 135 (36) | 152 (49) | 180 (96) | <.001 |
| HbA1c, mean (SD), % | 7.4 (1.4) | 6.0 (0.4) | 6.9 (0.2) | 7.5 (0.2) | 9.3 (1.5) | <.001 |
| Sodium, mean (SD), mEq/L | 138 (4) | 139 (4) | 139 (4) | 138 (4) | 138 (5) | <.001 |
| NT-proBNP, pg/mL | 3237 [4142] | 3647 [4766] | 3606 [5615] | 3109 [3281] | 2300 [3526] | <.001 |
| CA125, U/mL | 58.0 [100.8] | 49.6 [77.6] | 65.0 [98.0] | 56.9 [105.2] | 66.5 [119.0] | .391 |
| Total cholesterol, mean (SD), mg/dL | 163 (46) | 159 (44) | 156 (43) | 164 (48) | 173 (46) | <.001 |
| Creatinine, mean (SD), mg/dL | 1.33 (0.68) | 1.39 (0.79) | 1.44 (0.75) | 1.32 (0.62) | 1.19 (0.51) | .014 |
| Urea, mean (SD), mg/dL | 70.5 (32.6) | 71.1 (32.9) | 74.8 (37.3) | 71.2 (31.9) | 64.9 (27.0) | .062 |
| eGFR, mean (SD), mL/min/1.73 m2 | 58.9 (23.9) | 58.8 (25.3) | 55.1 (23.7) | 59.0 (22.9) | 62.6 (23.0) | .038 |
| Echocardiography | ||||||
| LVEF, mean (SD), % | 49.7 (15.3) | 50.2 (16.0) | 50.0 (15.2) | 48.8 (14.9) | 50.1 (15.0) | .679 |
| LVDD, mean (SD), mm | 55 (9) | 56 (10) | 55 (9) | 55 (10) | 55 (9) | .669 |
| LAD, mean (SD), mm | 43 (7) | 44 (8) | 43 (7) | 42 (6) | 42 (7) | .001 |
AHF, acute heart failure; bpm, beats per minute; CA125, antigen carbohydrate 125; COPD, chronic pulmonary obstructive disease; DBP, diastolic blood pressure; eGFR, estimated glomerular filtration rate; HbA1c, glycosylated hemoglobin; LAD, left atrial diameter; LOS, length of stay; LVEF, left ventricular ejection fraction; LVDD, left ventricular diastolic diameter; NT-proBNP, N-terminal pro-brain natriuretic peptide; PAD, peripheral artery disease; SBP, systolic blood pressure; SD, standard deviation.
Unless otherwise indicated, data are expressed as No. (%), mean (standard deviation) or median [interquartile range].
A 2-sided P-value of<.05 was considered statistically significant for all analyses. All survival analyses were performed using STATA 13.1 (StataCorp. 2013. Stata Statistical Software: Release 13.1. College Station, Texas: StataCorp LP).
RESULTSMean age was 72.9 (9.6) years, 49.2% were females, 48.7% showed left ventricular ejection fraction<50%, and the median HbA1c value was 7.2% (6.5%-8.0%). The antidiabetic treatment was insulin (41.1%), metformin (32.9%), sulfonylureas (22.5%), meglitinides (5.3%), inhibitors of dipeptidyl peptidase 4 (4.5%), alpha glucosidase inhibitors (2.9%), and thiazolidinediones (0.5%). Patients treated with at least one hypoglycemic agent (Ins/SU/MG) accounted for 63.2% of the sample.
Baseline Characteristics Across Glycosylated HemoglobinOverall, lower HbA1c values were associated with a worse baseline risk profile. A monotonic increase in age, N-terminal pro-brain natriuretic peptide, serum creatinine, left atrial diameter, and Charlson comorbidity index was observed when moving from HbA1c-Q4 to HbA1c-Q1 (Table 1); the same was true for the prevalence of hypertension, dyslipidemia, previous smoker, significant valvular disease, and prior known renal failure. Likewise, lower values of systolic/diastolic blood pressure, hemoglobin, total cholesterol, leukocyte count, and glomerular filtration rate predominated at the lower quartiles (Table 1). In regard to medications, those patients belonging to the lower quartiles of HbA1c had higher prevalence in the prescription of aldosterone receptor blockers and lower for insulin, alpha glucosidase inhibitors, and angiotensin-converting enzyme inhibitors/angiotensin receptor blockers. No significant differences were found for variables including other HF-drugs and other oral antidiabetic agents when tested across quartiles of HbA1c (Table 2).
Pharmacological Treatment According to Glycosylated Hemoglobin Levels
| Variables | All (n=835) | HbA1c quartiles | P-value for trend | |||
|---|---|---|---|---|---|---|
| Q1 (4.8%-6.5%) n=208 | Q2 (6.5%-7.2%) n=209 | Q3 (7.2%-8.0%) n=209 | Q4 (8.0%-17.8%) n=209 | |||
| Medical treatment at discharge | ||||||
| Beta-blockers | 508 (60.8) | 125 (60.1) | 129 (61.7) | 133 (63.6) | 121 (57.9) | .775 |
| ACE inhibitors or ARB | 588 (70.4) | 139 (66.8) | 138 (66.0) | 153 (73.2) | 158 (75.6) | .018 |
| Aldosterone antagonist blockers | 290 (34.7) | 86 (41.3) | 74 (35.4) | 68 (32.5) | 62 (29.7) | .010 |
| Furosemide equivalent dose, mg/day | 80 [80] | 80 [40] | 80 [80] | 80 [80] | 80 [50] | .822 |
| Insulin | 343 (41.1) | 65 (31.2) | 82 (39.2) | 97 (46.4) | 99 (47.4) | <.001 |
| Sulfonylureas | 188 (22.5) | 53 (25.5) | 34 (16.3) | 38 (18.2) | 63 (30.1) | .217 |
| Meglitinides | 44 (5.3) | 12 (5.8) | 17 (8.1) | 9 (4.3) | 6 (2.9) | .070 |
| Metformin | 275 (32.9) | 68 (32.7) | 68 (32.5) | 72 (34.4) | 67 (32.1) | 1 |
| Glitazones | 5 (0.6) | 1 (0.5) | 1 (0.5) | 2 (1.0) | 1 (0.5) | .844 |
| Alpha glucosidase inhibitors | 24 (2.9) | 1 (0.5) | 6 (2.9) | 8 (3.8) | 9 (4.3) | .016 |
| DPP-4 inhibitors | 34 (4.5) | 11 (5.3) | 9 (4.3) | 13 (6.2) | 5 (2.4) | .294 |
ACE, angiotensin-converting enzyme; ARB, angiotensin receptor blockers; DPP-4, dipeptidyl peptidase 4; HbA1c, glycosylated hemoglobin.
Unless otherwise indicated, data are expressed No. (%) or median [interquartile range].
Patients treated with insulin or Ins/SU/MG exhibited worse baseline risk profile. Briefly, these patients exhibited greater comorbidity (peripheral artery disease, renal failure and prior admission for AHF). Likewise, these patients showed higher prevalence of ischemic heart disease, lower mean hemoglobin, and higher glycemic profile. No significant differences were observed between HF-treatment groups (Tables 1 and 2 of the supplementary material).
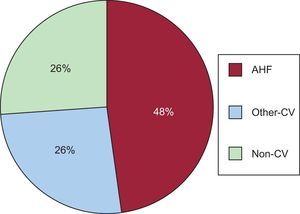
Glycosylated Hemoglobin Antidiabetic Agents and Risk of 30-day ReadmissionAt 30 days after discharge, 17 (2.0%) patients had died (3 of them without readmission) and 109 (13.1%) were readmitted, mostly for CV causes ([n=80 [73.4%]). Among CV causes, AHF was the most frequent diagnosis (n = 52 [65% CV]) Figure 1 summarizes the most common causes of readmission.

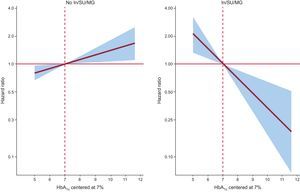
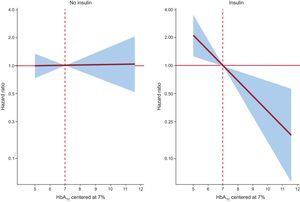
In the whole sample, 30-day readmission rates differed across HbA1c-Q. There was a monotonic increase of rate of readmission from Q4 to Q1 (10.5%, 11.0%, 12.0% and 18.8%, respectively; P for trend=.016). Further analysis revealed a divergent association between HbA1c quartiles and rates of 30-day readmission according to the type of antidiabetic therapy. Thus, in patients receiving Ins/SU/MG, an inverse relationship was found between HbA1c quartiles and 30-day rates of readmission (26.5%, 15.3%, 10.5%, and 7.2%, for Q1, Q2, Q3 and Q4, respectively; P for trend<.001). This inverse relationship was found for both insulin-DM2 (26.2%, 14.6%, 12.4% and 7.1%, for Q1, Q2, Q3 and Q4, respectively; P for trend<.001) and sulfonylureas treatment (30.2%, 17.7%, 10.5%, and 9.5%, respectively; P for trend<.001), analyzed as single agents. Conversely, in those not treated with Ins/SU/MG, a borderline significant increase in readmission rate was found from lower to upper quartiles (8.8%, 7.1%, 12.0% and 19.6% for Q1, Q2, Q3 and Q4, respectively; P for trend=.087). No differences, however, were found for HbA1c quartiles (15.4%, 10.2%, 9.8% and 13.6%, respectively; P for trend=.443) in those patients not receiving insulin.
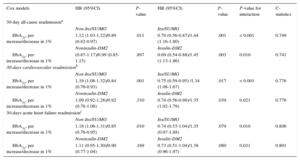
In a multivariate setting, after adjusting for risk factors and accounting for the effect of 30-day mortality as a competing event, this differential prognostic effect persisted (P-value for interactions<.05). Glycosylated hemoglobin value was inverse and linearly associated to higher risk of readmission in patients treated with insulin (hazard: ratio = 1.45; 95% confidence interval, 1.13-1.86; p=.003, per 1% decrease) or Ins/SU/MG (hazard ratio = 1.44; 95% confidence interval, 1.16-1.80; P=.001, per 1% decrease) (Figures 2 and 3). For instance, insulin-treated patients and those receiving Ins/SU/MG, HbA1c-Q1 (≤ 6.5%) exhibited a 3.5 and 3.4-fold adjusted increase risk vs HbA1c-Q2-Q4 (P=.010 and P=.001, respectively). Likewise, and using a reference HbA1c threshold of 7%, those Ins/SU/MG and DM2 patients with values of HbA1c between 6.9% and 5.0% exhibited an increased risk ranging from 4% to 210% (Figures 2 and 3).


In contrast, HbA1c value was not related with the outcome in patients not receiving insulin treatment (hazard ratio = 1.01; 95% confidence interval, 0.87-1.17; P=.897, per 1% increase) and was positively associated with an increased risk in patients not treated with Ins/SU/MG (hazard ratio = 1.12; 95 confidence interval, 1.03-1.22; P=.011, per 1% increase) (Figures 2 and 3). A similar differential prognostic effect was observed for CV-readmission or AHF-readmission when evaluated as endpoints (Table 3).
Glycosylated Hemoglobin Hazard Ratios for 30-day All-cause, Cardiovascular and Acute Heart Failure Readmission
| Cox models | HR (95%CI) | P-value | HR (95%CI) | P-value | P-value for interaction | C-statistics |
|---|---|---|---|---|---|---|
| 30-day all-cause readmissiona | ||||||
| Non-Ins/SU/MG | Ins/SU/MG | |||||
| HbA1c, per increase/decrease in 1% | 1.12 (1.03-1.22)/0.89 (0.82-0.97) | .011 | 0.70 (0.56-0.87)/1.44 (1.16-1.80) | .001 | < 0.001 | 0.749 |
| Noninsulin-DM2 | Insulin-DM2 | |||||
| HbA1c, per increase/decrease in 1% | (0.87-1.17)/0.99 (0.85-1.15) | .897 | 0.69 (0.54-0.88)/1.45 (1.13-1.86) | .003 | 0.010 | 0.741 |
| 30-days cardiovascular readmissionb | ||||||
| Non-Ins/SU/MG | Ins/SU/MG | |||||
| HbA1c, per increase/decrease in 1% | 1.19 (1.08-1.32)/0.84 (0.76-0.93) | .001 | 0.75 (0.59-0.95) /1.34 (1.08-1.67) | .017 | < 0.001 | 0.776 |
| Noninsulin-DM2 | Insulin-DM2 | |||||
| HbA1c, per increase/decrease in 1% | 1.09 (0.92-1.28)/0.92 (0.78-1.08) | .310 | 0.74 (0.56-0.98)/1.35 (1.02-1.79) | .039 | 0.021 | 0.776 |
| 30-days acute heart failure readmissionc | ||||||
| Non-Ins/SU/MG | Ins/SU/MG | |||||
| HbA1c, per increase/decrease in 1% | 1.18 (1.06-1.31)/0.85 (0.76-0.95) | .010 | 0.74 (0.53-1.04)/1.35 (0.97-1.88) | .079 | 0.010 | 0.806 |
| Noninsulin-DM2 | Insulin-DM2 | |||||
| HbA1c, per increase/decrease in 1% | 1.11 (0.95-1.30)/0.90 (0.77-1.04) | .169 | 0.73 (0.51-1.04)/1.38 (0.96-1.97) | .080 | 0.031 | 0.801 |
95%CI, 95% confidence interval; DM2, type 2 diabetes mellitus; HbA1c, glycosylated hemoglobin; HR, hazard ratio; Ins/SU/MG, insulin/sulfonylurea/meglitinides (drugs that increased hypoglycemia risk).
Competing risk model adjusted by 30-day all-cause mortality and the following covariates: age, prior admission for acute heart failure, Charlson comorbidity index (interaction between atrial fibrillation and heart rate; interaction between left ventricular ejection fraction ≤ 35% and systolic blood pressure), plasma antigen carbohydrate 125, urea, and furosemide equivalent dose at discharge.
Competing risk model adjusted by 30-day all-cause mortality, noncardiovascular readmission, and the following covariates: prior admission for acute heart failure, etiology, Charlson comorbidity index, interaction (atrial fibrillation*heart rate), interaction (left ventricular ejection fraction ≤ 35% * systolic blood pressure), high sensitivity troponin, and furosemide dose at discharge.
Competing risk model adjusted by 30-day all-cause mortality, nonacute heart failure readmission and the following covariates: prior admission for acute heart failure, Charlson comorbidity index (interaction between atrial fibrillation and heart rate; interaction between left ventricular ejection fraction ≤ 35% and systolic blood pressure), plasma antigen carbohydrate 125, and urea.
Early rehospitalization rates after an admission for HF decompensation remain unacceptably high, and represent a substantial problem to both patients and the healthcare system.1,2 Recent institutional initiatives recognize the need to decrease 30-day readmission as a health care priority.3–5 Unfortunately, accurate readmission risk stratification remains an unmet challenge6 and several interventions during the past decade did not decrease the rates of HF-related hospitalizations.21
In the present study, we found that HbA1c value predicted 30-day unplanned rehospitalization in DM2 patients recently admitted for AHF. However, this effect was not uniform among the population as a whole. In fact, the predictive ability of HbA1c varied according to the treatment received for glycemic control in T2DM. Interestingly, low values of HbA1c strongly predicted higher risk of readmission in patients treated with insulin, sulfonylureas, or meglitinides, with a slight protector effect in the rest of patients. To the best of our knowledge, these results are novel in suggesting a treatment-related hypoglycemia as a main factor explaining the inverse relationship between HbA1c and early readmission in DM2 patients or in those receiving Ins/SU/MG. In the subgroup of patients not receiving Ins/SU/MG, the slight excess of risk attributable to higher HbA1c might be due to a higher risk of metabolic-related complications but also to a better baseline risk profile. Importantly, if reproduced in further studies, these results may have potential clinical implications, such as the following: a) need to monitor glycemic control during an episode of HF decompensation for short-term risk stratification, and b) avoidance of intensive glycemic control strategies (stringent glycemic targets) following an episode of AHF.
Glycemic control in diabetes mellitus with heart failureCurrent guidelines for the treatment of hyperglycemia in patients with DM2 highlight the importance of individualization of therapy based on patient needs, comorbid conditions, and potential adverse effects of hyperglycemic treatments.10 Intensive glycemic control, obtaining low HbA1c values prone to higher risk of hypoglycemic events, has been related to higher morbidity and mortality, especially in certain subgroups of comorbid and frail diabetics.10 In this regard, recent observational studies done in patients with diabetes and established HF have revealed a paradoxical effect between glycemic control and adverse outcomes. Most of these studies have found either a U-shaped pattern or an inverse relationship between HbA1c value and mortality.11–13 For instance, in a study of 5815 ambulatory HF diabetic patients, individuals with modest glycemic control (HbA1c > 7.1%–7.8%) had lower mortality compared with HbA1c levels that were either higher or lower.11 An inverse association between HbA1c values and adverse outcomes also has been documented in smaller cohorts of patients with diabetes and advanced systolic HF.12,13 In the setting of interventional studies, the evidence about this dual-effect of HbA1c in HF is even scarcer. Recent randomized clinical trials of patients with established DM2 and either CV disease or high risk for CV disease have failed to demonstrate significant reduction in major CV outcomes with more intensive glycemic control (HbA1c<6.0%-6.5%), despite significant improvements of glycemic control.7–10 In these trials, HF patients have been excluded or underrepresented. Only in a subgroup analysis of the ACCORD trial, a 5% (n=494) of individuals enrolled had a previous diagnosis of HF.9,22 In this HF subgroup, a significant (25%) increase in mortality risk was reported in those patients randomized to intensive glycemic control strategy.22 Unfortunately, to date no controlled trials addressing the optimal treatment and glycemic targets, specifically in HF patients with diabetes, have been performed.
Hypoglycemia and Adverse EventsThere is evidence endorsing a theory that hypoglycemia, mainly through activation of the sympathoadrenal system, increases systolic blood pressure, heart rate, risk of arrhythmias, myocardial ischemia, and fluid accumulation/redistribution, all factors linked to HF decompensations.8,14,15 In addition, it has been reported that when glycemic values are low, muscle cells shift to free fatty acids as the principal fuel. Long-term use of free fatty acids increases beta-oxidation and mitochondrial-derived H2O2, oxidative stress, and signals that contribute to muscle cell dysfunction and apoptosis.23 This can be another relevant pathophysiological mechanism endorsing the relationship between low HbA1c and adverse events in HF.
Low Glycosylated Hemoglobin and Adverse Events: An Epiphenomenon or a Treatment-related Effect?Factors involved in the paradoxical association between low HbA1c and adverse outcome remains a matter of debate. On one side are data endorsing hypoglycemia as a confounder of other surrogates of disease severity, rather than as having a causal relationship with treatment success.8,9,24 On the other, some findings suggest a treatment-related effect. For instance, a contemporary systematic review of observational studies, including 903 510 diabetic patients, found that severe hypoglycemia was associated with approximately twice the risk of CV disease. A bias analysis revealed that the observed association between severe hypoglycemia and CV disease may not be entirely due to confounding by comorbid severe illness.7
In the setting of patients with diabetes and HF, this controversy is especially relevant, for two reasons: a) these patients usually exhibit a high-risk profile for hypoglycemic episodes (longer history of diabetes, extensive comorbidity, and frailty), and b) the available data on this topic are scarce and heterogeneous. For instance, diabetic patients with HF enrolled in CHARM (Candesartan in Heart Failure: Assessment of Reduction in Mortality and Morbidity) who were treated with insulin had about two-fold increased risk of morbidity and mortality, compared to those who were not treated with insulin.25 Conversely, in a cohort from the United States of 16 000 Medicare patients with diabetes recently discharged with HF, treatment with sulfonylureas or insulin were not independently associated with higher risk of 1-year mortality and readmission.26 Unfortunately, none of these studies explored the interactions between hypoglycemic agents, glycemic control status, and clinical outcomes. In the present study, although patients with lower HbA1c had worse baseline risk profile, a thoroughly multivariate adjustment showed that HbA1c remained inversely and independently associated to higher risk of readmission in those receiving Ins/SU/MG—suggesting, at least in part, a treatment-related effect. In light of our results, and in agreement that the risk for severe to moderate hypoglycemias increases exponentially among patients treated with sulfonylureas, meglitinides, or insulin,27 we postulate that both excessive low-glucose treatment and a high baseline risk for hypoglycemia might be the underlying factors behind the association between low HbA1c and 30-day readmission. Further controlled studies are needed to elucidate the optimal diabetes control in patients with a recent admission for AHF.
LimitationsThis is a single-center observational study. Important risk factors for hypoglycemia such as evolution of diabetes, frailty, and treatment dosage were not available in the registry, which precludes their inclusion as covariates in the multivariate models. Diabetes treatments were grouped into categories; this impeded evaluating the contribution of each pharmacological agent to the present findings. In addition, hypoglycemic episodes were not monitored during the observation period, precluding any establishment of a temporal relationship between hypoglycemia and rehospitalization. Finally, information regarding metabolic control and therapeutic history prior this hospitalization was not assessed in this study.
CONCLUSIONSIn summary, in DM2 patients recently discharged for AHF, we found that Glycosylated hemoglobin value was differentially associated with the risk of 30-day readmission. HbA1c was inversely related to higher risk of 30-day readmission in patients discharged with insulin or Ins/SU/MG. A marginal effect was found in the rest of diabetics. Whether this association reflects a treatment-related effect or merely a surrogate of more advanced disease should be clarified in further studies.
FUNDINGThis work was supported in part by grants from Instituto de Salud Carlos III, Red de Investigación Cardiovascular, Programa 7 (RD12/0042/0010).
CONFLICTS OF INTERESTNone declared.