Keywords
The main aim in treating acute myocardial infarction (AMI) is to restore patency in the epicardial coronary artery. The theory of the "open artery" is based on two fundamental factors: time (as soon as possible) and size (as much flow as possible). Whatever the reperfusion method used, as demonstrated in many studies,1-6 the final aim is that the angiographic parameter, epicardial blood flow, is normal. Given that the latest developments make it possible to restore "normal" epicardial flow in more than 90% of the patients and that, given this is achieved, a significant number of patients still have unresolved ST segment and their myocardial perfusion is not restored under myocardial contrast echocardiography (MCE), interest has shifted from the epicardial arteries towards myocardial perfusion. There are several methods to assess the state of coronary microcirculation and myocardial perfusion, from the simplest--analyzing a previously resolved ST-segment elevation in the electrocardiogram (ECG),7-19 to the more complex--positron emission tomography (PET).20-22 The aim of this article is to review the findings obtained with coronary angiography18,23-29 to assess the quality of both epicardial and microvascular reperfusion.
RELEVANCE AND LIMITATIONS OF ASSESSING EPICARDIAL FLOW
Open Epicardial Artery: TIMI Flow Grading
The evaluation of blood flow in the epicardial coronary artery was formalized 20 years ago by the TIMI research group (Thrombolysis In Myocardial Infarction) with the so-called TIMI flow grades.1 Table 1 shows the characteristics of each grade.
Many studies have demonstrated the correlation between this parameter and later events such as: reinfarction,30-32 mortality,2-6,33,34 free wall rupture,35 development of ventricular aneurysm36or the appearance of arrhythmias.37-40 This correlation with prognosis, which was initially described for thrombolytic treatment in acute myocardial infarction (AMI), has also been extended to percutaneous coronary intervention therapy (PCI).39-44 This relationship has been shown to be so strong that TIMI 3 flow is normally used as a parameter to evaluate the efficacy of different treatments instead of the relevant clinical events.43-52
This classification allows us to establish the superiority of TIMI 3 flow over other parameters, even over TIMI grade 2: 2 meta-analyses33,34 report that early mortality was significantly lower among patients with TIMI 3 flow at 90 min after fibrinolysis than in the group with TIMI 2 flow (3.7% vs 6.6%; odds ratio [OR] =0.55; 95% confidence interval [CI], 0,4-0.76) or than in group with TIMI 0 or TIMI 1 flows (9.2%; OR=0.38; 95% CI, 0.29-0.5). With the development of repatency therapy using PCI, the use of these predictors has continued to prove their validity,41 although some studies point out that the difference in mortality between TIMI 2 and 3 grades might not be so marked nowadays with the use of invasive therapies that combine fibrinolytic drugs and PCI.23 On the other hand, technical developments in the intervention field (e.g. stenting,53,54 thrombectomy devices,55,56 distal protection systems57-60) have not been associated universally with an improvement in TIMI flow.
Nevertheless, this grading system has some limitations:
1. The most relevant limitation is its subjectivity, which leads to important discrepancies,61 even when the analyzes assessment is performed by core laboratories with wide experience.62,63
2. The filling time of the left anterior descending coronary artery (LAD) is higher than in other arteries, because this is normally the longest artery. Given that the filling of this artery can be simultaneously compared with the filling of the circumflex artery, the tendency to assign a TIMI grade 2 flow is much greater than with the right coronary artery (RCA).64
3. The TIMI group itself has modified (without much acceptance) the grading system to distinguish up to 3 different subgroups in TIMI 265 (Table 1). These changes include factors such as washout speed that will be later discussed.

4. Finally, we cannot discard the presence of factors that could significantly modify grading, such as the pressure and phase within the cardiac cycle at which the contrast injection is administered, the heart rate and blood pressure of the patient, the use of vasodilators, etc. The impact of these factors is discussed in the next section.
Open Epicardial Artery: Quantification. Corrected TIMI Frame Count
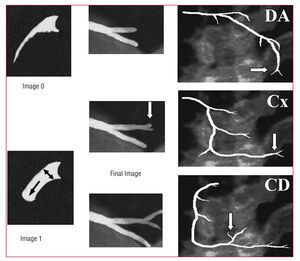
In the light of the potential limitations of the TIMI flow grading system, new evaluation systems have been developed that more deeply characterize flow and improve the reproducibility of results: the corrected TIMI frame count (cTFC) system developed by Gibson et al64 is the most widely validated. Basically, it quantifies the TIMI flow grade by measuring the time it takes the contrast agent to fill the entire length of the epicardial artery. In order to standardize the criteria, several distal bifurcations were defined to serve as "final landmarks": the "whale's tail" at the apex of the LAD, the longest total distance along which dye travels in the circumflex system and yet passes through the culprit lesion, and the first branch of the posterolateral artery in the right coronary artery (Figure 1). The difference in the number of frames between the last one and the first (where the contrast agent fills at least 70% of the arterial ostium and starts to move in an anterograde direction) constitutes the TIMI frame count.

Figure 1. Calculating TIMI frame counts. The first counting frame (frame 1) is the image where the contrast advances and fills at least 70% of the diameter of the arterial ostium. The last frame (final frame) is the image where the contrast begins to fill the final landmark. Distal bifurcations of the 3 epicardial arteries are shown. CD indicates right coronary artery; Cx, circumflex artery; DA, left anterior descending coronary artery.
Some of the methodological aspects of this system are outlined as follows:
1. As described,64 the length of the LAD is 1.7 times greater than the circumflex and the right coronary arteries. Thus, a correction factor was introduced in the TFC system when analyzing the LAD: the corrected TIMI frame count (cTFC) is the result of the absolute difference divided by the correction factor, 1.7.
2. All the values initially published as "frame counts" referred to the video format standard in the United States, NTSC: 30 frames per second. In order to adapt these values to the European system (PAL), they have to be converted or else use a standard measuring unit: time in seconds. Table 2 shows the most relevant values and their equivalence.

3. The original definition of this parameter includes defining the cTFC value =100 when the coronary artery is totally occluded. This leads to a distribution of values that does not follow a normal distribution, which entails using nonparametric statistical tests to analyze the results.
4. Implementing this method in practice is more complex than simple subjective assessment of flow because it takes longer, which is a very significant restriction in the context of acute patients.
This parameter has been correlated with the onset of major events, such as early mortality after fibrinolysis.23,66,67 This relationship is kept even when the analysis is restricted to patients with TIMI 3 flow: the patients with cTFC values less than 14 frames (which was defined as "TIMI 4 flow"64,66) presented a hospital mortality of 0%, compared to 2.7% in the group with cTFC between 14 and 40 frames (TIMI 3 flow) or to 6.4% in those with > 40 frames (P=.003).66 The relationship of cTFC to later prognosis has been demonstrated in other contexts, such as in primary angioplasty after infarction68-72 and in non-ST-segment elevation acute coronary syndrome (NSTEACS).73
The correlation with independent methods of coronary functioning assessment (e.g. coronary flow reserve assessed by Doppler guidewire74,75 or fractional flow reserve [FFR]76) has also been demonstrated. In complete contrast, some studies report no correlation between cTFC and coronary flow reserve parameters as measured by Doppler guidewire77,78 or even with early mortality.79 However, these studies assessed the flow in a limited number of patients after PCI and not at baseline. Thus, it is reasonable not to find a correlation between the baseline flow assessed by this method and the hyperemic flow analyzed via Doppler guidewire.
This method has obvious advantages over the qualitative assessment of epicardial flow:
1. Given the quantitative character of the parameter, high reproducibility has been demonstrated.62,63,80
2. This is an easy method that does not require special equipment and can be performed immediately after capturing angiographic images.
3. The cut-off points shown in Table 2 allow us to classify unclear epicardial flows.
Nevertheless, the method presents certain limitations as it has been found that some factors can significantly change the values calculated:
1. Heart rate. An increase of 20 heart beats/min shortens the count by 5 frames.80
2. Using nitrates increases the count by 6 frames.80
3. Injecting during the protodiastolic period reduces the count by 3-6 frames.80
4. When the LAD is the culprit artery of the infarction: in such cases the count is higher than in the other arteries by 8 frames, even after correcting for length and adjusting for other variables.81
It has not been demonstrated whether the calculation is affected by patient-dependent factors (e.g. age, sex, body size, blood pressure, or cardiovascular risk factors82) or by procedure-dependent factors (injection pressure83 or type of contrast agent84).
Taking this method as a basis, another assessment system has been developed, not only for the epicardial blood flow, but also for microcirculation flow--the assessment of the coronary blood flow reserve by analyzing the relationship of cTFC at baseline and cTFC after the administration of intracoronary74,85 or intravenous86 adenosine. This parameter has been correlated with Doppler guidewire analysis,74,86 although other studies have not confirmed this.77
ASSESSMENT OF MYOCARDIAL PERFUSION AND MICROCIRCULATION
Open Microvasculature: Assessment. Myocardial Blush
Since the classic descriptions of reperfusion injury and no reflow events were presented,87 the attempts to assess the state of myocardial perfusion after an infarction have increased. The resolution of the ST-segment7-19 is the simplest and most reproducible analysis. Another method widely used is the MCE,88-93 which, apart from being a non-invasive method, can be quantified. In both cases, the results have been correlated with the appearance of subsequent events.7-10,14,16,26,88-90,93-98
With the increasing implementation of PCI as the treatment of choice for AMI, the availability of an early angiography is quite frequent and this has permitted the development of the myocardial blush concept: the penetration of iodized contrast medium into the capillaries yields a "ground-glass" angiographic image in the irrigated myocardial territory. Two different systems to assess myocardial blush have been suggested. The first one is a videodensitometric system proposed by van't Hof et al25 which analyzes the intensity of regional contrast (myocardial blush grade [MBG]) compared to the unaffected contralateral or ipsilateral territories. The other is a dynamic analysis system that assesses the intensity of myocardial contrast as well as the speed of entry and clearance of the contrast medium (TIMI myocardial perfusion grade [TMPG]). This was developed by Gibson et al.24 Table 1 shows the four grades within each classification. Normal perfusion is identically graded in both systems: grade 3. Worse myocardial perfusion is shown by grades 0 in both systems; and major reperfusion injury (hemorrhagic transformation or persistent extravasation) are included in TMPG 1 and MBG 0, respectively. Cases of MBG 1 and 2 cannot really be extrapolated to the TMPG system, and so a subclassification has been proposed for these cases: the TMPG 0.5.99 Thus, the 2 systems are not as different as they might initially appear. Figure 2 shows some examples of myocardial perfusion analysis.

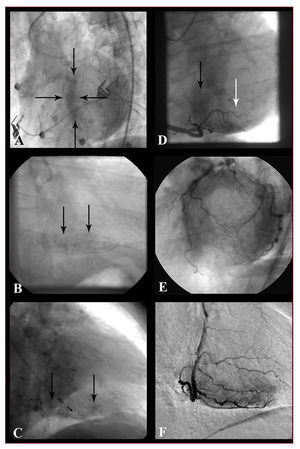
Figure 2. Examples of myocardial perfusion analysis. A: persistent stain of the septum (delimited by the arrows): grade 1 myocardial perfusion (TMPG), grade 0 myocardial blush (MBG) in LAD. B: persistent myocardial stain in the diaphragm territory: TMPG 1, MBG 0 grades in RCA. C: persistent capillary stain (small vessels are visualized) in RCA. D: lower intensity stain than in left coronary artery in the diaphragmatic territory (black arrow, TMPG 2 and MBG 2 grades) and barely present in posterolateral (white arrow, TMPG 0.5 and MBG 1 grades). E: normal myocardial stain (TMPG grade 3 and MBG grade 3) of left coronary artery: A donut-like image in LAO cranial projection. F: normal myocardial stain (TMPG 3 and MBG 3 grades) of RCA; example of digital subtraction (DSA).
Although the existence of these 2 systems may bring into question the validity of the method, the fact is that TMPG23,24 and MBG25,100,101 correlate with mortality (Figure 3), even when only TIMI grade 3 flow patients are included. The influence of these parameters has also been shown in the percentage of myocardium salvaged in respect to the risk area102 and the mortality in patients in shock103 or on the relationship between mortality and the evolution time of AMI.104-106 On the other hand, a correlation has been found between these systems and other parameters independently related with prognosis after infarction, such as the analysis of coronary flow reserve with Doppler guidewire,107,108 MCE,26,95,96 analysis of infarction size by single photon emission computed tomography (SPECT)18 or resolution of ST-segment elevation.18,28,101,108

Figure 3. Mortality after AMI and myocardial blush grades. A: mortality rate in relation to the myocardial blush grade: at 1 month (Gibson et al24), in the longer term (follow-up 1.9±1.7 years [van't Hof et al25] and after 1 year [Stone et al29]). B: mortality in relation to the myocardial blush grade in the patients with TIMI 3 flow in the culprit artery: at 1 month (Gibson et al24) and after 1 year (Stone et al29). TMPG: TIMI myocardial perfusion grade; MBG: myocardial blush grade.
The assessment of myocardial blush has its own limitations:
1. The qualitative character of this parameter makes it inherently subjective. Thus, intra- and inter-observer consistency is limited, as described by one of the groups with the greatest experience.25 In most studies, the analysis of MBG or TMPG is performed in central laboratories, and thus, the consistency with the assessments carried out by other observers might not be suitable.
2. Many of the studies carried out tend to group patients with MBG 2 and 3 or TMPG 2 and 3 into a single group with suitable perfusion. Given that it has been demonstrated that the prognosis of patients with TIMI 2 and TIMI 3 flow is not equivalent, this simplification of the system is most probably wrong.
3. Nevertheless, the fundamental limitation is not methodological, but refers to the unsolved challenge of treating suboptimal myocardial perfusion after coronary repatency. Table 3 sums up evidence published in this domain.

The correlation between the analysis of ST-segment resolution and myocardial blush is controversial because, although both have been related to clinical events, they do not always seem to match in every patient. What could be interpreted as a limitation tends to be assessed as another "anomalous" event, which are not uncommon in cardiology: the "electrical recovery" shown in the ECG is not always associated with integrity of the microvascular endothelium and recovery of perfusion, and vice versa. In fact, the 2 methods are complementary when the size of the infarction,18 or the angiography are analyzed. Their complementarity is also shown by the fact that the group with a better prognosis after an infarction is the one where patients have both markers positive.133-135 There is ample literature available on the correlation between MCE and angiography.26,95-98,136 although a perfect correlation is not always found, even though both methods, at least theoretically, analyze myocardial perfusion. Bearing in mind that this is a dynamic event (some days after the infarction, many patients that initially did not show suitable myocardial blush may show a much better grade135), the discrepancies may be due to the behavior of the different contrast agent used--echographic contrast agents (microbubbles) always remain in the intravascular space, whereas radiological contrast media (and paramagnetic contrast used in magnetic resonance) often present extravascular passage, subsequently returning to the bloodstream. Thus, some authors137 argue that angiography or magnetic resonance do not actually assess myocardial perfusion, but rather capillary patency, the state of the endothelium, and the edema and interstitial hemorrhage i.e. reperfusion injury.
Open Microvasculature: Quantification. Future Development
Myocardial perfusion assessed by angiography is analyzed by using several quantitative methods:
1. Methods based on digital subtraction angiography (DSA),85,138,139 widely used in vascular radiology, but little used in coronary angiography, may facilitate the quantification of the opacified area (in theory, this is "equivalent" to areas quantified in MCE), blush intensity ("MBG quantification")107,140 or the speed at which the blush appears or disappears ("TMPG quantification").138 For DSA to be more applicable, several studies are working on the development of techniques, such as moving mask, to attempt to neutralize the movements inherent to the heart.
2. A quantification system, based on cTFC has been suggested. This quantifies the number of frames between the entrance of the contrast agent into the myocardium and the peak blush intensity: the TIMI myocardial frame count. This count is significantly greater in patients with AMI with ST-segment elevation than in patients with NSTEACS141.
3. Our group has developed a quantification system known as the Coronary Clearance Frame Count (CCFC) with good correlation with TMPG142 grades. Defined as "the inverse of cTFC," it counts the difference in frames between the moment in which the contrast disappears from the arterial ostium and when it begins to disappear from the distal bifurcation described in the cTFC system. Although its potential clinical relevance has not been established yet, it shows correlation with myocardial perfusion TMPG grade 2 or 3, creating a cut-off point (45 images) that makes it possible to differentiate the better perfusion grades.
cTFC Analysis and Myocardial Blush. Practical Considerations
Both the quantitative analysis of epicardial blood flow (cTFC) and microvasculature flow can be carried out online with current digital equipment, or offline with software for image review. Nevertheless, if the imaging conditions are not optimal, the interpretation and later analysis may be biased. Thus, some standard recommendations are made:
1. Imaging field: 23 cm. Not magnifying the image enables recording the whole length of the artery without the need for panning. This is particularly important for the correct analysis of myocardial blush, especially when DSA is used. The quality of current DSA images (fixed mask) is also highly dependant on maintaining apnea during the recording.
2. Imaging speed: ideally, 25 frames/s. Nevertheless, cTFC can be calculated at any recording speed, and subsequently it can be expressed in seconds or adjusted to the recommended speed.
3. Recording time: up to the appearance of contrast in the venous phase. This is very relevant for the TMPG analysis system. In this case, it is also particularly important to leave at least 30 s between one injection and the following one, and not to record immediately after contrast tests (it may incorrectly assign TMPG 1 values).
4. Selective projections:
a) Analysis of cTFC. Recording images in PA or RAO projection (0o-30o) is recommended with caudal angulation (20o-30o) for the left coronary artery and in LAO projection (45o-60o) for the right coronary artery.
b) Blush analysis: the recommended projections differ from the previous ones, especially in the left coronary artery, where perfusion territories may be seen as overlapping. Thus, LAO projection (45o-60o) is recommended with cranial angulation (20o-30o), which makes it possible to see a donut-like image, or a left lateral projection (90o) in the case of the left coronary artery; for the right coronary artery, an LAO projection is recommended (45o-60o) with or without cranial angulation or RAO (30o).
From a practical point of view, in our center we systematically analyze myocardial perfusion data from angiographies (according to both the TMPG and the MBG system) in all cases of angioplasty within the context of AMI and in other cases of intervention with no reflow events or slow final blood flow, reserving cTFC and CCFC for cases with difficult-to-classify epicardial blood flow or perfusion. In all these cases, the information obtained is always complemented by electrocardiographic analysis of ST-segment resolution.
CONCLUSIONS
Coronary angiography offers relevant but simple and easy to interpret information, not only on the state of the epicardial coronary circulation (TIMI flow in the epicardial artery and its quantification, TIMI frame count), but also on the state of microvascular circulation (myocardial blush grades: TIMI myocardial perfusion and myocardial blush grades). These data allow us to reliably assess the patient's prognosis. The development of a quantitative variant of these techniques could improve their predictive power.
Correspondence:
Dr. A. Pérez de Prado.
Sección de Cardiología Intervencionista. Servicio de Cardiología. Hospital de León.
Altos de Nava, s/n. 24008 León. España.
E-mail: aperez@secardiologia.es