Advanced kidney disease is a major health problem due to its association with high cardiovascular morbidity and mortality. Early recognition of advanced kidney disease is the mainstay to avoid its progression. Since metabolic syndrome and insulin resistance are risk factors for both cardiovascular and advanced kidney disease, we investigated the relationship of early kidney disease (EKD) with metabolic syndrome and insulin resistance, and their association with surrogate markers of arteriosclerosis.
MethodsWe studied 1,498 subjects. Insulin resistance was defined as HOMA ≥3.7 mmol (μU)/L2 and EKD as stages 1 and 2 of the NKF-KDOQI. Carotid intima-media thickness was used as a surrogate marker of arteriosclerosis.
ResultsThe presence of one trait of metabolic syndrome was associated with an odds ratio (OR) for EKD of 2.3 (95% confidence interval [CI], 1.18-4.48) that increased to 6.72 (95% CI, 3.56-13.69) in subjects with the syndrome. All the traits of the syndrome except low level of high-density lipoproteins showed an increased OR for EKD. Increasing HOMA was also directly correlated with higher OR for EKD, being as high as 3.89 (95% CI, 1.99-7.59) for subjects in the fourth quartile. Subjects with the syndrome plus EKD showed an increased intima-media thickness compared with those without kidney disease.
ConclusionsInsulin resistance and all metabolic syndrome traits except low level of high-density lipoproteins were significantly associated with an increased OR for EKD. Both metabolic syndrome and EKD were independently and additively related to the presence of surrogate markers of arteriosclerosis.
Keywords
Advanced kidney disease (KD) and end-stage KD have been recognized as important problems for public health given their increasing prevalence and poor prognosis.1 It is known that once KD starts, it usually progresses. Even so, in patients with advanced KD cardiovascular complications are more prevalent than progression to end-stage KD.2, 3 Minimal reductions in the glomerular filtration rate is associated with an increase in vascular risk.4, 5, 6, 7, 8 Some of the factors associated with the progression of KD can be controlled medically and others cannot. Age is the most notable factor that cannot be controlled.9, 10, 11 The factors that can be controlled are the typical factors of vascular risk. The most important factors are high blood pressure, diabetes mellitus and insulin resistance (IR), obesity, and dyslipidemia. Together these make up the metabolic syndrome (MS). KD is divided into 5 stages,1 which can be grouped together in 2 blocks. On one side are the patients with analytical data showing kidney damage (microalbuminuria) and with a glomerular filtration rate ≥60ml/min/1.73m2 (stages 1 and 2; early KD [EKD]). On the other side are patients with an abnormal glomerular filtration rate, whether there is microalbuminuria or not (stages 3, 4 [advanced KD] and 5 [end-stage KD]).
MD is a collection of risk factors with a total and cardiovascular mortality described as approximately double that of the general population.12, 13 This is despite the fact that a greater knowledge of the symptoms has led to significant improvements in the individual management of these patients. Furthermore, this is an increasingly prevalent disease.14, 15, 16 An aging and obese population are the most important factors associated with the increasing prevalence of MS.16 This tendency for the prevalence to increase, which has reached a pandemic level,17, 18 has been confirmed in Spain.19, 20, 21 IR is the underlying metabolic defect of MS.
The hypothesis of this study was that MS and its traits could be associated with the early stages of KD. Furthermore, both diseases could have a synergistic effect on the development of arteriosclerosis. The objectives were to analyze the possible overall connection between MS, its traits, and EKD; assess the importance of each trait and IR in the presence of EKD; and assess EKD and MS as independent cardiovascular risk markers in the development of arteriosclerosis.
MethodsIn accordance with international guidelines, the patients included in the study were informed about the study and gave their written consent. The study was designed in accordance with the Declaration of Helsinki, and the protocol was approved by the Ethics Committee of the Clínica Universidad de Navarra (University Clinical Hospital of Navarra). The study was carried out with subjects who went to the hospital's Medical Examination Unit for a regular medical examination after fasting for 12h.
The study population was recruited between May 1999 and January 2009. We assessed 2163 consecutive subjects that underwent a general medical examination. A complete medical history was collected in all the cases. Exclusion criteria were as follows:
- Present or past history of arterial disease (claudication, ischemic cardiomyopathy or history of stroke).
- Previous diagnosis of high blood pressure and/or diabetes mellitus.
- Glomerular filtration rate below 60ml/min/1.73m2 (KD stage 3 to 5).
After the exclusions, 1498 subjects signed the informed consent and were included in the study.
EKD was defined as stages 1 and 2 of the criteria set out by the National Kidney Foundation. Albumin/creatinine ratio (ACR) was determined in an isolated urine sample in order to identify microalbuminuria. Kidney damage was defined as a microalbuminuria between 17-300mg/g for men and 25-300mg/g for women.1 The MDRD (Modification of Diet in Renal Disease) formula was used to estimate the glomerular filtration rate.1
The modified ATP-III criteria by the American Heart Association/National Heart, Lung, and Blood Institute (AHA/NHLBI22) were used to diagnose MS. Subjects with none of the AHA/NHLBI criteria were defined as the control population.
The Homeostasis Model Assessment (HOMA) index was used to measure IR. The IR cut-off point was set as a HOMA score of ≥3.7 mmol (μU)/l2 on the basis of a preliminary study carried out on 50 control subjects with a body mass index <25 where the average HOMA score was 1.61±0.696 mmol (μU)/l2. The cut-off point corresponded to the average HOMA score of this preliminary sample plus 3 standard deviations. It coincided with previous publications on Spanish populations.23
The intima-media thickness (IMT) of the carotid artery was analyzed as a marker of subclinical arteriosclerosis in 1000 of the 1498 subjects in the initial study. All of the carotid IMT measurements were made with a Doppler ultrasound by experienced ultrasound specialists from the hospital's Department of Radiology. The measurements were made with a 5-12MHz linear transducer (ATL 500 HDI). The interobserver and intraobserver variations of the ultrasound specialists have been validated in previous studies by our group.24, 25, 26 The measurement was taken at 1cm proximal to the bulb of each common carotid artery in plaque-free areas. The average value of both sides was used as the carotid IMT measurement. The cut-off point for abnormal carotid IMT was set at 0.75mm. This point was chosen as it was the lower limit of the upper quartile of an in-house study carried out on 156 healthy control subjects. Furthermore, this cut-off point was the same as that published for a sample of Spanish males of the same age group as the average age of our study.27
The analytical measurements were carried out using standard laboratory techniques.
The results were expressed as the arithmetic mean±standard deviation. Differences were considered to be statistically significant in all cases when P<.05.
The Shapiro-Wilks test and the Kolmogorov-Smirnov test (with the correction of Lilliefors) were used to analyze if a variable followed a normal distribution within a population. The Lévene's Test was used to analyze the equality of variances between the two samples.
The one-way ANOVA test, with the post-hoc Tukey B or Scheffé test, was used for the parametric samples, to compare the quantitative parameters between three or more experimental groups. The Kruskal-Wallis test followed by the Mann-Whitney U test was used for the post-hoc comparisons of non-parametric samples.
To compare two experimental groups Student's t-test for independent data was used for parametric samples and the Mann-Whitney U test was used for non-parametric samples.
Pearson's correlation test was used to carry out the bivariable analysis, and multivariable analysis was carried out using linear regression.
The statistical calculations were analyzed using SPSS software version13.0.
ResultsTable 1 shows the general characteristics of the population studied.
Table 1. Characteristics of the General Population (N=1498).
| Age (years) | 51.63 (10.42) |
| Males, % | 79.4 |
| Smokers, % | 27.2 |
| BMI | 27.63 (3.99) |
| SBP (mmHg) | 122.06 (18.47) |
| DBP (mmHg) | 79.25 (9.49) |
| Glycemia (mg/dl) | 96.15 (16.18) |
| Insulin (mU/l) | 10.57 (7.54) |
| HOMA (mU×mmol/l2) | 2.55 (2.08) |
| Triglycerides (mg/dl) | 115.14 (73.77) |
| Total cholesterol (mg/dl) | 223.57 (41.02) |
| HDL (mg/dl) | 52.55 (14.71) |
| LDL (mg/dl) | 148.12 (37.5) |
| Creatinine (mg/dl) | 0.93 (0.15) |
| CrCI (ml/min/1.73 m2) | 87.68 (14.79) |
| ACR (mg/g) | 9.06 (15.73) |
ACR, albumin/creatinine ratio; BMI, body mass index; CrCI, creatinine clearance rate; DBP, diastolic blood pressure; HDL, high-density lipoproteins; HOMA, Homeostasis Model Assessment; LDL, low-density lipoproteins; SBP, systolic blood pressure.
The results are expressed as the arithmetic mean (standard deviation), unless otherwise stated.
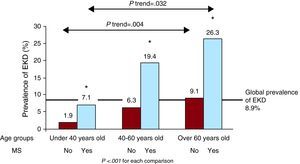
Of the 1498 subjects studied, 8.9% complied with EKD criteria. In the risk group analysis, we found a prevalence of 2.7% for EKD in subjects under 40years old. This increased to 8.8% in the age group ranging from 40-60years. The prevalence was 13.1% in subjects over 60years old. Table 2 compares the characteristics of the subjects depending on whether they had MS or not. While there were 74% of males in the group with no traits of MS, 77% of those who had 1 or 2 traits were male (P=.04). The body mass index was lower in the first group, but both groups were within the overweight range (25.12±2.73 compared to 26.91±3.62). Furthermore, differences were found in glycemia and systolic blood pressure. These values were within normal ranges in both cases. No significant differences were found in the rest of the comparisons carried out between the group without any traits of MS and those with 1 or 2 traits.
Table 2. Characteristics of the Population According to Presence of Metabolic Syndrome.
| Without MS | With MS | P | |
| Patients | 1208 | 290 | |
| Age (years) | 51.24 (10.51) | 53.19 (9.91) | .001 |
| Males, % | 76.8 | 90.7 | <.001 |
| Smokers, % | 25.5 | 34.5 | .002 |
| BMI | 26.7 (3.45) | 31.51 (3.73) | <.001 |
| SBP (mmHg) | 118.88 (17.07) | 135.28 (18.25) | <.001 |
| DBP (mmHg) | 77.67 (8.8) | 85.85 (9.42) | <.001 |
| Glycemia (mg/dl) | 93.32 (11.32) | 107.96 (25.44) | <.001 |
| Insulin (Mu/l) | 9.1 (6.03) | 17.37 (9.76) | <.001 |
| HOMA (mU×mmol/l2) | 2.1 (1.52) | 4.63 (2.88) | <.001 |
| Triglycerides (mg/dl) | 98.34 (51.45) | 184.85 (105.2) | <.001 |
| Total cholesterol (mg/dl) | 221.32 (39.68) | 232.94 (45.03) | <.001 |
| HDL (mg/dl) | 54.83 (14.68) | 43.03 (10.34) | <.001 |
| LDL (mg/dl) | 146.77 (36.79) | 153.8 (39.93) | .008 |
| Creatinine (mg/dl) | 0.93 (0.15) | 0.94 (0.13) | .241 |
| CrCI (ml/min/1.73 m2) | 87.51 (14.85) | 88.43 (14.54) | .286 |
| ACR (mg/g) | 7.82 (13.38) | 14.24 (22.36) | <.001 |
| Abnormal ACR, % | 6.3 | 20 | <.001 |
ACR, albumin/creatinine ratio; BMI, body mass index; CrCI, creatinine clearance; DBP, diastolic blood pressure; HDL, high-density lipoproteins; HOMA, Homeostasis Model Assessment; LDL, low-density lipoproteins; MS, metabolic syndrome; SBP, systolic blood pressure.
The results are expressed as the arithmetic mean (standard deviation), unless otherwise stated.
The prevalence of EKD increased progressively and was statistically significant as the number of traits of MS increased. Of the subjects with no traits, 2.9% met EKD criteria. The prevalence increased to 7.4% when a subject had 1 trait, to 9.5% with 2 traits, and to 20% when diagnosed with MS (P trend<.001). Table 3 shows that the healthy control subjects’ risk of EKD, estimated using odds ratio (OR), increased in connection with the number of traits of MS.
Table 3. Risk Estimate for Early Kidney Disease According to the Number of Traits of Metabolic Syndrome.
| Traits | OR (95% CI) | |||
| Not adjusted | P | Adjusted for age and sex | P | |
| 1 | 2.7 (1.39-5.22) | .003 | 2.3 (1.18-4.48) | .014 |
| 2 | 3.5 (1.8-6.81) | <.001 | 2.98 (1.51-5.9) | .002 |
| 3 or more | 8.4 (4.51-15.65) | <.001 | 6.72 (3.56-12.69) | <.001 |
CI, confidence interval; OR, odds ratio.
Figure 1 shows that prevalence of EKD significantly increased with age and according to the presence or absence of MS. This reached 26.3% in elderly subjects with MS.

Figure 1. Prevalence of early kidney disease in the general population for age groups and presence of metabolic syndrome. EKD, early kidney disease; MS, metabolic syndrome.
Table 4 shows that IR and all the traits of MS, except for a low level of high-density lipoproteins (HDL), were individually significantly associated with a higher risk of EKD.
Table 4. Risk Estimate (Odds Ratio) for Early Kidney Disease According to the Specific Traits of Metabolic Syndrome.
| Factor | OR (95% CI) | |||
| Not adjusted | P | Adjusted for age and sex | P | |
| Obesity | 2.54 (1.76-3.65) | <.001 | 2.31 (1.6-3.34) | <.001 |
| e-Tg | 3.26 (2.25-4.71) | <.001 | 3.21 (2.19-4.68) | <.001 |
| l-HDL | 1.11 (0.72-1.72) | .616 | 1.14 (0.73-1.77) | .543 |
| e-Gly | 2.12 (1.48-3.04) | <.001 | 1.73 (1.19-2.51) | <.004 |
| h-BP | 3.43 (2.34-5.02) | <.001 | 2.94 (1.98-4.35) | <.001 |
| IR | 2.58 (1.68-3.98) | <.001 | 2.37 (1.53-3.67) | <.001 |
CI, confidence interval; e-Gly, elevated basal glycemia according to the criteria of metabolic syndrome; e-Tg, elevated triglycerides according to criteria of metabolic syndrome; h-BP, high blood pressure according to the criteria of metabolic syndrome; IR, insulin resistance; l-HDL, low value of high-density lipoproteins according to the criteria of metabolic syndrome; OR, odds ratio.
The prevalence of EKD increased as the level of IR increased, from 4.2% in the first quartile to 4.5% in the second, 10.2% in the third, and 15.7% in the fourth (P trend<.001). Table 5 shows that risk of EKD estimated using OR increased in direct proportion to the HOMA-IR quartiles.
Table 5. Risk Estimate for Early Kidney Disease According to the Level of Insulin Resistance Calculated in Homeostasis Model Assessment Index Quartiles.
| Factor | OR (95% CI) | |||
| Not adjusted | P | Adjusted for age and sex | P | |
| Second quartile | 1.08 (0.48-2.42) | .838 | 0.99 (0.44-2.23) | .991 |
| Third quartile | 2.62 (1.31-5.23) | .006 | 2.55 (1.26-5.15) | .009 |
| Fourth quartile | 4.29 (2.22-8.3) | <.001 | 3.89 (1.99-7.59) | <.001 |
CI, confidence interval; OR, odds ratio; first quartile, <1.21 (mU×mmol)/l2; second quartile, 1.21-2.01 (mU×mmol)/l2; third quartile, 2.02-3.21 (mU×mmol)/l2; fourth quartile, >3.21 (mU×mmol)/l2.
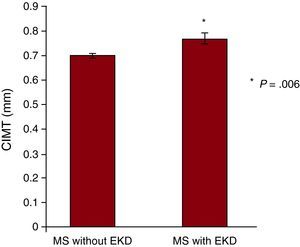
The presence of MS was associated with a greater carotid IMT, which went from 0.61±0.008mm in control subjects to 0.71±0.009mm in patients with MS (P<.001). Furthermore, the presence of EKD in the same healthy control subjects was also associated with a significant increase in the carotid IMT. This measurement was 0.75±0.01mm (P<.001). Figure 2 shows that coexistence of EKD in subjects with MS was associated with a significantly higher carotid IMT (P=.006).

Figure 2. Carotid intima-media thickness in patients with metabolic syndrome with and without early kidney disease. CIMT, carotid intima-media thicknes; EKD, early kidney disease; MS, metabolic syndrome.
Table 6 shows that MS and EKD were independent risk markers for abnormal carotid IMT estimated using the OR.
Table 6. Risk Estimate for Abnormal Carotid Intima-Media Thickness According to Metabolic Syndrome and Kidney Damage.
| Factor | OR (95% CI) | |||||
| Not adjusted | P | Adjusted for age and sex | P | Multivariable adjustment * | P | |
| MS | 1.83 (1.33-2.52) | <.001 | 1.78 (1.21-2.63) | .001 | 1.53 (1.07-2.85) | .024 |
| EKD | 2.42 (1.56-3.65) | <.001 | 1.95 (1.19-3.21) | .008 | 1.75 (1.07-2.85) | .032 |
CI, confidence interval; EKD, early kidney disease; MS, metabolic syndrome; OR, odds ratio.
* Adjusted for age, sex, and MS or EKD.
The OR of abnormal carotid IMT of EKD and each trait of MS was assessed. Only EKD (OR=1.65; 95% CI, 1.01-2.69; P=.044), high blood pressure (OR=1.6; 95% CI, 1.18-2.17; P=.003), and increased abdominal perimeter (OR=1.44; 95% CI, 1.03-2.03; P=.032) acted as independent risk factors for abnormal carotid IMT in an analysis adjusted for age, sex, EKD, and MS traits.
DiscussionThe results of this study confirmed that EKD increases with age, given that the prevalence was nearly 5 times higher in subjects over 60years old than in those under 40years old. This deterioration of renal function with age is supported by data available in the literature.9, 10 According to the EPIRCE (epidemiology of chronic renal failure in Spain) register, the prevalence of EKD in Spain may be around 2.2% in a population with an average age of 49years old.28 The data from the present study would point to a much higher prevalence; however, given the characteristics of the sampling, it is not possible to estimate the population prevalence. In any case, it confirms that EKD is a common disease in Spain, especially in elderly subjects.
The prevalence of EKD in subjects with MS was significantly higher than in subjects without MS. Furthermore, the risk of EKD doubled when a subject had 1 criterion of MS, and progressively increased to 6.72 times higher in subjects with 3 or more traits. These data coincide with the data previously described for advanced KD, with an absolute risk difference of between 1.4 and 2.6.29, 30, 31, 32 As far as we know, there are no data on the association between EKD and MS. The prevalence of EKD was notably higher in subjects with MS in all age groups. In addition, the difference between both prevalence rates is more significant in each age group compared to the previous one. It must be noted that there was a prevalence of 26.3% for EKD in subjects over 60years old with MS. This shows the synergistic effect of age and MS on the deterioration of kidney function. Therefore, and given the high prevalence of MS in Spain,19, 20, 21 we believe that a large number of patients at high risk of EKD could be selected for a combined measurement of glomerular filtration rate and ACR.
It was found when assessing each trait of MS that all of them, except for low level of HDL, were associated with a high OR of EKD. Although it is well documented that low level of HDL is a risk factor for the deterioration of the glomerular filtration rate, its association with the presence of microalbuminuria has not been proven.29, 30, 33, 34, 35, 36, 37
The presence of high levels of triglycerides tripled the risk of EKD. This association is described for advanced KD, with an OR of between 1.34 and 1.65.29, 30, 33, 34
These results showed that obesity doubles the risk of EKD. Obesity has been associated with an increased risk of developing advanced or end-stage KD, with an increased risk of between 1.73 and 3.57 depending on the study consulted.29, 38
According to the data of this study, with the glycemia cut-off point set at 100mg/dl, the risk of EKD was 1.73 times higher in patients with high basal glycemia than in normoglycemic subjects. No connection has been found between basal glycemia and advanced stages of KD in other studies that used the criterion of basal glycemia at 110mg/dl.29, 30 These results seem to indicate that there is a significant association between minimal increases in glycemia and initial deterioration of kidney function.
In the sample of this study, subjects that fulfilled the AHA/NHLBI criteria for high blood pressure had an estimated risk of EKD that was 2.94 times higher. This observation coincides with the literature, given that high blood pressure rates are currently considered to be a continuous risk factor for the progression of kidney failure.39 These results confirm that that there is a significant association between minimal changes in blood pressure and initial deterioration of kidney function.
The results of this study indicate that there is a significant connection between the level of IR and the prevalence of EKD. As the HOMA value increased, the prevalence of EKD increased, from 4.2% in the first quartile to 15.7% in the fourth quartile. In addition, the risk of EKD in subjects with IR was significantly higher compared with insulin-sensitive subjects. The connection between advanced KD and IR can be gathered from some population-based studies,31, 40 but its association with EKD had not been reported.
Carotid IMT is a useful and noninvasive method of assessing early carotid arteriosclerosis and is even considered a predictor of vascular events.41, 42 The data of this study show that patients with EKD have a significantly increased carotid IMT, compared to healthy subjects. In the multivariate analysis adjusted for age and sex, EKD acted as an independent risk marker in the development of subclinical arteriosclerosis even after adjusting for MS. Preliminary studies by our group had indicated that EKD could be associated with an increased carotid IMT.43 These results reinforce the idea that KD, even in early stages, favors arterial disease well before symptoms associated with kidney deterioration can be seen.4, 44 Furthermore, these results show that the carotid IMT of control subjects was significantly lower than that of subjects with MS without EKD, and this, in turn, was lower than in cases with MS and EKD. This piece of data could indicate that MS and EKD have a synergistic effect on the development of subclinical arteriosclerosis. The data of this study reveal that obesity and high blood pressure are the factors that are most closely associated with the development of subclinical arteriosclerosis in subjects with MS. However, EKD is even more closely associated, as can be seen in the differences in OR.
Clinical ImplicationsAs a result, screening for EKD can be very helpful in assessing the cardiovascular risk of patients with MS. Our results set the basis for prospective studies to be able to assess the effects of prevention and individual treatments for each MS trait on the onset and progression of arteriosclerosis and kidney diseases.
LimitationsOne of the limitations of this study was a possible bias in the classification of subjects as having EKD or not. This was because we had only one estimate of the glomerular filtration rate and 1 ACR measurement. The urinary albumin measurement can be affected by a large number of factors (poorly controlled high blood pressure, physical exercise in the previous 24h, hyperprotein diet, and others), and therefore the recommendation is to repeat it at least 2 or 3 times during a period of 3-6 months. If an error had been made, some of the participants would have been wrongly classified as having or not having EKD. As a result, this would have made it difficult to find differences between both groups, as this bias would tend to zero. Therefore, a stricter classification of the population would most likely show even more convincing data.
A recent publication45 states that sex could be an important factor in the appearance of stage 1 to 5 kidney disease in patients with MS. This association has not been considered in this study and therefore, future studies could clarify these results.
Validated markers to measure the socioeconomic level of the study population were not available.
ConclusionsMS is an important risk marker for EKD. Accordingly, its pathophysiology, IR, and all its traits, except for low level of HDL, are consistently associated with a higher prevalence of EKD. Furthermore, the coexistence of EKD in MS patients significantly increases the risk of thickened carotid IMT, compared to those without EKD.
Conflicts of interestNone declared.
Received 31 May 2010
Accepted 26 November 2010
Corresponding author: Departamento de Medicina Interna, Clínica Universidad de Navarra, Avda. Pío XII 36, 31008 Pamplona, Navarra, Spain. mflandecho@unav.es