Some anthropometric measurements show a greater capacity than others to identify the presence of cardiovascular risk factors. This study estimated the magnitude of the association of different anthropometric indicators of obesity with hypertension, dyslipidemia, and prediabetes (altered fasting plasma glucose and/or glycosylated hemoglobin).
MethodsCross-sectional analysis of information collected from 2022 participants in the PREDAPS study (baseline phase). General obesity was defined as body mass index ≥ 30kg/m2 and abdominal obesity was defined with 2 criteria: a) waist circumference (WC) ≥ 102cm in men/WC ≥ 88cm in women, and b) waist-height ratio (WHtR) ≥ 0.55. The magnitude of the association was estimated by logistic regression.
ResultsHypertension showed the strongest association with general obesity in women (OR, 3.01; 95%CI, 2.24-4.04) and with abdominal obesity based on the WHtR criterion in men (OR, 3.65; 95%CI, 2.66-5.01). Hypertriglyceridemia and low levels of high-density lipoprotein cholesterol showed the strongest association with abdominal obesity based on the WHtR criterion in women (OR, 2.49; 95%CI, 1.68-3.67 and OR, 2.70; 95%CI, 1.89-3.86) and with general obesity in men (OR, 2.06; 95%CI, 1.56-2.73 and OR, 1.68; 95%CI, 1.21-2.33). Prediabetes showed the strongest association with abdominal obesity based on the WHtR criterion in women (OR, 2.48; 95%CI, 1.85-3.33) and with abdominal obesity based on the WC criterion in men (OR, 2.33; 95%CI, 1.75-3.08).
ConclusionsAbdominal obesity indicators showed the strongest association with the presence of prediabetes. The association of anthropometric indicators with hypertension and dyslipidemia showed heterogeneous results.
Keywords
Overweight and obesity are associated with a multitude of health conditions, and the anthropometric indicators used to define obesity can help to identify individuals or populations at specific risk of a diverse range of health problems.1 The many available anthropometric obesity indicators include body mass index (BMI), waist circumference (WC), waist-hip ratio (WHR), and waist-height ratio (WHtR). Associations have been sought between these indicators and important cardiovascular and metabolic risk factors, such as impaired glucose metabolism, hypertension (HT), dyslipidemia, insulin resistance, and metabolic syndrome.
The consensus view is that cardiometabolic risk is better predicted by abdominal obesity based on WC, WHR, or WHtR than by general obesity based on BMI. In the 1980s, the abdominal obesity indicator WHR attracted much attention, and associations were reported with cardiovascular disease, stroke, and diabetes mellitus.2,3 More recently, WHtR has emerged as a better predictor of metabolic risk than general obesity.4,5 Height alters little during adulthood, and therefore changes in WHtR are assumed to reflect changes in WC; in contrast, WHR is more sensitve to changes in body shape because it tracks proportional changes in WC and hip circumference.6 The results of 3 meta-analyses have indicated that abdominal obesity based on WHtR is more strongly associated than BMI with diabetes, metabolic syndrome, and other cardiovascular risk factors.7–9
A Spanish study from the Canary Islands found that WHtR was better than BMI, WC, and WHR at detecting diabetes mellitus and other cardiovascular risk factors such as HT, hyperlipidemia, and impaired fasting plasma glucose.10
In a subsequent study of diabetes risk, WHtR was found to be one of the main predictors of the disease, together with impaired fasting glucose, Canarian ancestry, and insulin resistance.11 Another Spanish study found that WHtR and WC had a greater capacity than BMI to predict diabetes mellitus, dyslipidemia, and metabolic syndrome, whereas BMI was better at predicting HT.12
These previous studies evaluated the relationship between anthropometric obesity indicators and impaired fasting glucose; however, they did not evaluate whether abdominal obesity, in particular WHtR, is more strongly associated than general obesity with prediabetes under a broader definition that includes altered glycosylated hemoglobin (HbA1c). Here, we present the findings of another Spanish study evaluating the magnitude of the association between different anthropometric obesity indicators and HT, dyslipidemia, and the presence of prediabetes, defined broadly as altered fasting glucose and/or altered HbA1c.
METHODSStudy ParticipantsThe study population included 2022 participants aged between 30 and 74 years enrolled in the PREDAPS study. PREDAPS is an observational follow-up study conducted by 125 primary care physicians as part of their routine clinical practice at locations across Spain. PREDAPS is classified by the Agencia Española de Medicamentos y Productos Sanitarios (Spanish Medicines Agency) as an obervational nonpostauthorization study, and the protocol was approved by the Parc de Salut Mar Clinical Research Ethics Committee in Barcelona. Full details of the PREDAPS study design and methods have been published elsewhere.13,14 The present study used data collected in 2012 during the baseline PREDAPS study, which classified participants into 2 cohorts: 1184 with prediabetes and 838 with unaltered glucose metabolism. Prediabetes was defined according to American Diabetes Association criteria as fasting plasma glucose between 100 and 125mg/dL or HbA1c between 5.7% and 6.4%.
VariablesBiographical data, family and personal medical history, and information on lifestyle, pharmacological treatments, social support, and socioeconomic status were obtained from patient histories and interviews conducted during a medical consultation. A physical examination conducted during the same medical consultation recorded anthropometric data, blood pressure (BP), and heart rate. High-density lipoprotein cholesterol (HDL-C), triglycerides, and other biochemical parameters were determined in blood samples obtained during the initial consultation.
In the present study, HT was defined as systolic BP ≥ 140mmHg or diastolic BP ≥ 90mmHg and additionally as treatment with antihypertensive drugs or a personal history of HT. Hypertriglyceridemia was defined as triglyceride levels ≥ 150mg/dL or treatment with nicotinic acid or fibrates. Low HDL-C was defined as HDL-C < 40mg/dL for men or < 50mg/dL for women or treatment with nicotinic acid or fibrates.
Patient body weight was measured in kilograms, and height and WC were measured in centimeters, with all 3 measurements made to one decimal place. These variables were used to calculate 3 anthropometric indicators of obesity: a) general obesity, defined as BMI ≥ 30kg/m2 and calculated by dividing the body weight in kilograms by the square of the height in meters; b) abdominal obesity criterion 1, defined as WC ≥ 102cm in men and ≥ 88cm in women; and c) abdominal obesity criterion 2, defined as WHtR ≥ 0.55, calculated by dividing the WC in centimeters by the height in centimeters.
Statistical AnalysisData from men and women were analyzed separately. We first calculated the percentage distribution of patients in each of the 2 study cohorts according to age, family history of diabetes, BP, lipids, and obesity; statistical significance of distributions was evaluated by the chi-square test. Second, we calculated age-adjusted odds ratios (OR) to evaluate the association of the different obesity indicators with HT and dyslipidemia. Third, we calculated OR to evaluate the association of the different anthropometric obesity indicators with the presence of prediabetes. The adjustment variables included in the models were those that showed a significant association with prediabetes in other analyses of the PREDAPS study population: age, family history of diabetes, smoking status, alcohol consumption, HT, and dyslipidemia.16,17 Moreover, a significant association was found between prediabetes and the consumption of other lipid-lowering drugs (statins, ezetimibe, and omega 3 fatty acids); consumption of these agents was therefore included as an adjustment variable in the model, in addition to the antihypertensive and lipid-lowering drugs included in the definitions of HT and dyslipidemia. OR were calculated using logistic regression models. Differences were considered statistically significant at P < 0.05. The discriminatory power of the models was evaluated by calculating the area under the curve, with the threshold set at > 0.50.
Finally, to assess whether outcomes were influenced by the criteria used to define prediabetes, we evaluated the association of anthropometric obesity indicators with the presence of prediabetes defined as follows: a) impaired fasting glucose, b) impaired HbA1c, or c) simultaneous impairment of both fasting glucose and HbA1c. OR were calculated from multinomial logistic regression models, with the reference category being patients with no glucose metabolism alterations. In all models, goodness-of-fit was evaluated from the P value calculated with the Hosmer-Lemeshow test. In all cases, the P value was > 0.05, indicating that the models provided a good fit with the observed data. All analyses were performed with SPSS Statistics for Windows, version 19 (IBM Corporation, Armonk, New York, United States).
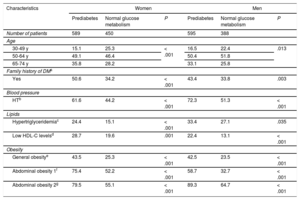
RESULTSA total of 2022 patients participated in the study: 589 women and 595 men with prediabetes and 450 women and 388 men with normal carbohydrate metabolism. Stratification of the prediabetes and nonprediabetes groups according to a range of characteristics is shown in Table 1. For both women and men, stratification by age revealed statistically significant between-group differences, Moreover, women and men with prediabetes more frequently had a family history of diabetes, HT, dyslipidemia, or obesity than did their counterparts with normal carbohydrate metabolism.
Percentage Distribution of Patients with or without Prediabetes According to Family History of Diabetes Mellitus, Blood Pressure, Lipid Status, and Obesity Status
| Characteristics | Women | Men | ||||
|---|---|---|---|---|---|---|
| Prediabetes | Normal glucose metabolism | P | Prediabetes | Normal glucose metabolism | P | |
| Number of patients | 589 | 450 | 595 | 388 | ||
| Age | ||||||
| 30-49 y | 15.1 | 25.3 | < .001 | 16.5 | 22.4 | .013 |
| 50-64 y | 49.1 | 46.4 | 50.4 | 51.8 | ||
| 65-74 y | 35.8 | 28.2 | 33.1 | 25.8 | ||
| Family history of DMa | ||||||
| Yes | 50.6 | 34.2 | < .001 | 43.4 | 33.8 | .003 |
| Blood pressure | ||||||
| HTb | 61.6 | 44.2 | < .001 | 72.3 | 51.3 | < .001 |
| Lipids | ||||||
| Hypertriglyceridemiac | 24.4 | 15.1 | < .001 | 33.4 | 27.1 | .035 |
| Low HDL-C levelsd | 28.7 | 19.6 | .001 | 22.4 | 13.1 | < .001 |
| Obesity | ||||||
| General obesitye | 43.5 | 25.3 | < .001 | 42.5 | 23.5 | < .001 |
| Abdominal obesity 1f | 75.4 | 52.2 | < .001 | 58.7 | 32.7 | < .001 |
| Abdominal obesity 2g | 79.5 | 55.1 | < .001 | 89.3 | 64.7 | < .001 |
BMI, body mass index; DBP, diastolic blood pressure; DM, diabetes mellitus; HDL-C, high-density lipoprotein cholesterol; HT, hypertension; SBP, systolic blood pressure; WC, waist circumference; WHtR, waist-height ratio.
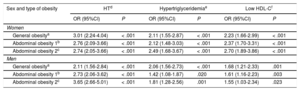
The association of obesity indicators with HT and dyslipidemia is shown in Table 2. The discriminatory power of all logistic regression models was > 0.5, with the area under the curve varying from around 0.70 for HT to around 0.60 for hypertriglyceridemia and low HDL-C. Among women, HT showed the strongest association with general obesity (age-adjusted OR, 3.01; 95% confidence interval [95%CI], 2.24-4.04). In contrast, among men the association was strongest with abdominal obesity based on WHtR (age-adjusted OR, 3.65; 95%CI, 2.66-5.01). The risk factors most strongly associated with WHtR-estimated abdominal obesity among women were hypertriglyceridemia (age-adjusted OR, 2.49; 95%CI, 1.68-3.67) and low HDL-C (age-adjusted OR, 2.70; 95%CI, 1.89-3.86).
Association of Anthropometric Obesity Indicators With Dyslipidemia and Hypertension in Women and Men
| Sex and type of obesity | HTd | Hypertriglyceridemiae | Low HDL-Cf | |||
|---|---|---|---|---|---|---|
| OR (95%CI) | P | OR (95%CI) | P | OR (95%CI) | P | |
| Women | ||||||
| General obesitya | 3.01 (2.24-4.04) | < .001 | 2.11 (1.55-2.87) | < .001 | 2.23 (1.66-2.99) | < .001 |
| Abdominal obesity 1b | 2.76 (2.09-3.66) | < .001 | 2.12 (1.48-3.03) | < .001 | 2.37 (1.70-3.31) | < .001 |
| Abdominal obesity 2c | 2.74 (2.05-3.66) | < .001 | 2.49 (1.68-3.67) | < .001 | 2.70 (1.89-3.86) | < .001 |
| Men | ||||||
| General obesitya | 2.11 (1.56-2.84) | < .001 | 2.06 (1.56-2.73) | < .001 | 1.68 (1.21-2.33) | .001 |
| Abdominal obesity 1b | 2.73 (2.06-3.62) | < .001 | 1.42 (1.08-1.87) | .020 | 1.61 (1.16-2.23) | .003 |
| Abdominal obesity 2c | 3.65 (2.66-5.01) | < .001 | 1.81 (1.28-2.56) | .001 | 1.55 (1.03-2.34) | .023 |
95%CI, 95% confidence interval; BMI, body mass index; DBP, diastolic blood pressure; HDL-C, high-density lipoprotein cholesterol; HT, hypertension; OR, odds ratio; SBP, systolic blood pressure; WC, waist circumference; WHtR, waist-height ratio.
In contrast, among men, hypertriglyceridemia and low HDL-C were more strongly associated with general obesity, with age-adjusted OR values of 2.06 (95%CI, 1.56-2.73) and 1.68 (95%CI, 1.21-2.33), respectively.
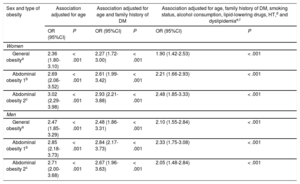
The association between obesity indicators and the presence of prediabetes is presented in Table 3. The discriminatory power of all logistic regression models was > 0.5. The area under the curve in the models that included all adjustment variables was approximately 0.70. Prediabetes showed a stronger association with abdominal obesity (using either of the 2 criteria) than with general obesity. Prediabetes among women showed the strongest association with abdominal obesity based on WHtR (age-adjusted OR, 3.02; 95%CI, 2.29-3.98). After further adjusting for family history of diabetes, smoking status, alcohol consumption, lipid-lowering drug therapy, HT, and dyslipidemia, the OR decreased to 2.48 (95%CI, 1.85-3.33). Among men, prediabetes showed the strongest association with abdominal obesity based on WC (age-adjusted OR, 2.85; 95%CI, 2.18-3.73). After further adjusting for family history of diabetes, smoking status, alcohol consumption, lipid-lowering drug therapy, HT, and dyslipidemia, the OR decreased to 2.33 (95%CI, 1.75-3.08).
Association of Anthropometric Obesity Indicators With the Presence of Prediabetes in Women and Men
| Sex and type of obesity | Association adjusted for age | Association adjusted for age and family history of DM | Association adjusted for age, family history of DM, smoking status, alcohol consumption, lipid-lowering drugs, HT,d and dyslipidemiae,f | |||
|---|---|---|---|---|---|---|
| OR (95%CI) | P | OR (95%CI) | P | OR (95%CI) | P | |
| Women | ||||||
| General obesitya | 2.36 (1.80-3.10) | < .001 | 2.27 (1.72-3.00) | < .001 | 1.90 (1.42-2.53) | < .001 |
| Abdominal obesity 1b | 2.69 (2.06-3.52) | < .001 | 2.61 (1.99-3.42) | < .001 | 2.21 (1.66-2.93) | < .001 |
| Abdominal obesity 2c | 3.02 (2.29-3.98) | < .001 | 2.93 (2.21-3.88) | < .001 | 2.48 (1.85-3.33) | < .001 |
| Men | ||||||
| General obesitya | 2.47 (1.85-3.29) | < .001 | 2.48 (1.86-3.31) | < .001 | 2.10 (1.55-2.84) | < .001 |
| Abdominal obesity 1b | 2.85 (2.18-3.73) | < .001 | 2.84 (2.17-3.73) | < .001 | 2.33 (1.75-3.08) | < .001 |
| Abdominal obesity 2c | 2.71 (2.00-3.68) | < .001 | 2.67 (1.96-3.63) | < .001 | 2.05 (1.48-2.84) | < .001 |
95%CI, 95% confidence interval; BMI, body mass index; DBP, diastolic blood pressure; DM, diabetes mellitus; HDL-C, high-density lipoprotein cholesterol; HT, hypertension; OR, odds ratio; SBP, systolic blood pressure; WC, waist circumference; WHtR, waist-height ratio.
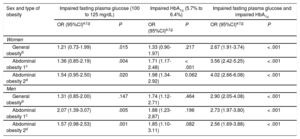
Finally, we assessed the association of obesity indicators with each of 3 types of prediabetes (Table 4). Among women, abdominal obesity based on WHtR showed the strongest association with all 3 types of prediabetes. The OR values adjusted for all variables (age, family history of diabetes, smoking status, alcohol consumption, lipid-lowering drug therapy, HT, and dyslipidemia) were as follows: 1.54 (95%CI, 0.95-2.50) for impaired fasting glucose, 1.98 (95%CI, 1.34-2.92) for impaired HbA1c, and 4.02 (95%CI, 2.66-6.08) for alterations to both fasting plasma glucose and HbA1c. Among men, abdominal obesity based on WC showed the strongest association with impaired glucose and with impaired HbA1c; however, general obesity based on BMI showed the strongest association with the simultaneous alteration of fasting plasma glucose and HbA1c (all-variable-adjusted OR, 2.90; 95%CI, 2.05-4.08).
Association of Anthropometric Obesity Indicators With Prediabetes in Women and Men According to the Definition of Prediabetesa
| Sex and type of obesity | Impaired fasting plasma glucose (100 to 125 mg/dL) | Impaired HbA1c (5.7% to 6.4%) | Impaired fasting plasma glucose and impaired HbA1c | |||
|---|---|---|---|---|---|---|
| OR (95%CI)e,f,g | P | OR (95%CI)e,f,g | P | OR (95%CI)e,f,g | P | |
| Women | ||||||
| General obesityb | 1.21 (0.73-1.99) | .015 | 1.33 (0.90-1.97) | .217 | 2.67 (1.91-3.74) | < .001 |
| Abdominal obesity 1c | 1.36 (0.85-2.19) | .004 | 1.71 (1.17-2.48) | < .001 | 3.56 (2.42-5.25) | < .001 |
| Abdominal obesity 2d | 1.54 (0.95-2.50) | .020 | 1.98 (1.34-2.92) | 0.062 | 4.02 (2.66-6.08) | < .001 |
| Men | ||||||
| General obesityb | 1.31 (0.85-2.00) | .147 | 1.74 (1.12-2.71) | .464 | 2.90 (2.05-4.08) | < .001 |
| Abdominal obesity 1c | 2.07 (1.39-3.07) | .005 | 1.88 (1.23-2.87) | .196 | 2.73 (1.97-3.80) | < .001 |
| Abdominal obesity 2d | 1.57 (0.98-2.53) | .001 | 1.85 (1.10-3.11) | .082 | 2.56 (1.69-3.88) | < .001 |
95%CI, 95% confidence interval; BMI, body mass index; DBP, diastolic blood pressure; HbA1c, glycohemoglobin; HT, hypertension; OR, odds ratio; SBP, systolic blood pressure; WC, waist circumference; WHtR, waist-height ratio.
OR and 95%CI were adjusted for age, family diabetes history, smoking status, alcholol consumption, lipid-lowering drug therapy, HT, and dyslipidemia.
Of the 3 anthropometric indicators studied, WHtR showed the strongest association with dyslipidemia in women and with HT in men, whereas BMI showed the strongest association with HT in women and with dyslipidemia in men. Compared with BMI, both abdominal obesity indicators showed a stronger association with prediabetes, except among men who met both prediabetes critieria: impaired fasting glucose and impaired HbA1c.
Previous studies indicated that abdominal obestity can induce a state of insulin resistance, characterized by a defective response to insulin in peripheral tissues (musculoskeletal tissues, liver, and adipose tissue) and resulting in altered glucose uptake and utilization.18,19 This situation leads to elevated plasma glucose and a compensatory increase in insulin, accompanied by other changes such as HT, dyslipidemia, and fatty liver. The results of a large and diverse body of research, including the present study, reveal that prediabetes is more strongly assocated with indicators of abdominal obesity than with general obesity. However, this pattern is not observed for HT or dyslipidemia.
Indeed, previous research into how anthropometric measurements relate to HT and dyslipidemia has produced inconsistent findings. For example, a Spanish study of elderly individuals at high cardiovascular risk found that WC and WHtR were superior to BMI at distinguishing dyslipidemia, whereas BMI was better at distinguishing HT.12 This lack of consistency is evident from the meta-analyses cited above, which sought to determine which anthropometric indicator best distinguishes dyslipidemia, HT, and diabetes mellitus. In 1 study, WHtR showed no clear superiority over the other indicators in distinguishing dyslipidemia, but was more strongly associated with HT in men.7 Another meta-analysis found that abdominal obesity indicators were not clearly superior at distinguishing dyslipidemia in men or HT in women.8 The results presented here are consistent with these meta-analyses in producing heterogeneous results, with differences between men and women.
Nonetheless, other studies have found altered fasting plasma glucose to be more strongly associated with abdominal obesity than with general obesity,20–22 and similar results have been obtained in studies carried out in Spain.11,12,23 For example, in 2 studies, altered fasting plasma glucose was more strongly associated with WC or WHtR than with BMI.11,12 Another study also revealed a stronger assocation of impaired fasting glucose with WC than with BMI; however, this study did not measure WHtR.19 In the present study, we obtained similar results from an analysis of the assocation in men and women between different anthropometric indicators and the presence of prediabetes defined as alterations to fasting plasma glucose and/or HbA1c. The only exception was observed in men who met both prediabetes criteria, among whom the strongest association with prediabetes was shown by general obesity based on BMI. This result has important implications for the management of male patients, since individuals who meet both prediabetes criteria have a 5-fold higher risk of progressing to diabetes than those who meet only one.24,25
The findings of this study do not demonstrate a clear superiority of WHtR over WC. The association with prediabetes was stronger with WC among men but with WHtR among women. Between 5% and 10% of prediabetes patients progress to diabetes per year,26 and early diagnosis and appropriate lifestyle interventions can reduce this progression by more than 50%.27 Abdominal obesity indicators may therefore be the most appropriate anthropometric indicators for identifying the possible presence of prediabetes. However, BMI remains an important measurement for men, among whom it predicts the type of prediabetes with the highest risk of progressing to diabetes.
Strengths and LimitationsA strength of the present study is that it includes a large number of patients attending primary care centers across Spain. Moreover, this is the first study to evaluate the relationship between different anthropometric indicators and the presence of prediabetes defined broadly as alterations to fasting plasma or HbA1c. The American Diabetes Association accepts both criteria for the diagnosis of prediabetes.15 The main limitation is that this is a cross-sectional study, and therefore the direction of the association is not identified. However, knowledge of the natural history of the disease clearly suggests that it is not prediabetes that increases the risk of obesity, but rather the obese state that increases the risk of prediabetes. It is also possible that patients with prediabetes may have received medical advice about lifestyle modifications and losing weight, which could lead to the association being underestimated. In addition, the results might have been influenced by treatments not included as adjustment variables in the regression models, including neuromodulators (neuroleptic drugs and antidepressants), hormones (corticoids, thyroid hormone mimetics, and anabolic-androgenic steroids), oral antidiabetic drugs, and antiobesity medication. However, medication with neuromodulators and hormones did not differ between patients with prediabetes and those with unimpaired glucose metabolism, and only 11 patients in the study were under medication with oral antidiabetic or antiobesity drugs. Finally, in our population of health service users, obesity among participants with no glucose metabolism alterations is likely to be more prevalent than it is in the general population, and the results therefore cannot be extrapolated more widely.
CONCLUSIONSCompared with the general obesity indicator, abdominal obesity indicators show a stronger association with prediabetes, except among men with alterations to both fasting plasma glucose and HbA1c. The results do not show a consistent pattern of association between anthropometric indicators and the presence of HT and dyslipidemia
FUNDINGThis study received funding from Novartis and Sanofi for the development of the telematic data-collection platform, researcher meetings, and study monitoring. Sanofi and Novartis did not participate in the study design, data analysis and interpretation, manuscript writing, or the decision to submit the manuscript for publication. This study was possible thanks to the infrastructure provided by the Fundación redGDPS (Spanish acronym for Research Network into Diabetes in Primary Health Care).
CONFLICTS OF INTERESTNone declared.
- –
Abdominal obesity is a better predictor than general obesity of cardiometabolic risk.
- –
Some studies have identified WHtR as the abdominal obesity indicator most strongly associated with altered fasting plasma glucose, diabetes, cardiovascular risk factors, and metabolic syndrome.
- –
It is unknown if WHtR shows a stronger association than general obesity with prediabetes, under a broad definition that includes altered HbA1c.
- –
WHtR shows the strongest association with dyslipidemia in women and with HT in men. Body mass index shows the strongest association with HT in women and with dyslipidemia in men.
- –
Abdominal obesity indicators are better than BMI at distinguishing prediabetes, except in men diagnosed with prediabetes involving alterations to both fasting glucose and HbA1c.
- –
Prediabetes shows a stronger assocation with abdominal obesity based on WHtR in women but with abdominal obesity based on WC in men.
.