Recent studies have identified several genetic variants associated with coronary artery disease. Some of these genetic variants are not associated with classical cardiovascular risk factors and the mechanism of such associations is unclear. The aim of the study was to determine whether these genetic variants are related to subclinical atherosclerosis measured by carotid intima media thickness, carotid stiffness, and ankle brachial index.
MethodsA cross-sectional study nested in the follow-up of the REGICOR cohort was undertaken. The study included 2667 individuals. Subclinical atherosclerosis measurements were performed with standardized methods. Nine genetic variants were genotyped to assess associations with subclinical atherosclerosis, individually and in a weighted genetic risk score. A systematic review and meta-analysis of previous studies that analyzed these associations was undertaken.
ResultsNeither the selected genetic variants nor the genetic risk score were significantly associated with subclinical atherosclerosis. In the meta-analysis, the rs1746048 (CXCL12; n = 10581) risk allele was directly associated with carotid intima-media thickness (β = 0.008; 95% confidence interval, 0.001-0.015), whereas the rs6725887 (WDR12; n = 7801) risk allele was inversely associated with this thickness (β = −0.013; 95% confidence interval, –0.024 to –0.003).
ConclusionsThe analyzed genetic variants seem to mediate their association with coronary artery disease through different mechanisms. Our results generate the hypothesis that the CXCL12 variant appears to influence coronary artery disease risk through arterial remodeling and thickening, whereas the WDR12 risk variant could be related to higher plaque vulnerability.
Keywords
Coronary artery disease (CAD), the leading cause of death1 and disability worldwide,2 has a significant genetic component. Recent genome-wide association studies have identified several single nucleotide polymorphisms (SNPs) associated with myocardial infarction and CAD.3–11 Some of these variants are also associated with classical cardiovascular risk factors (cCVRFs), but others are not, and the biologic mechanisms underlying their association with CAD remain unclear.
Atherosclerosis is the main etiopathogenic mechanism related to CAD. It begins with a subclinical phase, starting early in life,12 and the clinical manifestations represent the end stage of this chronic process. Therefore, the measurement of early and intermediate stages of subclinical atherosclerosis may be used to identify the progression of this process and to predict the future risk of cardiovascular or coronary events. Intima-media thickness (IMT), stiffness of the carotid artery, and ankle-brachial index (ABI) are accurate, quantifiable, reproducible, and noninvasive markers of atherosclerosis and well-established predictors of future cardiovascular events such as myocardial infarction and stroke.13–15
The study of the association between the presence of subclinical atherosclerosis and of SNPs associated with CAD independently of cCVRFs could shed some light on the biological mechanisms underlying this relationship. This study had two aims: a) to determine whether genetic variants associated with CAD but not with cCVRFs are related to subclinical atherosclerosis as assessed by carotid IMT, carotid stiffness, and ABI in a population-based survey, and b) to perform an updated systematic review and meta-analysis of previous studies that analyzed these associations.
METHODSDesignA cross-sectional study nested in the Girona Heart Registry (REGICOR) cohort study.16,17 We used data from the follow-up of 2 population-based cohorts originally enrolled in 1995 and 2000 (with response rates of 72.4% and 70.0%, respectively) from towns that represent the geographic diversity of Girona province.16,17 During 2007-2010, the surviving, noninstitutionalized participants residing in these towns were invited to participate in a follow-up visit; the response rate was 78.4%. We selected participants aged 35 to 74 years at the time of the basal exams, who were free of cardiovascular disease at that time, and for whom DNA was available. This study was approved by the local ethics committee, and participants gave written informed consent.
Genetic Variants Selection, Genotyping, and Multilocus Risk Score GenerationWe selected 9 genetic variants associated with CAD but not with cCVRFs: blood pressure, total cholesterol, low-density lipoprotein cholesterol, high-density lipoprotein cholesterol, triglycerides, diabetes, and smoking. A multilocus genetic risk score was generated as previously described.17 The first 7 variants selected were associated with CAD in genome-wide association studies: rs17465637 in MIA3, rs6725887 in WDR12, rs9818870 in MRAS, rs12526453 in PHACTR1, rs1333049 near CDKN2A/2B, rs1746048 near CXCL12 and rs9982601 near SCL5A3. We also included the rs10455872 variant in LPA18 and the haplotype B (rs10507391, rs17216473, rs9315050, rs17222842) in ALOX5AP,19 which have been associated with CAD risk independently of cCVRFs.
The DNA samples were genotyped by Spain's National Center for Oncology Research in Madrid using the Cardio inCode chip (Ferrer inCode; Barcelona, Spain), which is based on Veracode (Illumina; San Diego, United States) and KASPar (KBioscience; Hoddesdon, United Kingdom) technologies. Quality control criteria were applied both to individual samples and to selected SNPs, including Hardy-Weinberg equilibrium analyses. The overall percentage of agreement of the chip with reference technology was 99.9% and the analytical sensitivity and specificity were greater than 98.6%.
A multilocus genetic risk score was also computed for each individual as the sum of the number of risk alleles across all 9 variants, after weighting each variant by its estimated effect size in the CARDIoGRAM10 study (Table 1). The weights for the LPA and ALOX5AP variants were based on the coefficients reported in the corresponding publications.18,19 The genetic risk score was calculated using the following formula:
Where: βi is the estimated effect size reported for each variant in the CARDIoGRAM study or the corresponding publication for LPA and ALOX5AP; SNPi is the number of risk alleles of each individual SNP evaluated (can have values of 0, 1, or 2 for genotyped SNPs).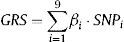
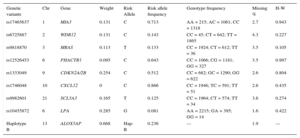
Genetic Variants Selected and Included in This Study, Weights Assigned to Each Variant, Observed Allele and Genotype Frequencies, Missingness, and P-Value for the Deviation From Hardy-Weinberg Equilibrium
| Genetic variants | Chr | Gene | Weight | Risk Allele | Risk allele frequency | Genotype frequency | Missing % | H-W |
|---|---|---|---|---|---|---|---|---|
| rs17465637 | 1 | MIA3 | 0.131 | C | 0.713 | AA = 215; AC = 1061; CC = 1318 | 2.7 | 0.943 |
| rs6725887 | 2 | WDR12 | 0.131 | C | 0.143 | CC = 45; CT = 642; TT = 1865 | 4.3 | 0.227 |
| rs9818870 | 3 | MRAS | 0.113 | T | 0.133 | CC = 1924; CT = 612; TT = 36 | 3.5 | 0.105 |
| rs12526453 | 6 | PHACTR1 | 0.095 | C | 0.643 | CC = 1066; CG = 1181; GG = 327 | 3.5 | 0.997 |
| rs1333049 | 9 | CDKN2A/2B | 0.254 | C | 0.512 | CC = 682; GC = 1290; GG = 622 | 2.6 | 0.804 |
| rs1746048 | 10 | CXCL12 | 0 | C | 0.866 | CC = 1946; TC = 591; TT = 51 | 2.6 | 0.435 |
| rs9982601 | 21 | SCL5A3 | 0.165 | T | 0.125 | CC = 1964; CT = 574; TT = 34 | 3.6 | 0.274 |
| rs10455872 | 6 | LPA | 0.285 | G | 0.081 | AA = 2215; GA = 395; GG = 14 | 1.6 | 0.422 |
| Haplotype B | 13 | ALOX5AP | 0.668 | Hap-B | 0.236 | --- | 1.9 | --- |
Carotid scans were assessed by 3 certified sonographers using a standardized protocol and an Acuson XP128 ultrasound instrument (Acuson-Siemens; Erlangen, Germany) equipped with an L7 5-12MHz linear array transducer. In summary, predefined arterial segments of the right and left carotid arteries were scanned: a) the common carotid 1cm proximal to the dilation; b) the carotid bulb, and c) the internal carotid 1cm distal to the flow divider. A still image of each arterial segment was saved as a DICOM (digital information and communication in medicine) still image. The image files were securely transferred to a reading laboratory (Imagelabonline; Amsterdam, The Netherlands). Trained and certified technicians analyzed the images using validated “eTrack” software.20 The technicians identified the interfaces with cross-hairs; the software connected the cross-hairs with splines. Carotid IMT was defined as the average distance (mean IMT) and maximum distance (maximum IMT) between the lumen-intima and media-adventitia interfaces of a given arterial far wall segment.
The outcomes of interest were: a) the mean of the average IMTs for the left and right common carotid arteries (mean IMTcca), internal carotid arteries (mean IMTica), and carotid bulbs (mean IMTbul), and, b) the maximum IMT value for the left and right common carotid arteries (maximum IMTcca), internal carotid arteries (maximum IMTica), and carotid bulbs (maximum IMTbul).
Intersonographer and intrasonographer variability were evaluated using repeated IMT measurements conducted at 2 visits, 2 weeks apart, by up to 3 sonographers, in 42 participants. The repeatability study showed intraclass correlation coefficients > 0.82 for the mean IMTcca, for both intrasonographer and intersonographer variability.
Carotid StiffnessTo evaluate carotid stiffness, we obtained the arterial distensibility coefficient (DC), defined as the relative change in cross-sectional area per unit of pressure. During the carotid ultrasound scan, the anterior and posterior walls of the distal right and left common carotid arteries were visualized in B-mode. To obtain the M-mode anterior wall intima-lumen and posterior wall lumen-intima tracings, the sonographer switched from full B-mode to a 1/3 B-mode 2/3 M-mode image of the distal common carotid. The 1/3 B-mode image guides the M-mode. The movement of the arterial walls on the 2/3 M-mode image shows waveforms with the double-line patterns of the arterial walls over time. Image analysis was performed with validated “eTrack” software. The software traces the wave-forms of the leading edges of anterior wall intima-lumen and posterior wall lumen-intima interfaces. If the contours of both walls are identified for at least 2 heartbeats, the software can calculate lumen diameter parameters and heart rates. Based on this information, other outcome parameters (e.g., DC) can be derived. The change in diameter during the heart cycle, or distension (ΔD), was estimated and DC was calculated as follows:21
Where: DC is distensibility coefficient, ΔD is distension, D is diastolic diameter, and ΔP is pulse pressure (blood pressure was determined just before the ultrasound study).
Left and right carotid DCs were averaged. If M-mode data for one site were missing, we used available data of the other site only.
Ankle Brachial IndexSystolic blood pressure was measured in a supine position after a 5-minute rest in the brachial artery of the right arm and the posterior tibial and dorsalis pedis arteries of both legs, using a continuous Doppler device. Right and left ABI were calculated as the ratio of the highest leg pressure to the brachial pressure, and the lowest of the 2 ABI ratios were categorized as low (< 0.9), normal (0.9–1.3), or high (> 1.3) for analysis.16
Other VariablesExaminations were performed by a team of trained nurses and interviewers. A precision scale of easy calibration was used for weight and height measurement with participants in underwear and barefoot; body mass index was determined as weight divided by squared height (kg/m2). Blood pressure was measured with a periodically calibrated sphygmomanometer (OMRON 711). A cuff appropriate to the upper arm size was selected for each participant. Measurements were performed in a seated position after a 5-min rest. Two measurements were taken and the lower value was recorded for the study.
Standardized questionnaires were used to collect sociodemographic and lifestyle variables, and the previous history and treatments for diabetes, hypertension, and hypercholesterolemia. Current smoking was defined as actively smoking within the preceding year.
Blood was withdrawn after 10h to 14hours of fasting. Total cholesterol, high-density lipoprotein cholesterol and triglycerides concentrations were determined by direct methodology (Roche Diagnostics; Basel, Switzerland).
Statistical AnalysisContinuous variables were summarized as mean (standard deviation) or median [interquartile range] when their distribution departed from normal, and categorical variables as proportions.
To estimate the association between the different genetic variants and subclinical atherosclerosis measurements, we used age- and sex-adjusted mixed general linear models and logistic regression, considering the survey as a random variable.
The ALOX5AP haplotype B was phased using the genotypes of the 4 SNPs defining the haplotype and the presence of the AAAG alleles in the SNPs rs10507391, rs17216473, rs9315050, rs17222842, respectively. The phasing was done using the haplo.em function from the haplo.stats package,22 obtaining the probability of having 0, 1, or 2 copies of risk haplotype for each sample individual. This probability was added to the genetic risk score, as with the 8 SNPs. Statistical analysis was done with the R software (version 3.0.1).23 To take into account multiple comparisons, a Bonferroni-corrected P-value <.006 (0.05/9 independent genetic variants = .006) was established to define a difference as statistically significant.
Systematic Review and Meta-analysisLiterature ReviewWe followed the recommendations of the PRISMA declaration to improve the publication of systematic reviews and meta-analysis.24 An internal review protocol was defined, basically a comprehensive search of the PubMed database from its inception through July 2013 to identify studies that evaluated the relationship between the genetic variants of interest and subclinical atherosclerosis. We queried the following search terms: (“subclinical atherosclerosis” OR “carotid” OR “thickness” OR “stiffness” OR “plaque” OR “ankle-brachial index”) and for each genetic variant, we further added (“rs id” OR “gene name”). No language restrictions were defined a priori.
The articles identified by this search were manually screened by 2 independent reviewers (MZ and RE), first on the basis of the title, then the abstract, and finally the complete manuscript, to assess their appropriateness for inclusion in the meta-analysis. References cited in these articles were also reviewed to identify relevant citations not identified by the initial search.
Data ExtractionTwo investigators (MZ and RE) independently extracted data: study design; outcomes assessed; cohort characteristics; genotype(s), allele frequencies and genetic model used in the analysis; multivariate adjustment; and the estimates of associations. Disagreements were resolved through consensus.
Statistical AnalysisStatistical analyses for the meta-analysis were performed using the meta.DSL function from the rmeta R package.25 We calculated the overall linear regression coefficients, 95% confidence intervals, and 2-sided P-values under random-effects models (DerSimonian and Laird).26 We tested for heterogeneity of effects between studies by computing the I2 statistic.
When manuscripts described more than one study or population, individual study results were considered for the meta-analysis. Conversely, if a study had been included in more than one manuscript, only the results shown in the manuscript with the highest sample size were considered. Funnel plot was used methods for assessing the existence of publication bias. Meta-regression analysis were planned to explore potential causes of heterogeneity including study sample size, male/female ratio, mean age, and mean IMT of the population.
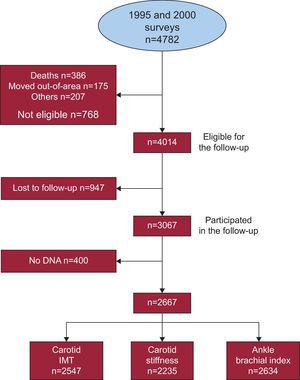
RESULTSOf the 4782 individuals initially included in the 2 surveys, 4014 were eligible for follow-up, 3067 (76.4%) attended the re-examination, and 2667 (66.4%) had available DNA samples (Figure). Allele frequency, genotype frequency, genotype missingness, and Hardy-Weinberg equilibrium P-value are shown in Table 1. Observed allele frequency was consistent with that previously reported in HapMap for the Caucasian population, and genotype frequencies were in accordance with the Hardy-Weinberg equilibrium. Genotype missingness was lower than 5% for all the SNPs considered in these analyses.

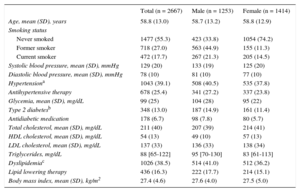
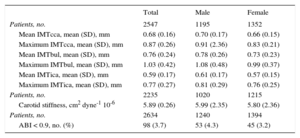
The main sociodemographic characteristics and cCVRF profile of the study participants are shown in Table 2. The characteristics of subclinical atherosclerosis measurements observed in the sample are presented in Table 3. In general, atherosclerotic burden was higher in men than in women.
Sociodemographic and Main Clinical Characteristics of the Participants in This Study in the Whole Sample and Stratified by Sex
| Total (n = 2667) | Male (n = 1253) | Female (n = 1414) | |
|---|---|---|---|
| Age, mean (SD), years | 58.8 (13.0) | 58.7 (13.2) | 58.8 (12.9) |
| Smoking status | |||
| Never smoked | 1477 (55.3) | 423 (33.8) | 1054 (74.2) |
| Former smoker | 718 (27.0) | 563 (44.9) | 155 (11.3) |
| Current smoker | 472 (17.7) | 267 (21.3) | 205 (14.5) |
| Systolic blood pressure, mean (SD), mmHg | 129 (20) | 133 (19) | 125 (20) |
| Diastolic blood pressure, mean (SD), mmHg | 78 (10) | 81 (10) | 77 (10) |
| Hypertensiona | 1043 (39.1) | 508 (40.5) | 535 (37.8) |
| Antihypertensive therapy | 678 (25.4) | 341 (27.2) | 337 (23.8) |
| Glycemia, mean (SD), mg/dL | 99 (25) | 104 (28) | 95 (22) |
| Type 2 diabetesb | 348 (13.0) | 187 (14.9) | 161 (11.4) |
| Antidiabetic medication | 178 (6.7) | 98 (7.8) | 80 (5.7) |
| Total cholesterol, mean (SD), mg/dL | 211 (40) | 207 (39) | 214 (41) |
| HDL cholesterol, mean (SD), mg/dL | 54 (13) | 49 (10) | 57 (13) |
| LDL cholesterol, mean (SD), mg/dL | 137 (33) | 136 (33) | 138 (34) |
| Triglycerides, mg/dL | 88 [65-122] | 95 [70-130] | 83 [61-113] |
| Dyslipidemiac | 1026 (38.5) | 514 (41.0) | 512 (36.2) |
| Lipid lowering therapy | 436 (16.3) | 222 (17.7) | 214 (15.1) |
| Body mass index, mean (SD), kg/m2 | 27.4 (4.6) | 27.6 (4.0) | 27.5 (5.0) |
HDL, high-density lipoprotein; IQR, Interquartile range; LDL, low-density lipoprotein; SD, standard deviation.
Data are expressed as No. (%), standard (deviation) or median [interquartile range].
Mean and Standard Deviation of the Carotid Measurements Studied and Proportion of Individuals With Pathological Ankle-brachial Index, in the Whole Sample and Stratified by Sex
| Total | Male | Female | |
|---|---|---|---|
| Patients, no. | 2547 | 1195 | 1352 |
| Mean IMTcca, mean (SD), mm | 0.68 (0.16) | 0.70 (0.17) | 0.66 (0.15) |
| Maximum IMTcca, mean (SD), mm | 0.87 (0.26) | 0.91 (2.36) | 0.83 (0.21) |
| Mean IMTbul, mean (SD), mm | 0.76 (0.24) | 0.78 (0.26) | 0.73 (0.23) |
| Maximum IMTbul, mean (SD), mm | 1.03 (0.42) | 1.08 (0.48) | 0.99 (0.37) |
| Mean IMTica, mean (SD), mm | 0.59 (0.17) | 0.61 (0.17) | 0.57 (0.15) |
| Maximum IMTica, mean (SD), mm | 0.77 (0.27) | 0.81 (0.29) | 0.76 (0.25) |
| Patients, no. | 2235 | 1020 | 1215 |
| Carotid stiffness, cm2 dyne-1 10-6 | 5.89 (0.26) | 5.99 (2.35) | 5.80 (2.36) |
| Patients, no. | 2634 | 1240 | 1394 |
| ABI < 0.9, no. (%) | 98 (3.7) | 53 (4.3) | 45 (3.2) |
ABI, ankle brachial index; IMTbul, bulb intima-media thickness; IMTcca, common carotid artery intima-media thickness; IMTica, internal carotid artery intima-media thickness; SD, standard deviation.
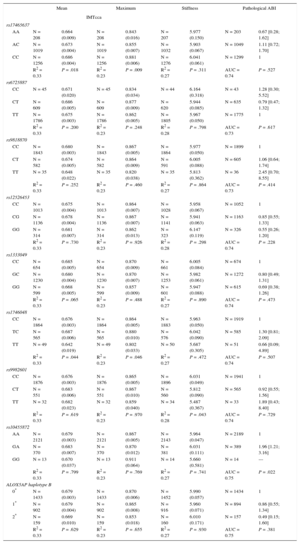
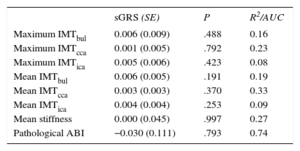
Based on the sample size, we have enough power (80%) to detect a β-coefficient > 0.040mm, 0.030mm, 0.026mm, 0.024mm, and 0.024mm for common carotid IMT, considering a nominal significance level (α = 0.05), a genetic additive model, and an allele frequency of 0.10, 0.20, 0.30, 0.40, and 0.50, respectively. Table 4 details the association between the different SNPs and the subclinical atherosclerosis measurements (mean IMTcca, maximum IMTcca, carotid stiffness, pathological ABI). The association with the remaining subclinical atherosclerosis measurements (mean IMTbul, maximum IMTbul, mean IMTica, maximum IMTica) is shown in Table 1 of the supplementary material. Only the rs10455872 (GA vs AA genotype) tended to be associated with a higher probability of presenting a pathological ABI (odds ratio = 1.96; 95% confidence interval, 1.21-3.17; P = .022). No other consistent association between any SNP and any atherosclerosis measurement was observed. The weighted genetic risk score was not associated with the different atherosclerosis indicators assessed in this study (Table 5).
Age- and Sex-adjusted Analysis Across Genotype Groups
| Mean | Maximum | Stiffness | Pathological ABI | |||||
|---|---|---|---|---|---|---|---|---|
| IMTcca | ||||||||
| rs17465637 | ||||||||
| AA | N = 208 | 0.664 (0.009) | N = 208 | 0.843 (0.016) | N = 207 | 5.977 (0.150) | N = 203 | 0.67 [0.28; 1.62] |
| AC | N = 1019 | 0.673 (0.004) | N = 1019 | 0.855 (0.007) | N = 1032 | 5.903 (0.067) | N = 1049 | 1.11 [0.72; 1.70] |
| CC | N = 1256 | 0.686 (0.004) | N = 1256 | 0.881 (0.006) | N = 1276 | 6.041 (0.061) | N = 1299 | 1 |
| R2 = 0.33 | P = .018 | R2 = 0.23 | P = .009 | R2 = 0.27 | P = .311 | AUC = 0.74 | P = .527 | |
| rs6725887 | ||||||||
| CC | N = 45 | 0.671 (0.020) | N = 45 | 0.834 (0.034) | N = 44 | 6.164 (0.318) | N = 43 | 1.28 [0.30; 5.52] |
| CT | N = 609 | 0.686 (0.005) | N = 609 | 0.877 (0.009) | N = 620 | 5.944 (0.085) | N = 635 | 0.79 [0.47; 1.32] |
| TT | N = 1786 | 0.675 (0.003) | N = 1786 | 0.862 (0.005) | N = 1805 | 5.967 (0.050) | N = 1775 | 1 |
| R2 = 0.33 | P = .200 | R2 = 0.23 | P = .248 | R2 = 0.28 | P = .798 | AUC = 0.73 | P = .617 | |
| rs9818870 | ||||||||
| CC | N = 1843 | 0.680 (0.003) | N = 1843 | 0.867 (0.005) | N = 1864 | 5.977 (0.050) | N = 1899 | 1 |
| CT | N = 582 | 0.674 (0.005) | N = 582 | 0.864 (0.009) | N = 591 | 6.005 (0.088) | N = 605 | 1.06 [0.64; 1.74] |
| TT | N = 35 | 0.648 (0.022) | N = 35 | 0.820 (0.038) | N = 35 | 5.813 (0.362) | N = 36 | 2.45 [0.70; 8.55] |
| R2 = 0.33 | P = .252 | R2 = 0.23 | P = .460 | R2 = 0.27 | P = .864 | AUC = 0.73 | P = .414 | |
| rs12526453 | ||||||||
| CC | N = 1013 | 0.675 (0.004) | N = 1013 | 0.864 (0.007) | N = 1028 | 5.958 (0.067) | N = 1052 | 1 |
| CG | N = 1136 | 0.678 (0.004) | N = 1136 | 0.867 (0.007) | N = 1141 | 5.941 (0.063) | N = 1163 | 0.85 [0.55; 1.33] |
| GG | N = 314 | 0.681 (0.007) | N = 314 | 0.862 (0.013) | N = 323 | 6.147 (0.119) | N = 326 | 0.55 [0.26; 1.20] |
| R2 = 0.33 | P = .730 | R2 = 0.23 | P = .926 | R2 = 0.28 | P = .298 | AUC = 0.74 | P = .228 | |
| rs1333049 | ||||||||
| CC | N = 654 | 0.685 (0.005) | N = 654 | 0.870 (0.009) | N = 661 | 6.005 (0.084) | N = 674 | 1 |
| GC | N = 1230 | 0.680 (0.004) | N = 1230 | 0.870 (0.007) | N = 1253 | 5.982 (0.061) | N = 1272 | 0.80 [0.49; 1.31] |
| GG | N = 599 | 0.668 (0.005) | N = 599 | 0.857 (0.009) | N = 601 | 5.947 (0.088) | N = 615 | 0.69 [0.38; 1.26] |
| R2 = 0.33 | P = .065 | R2 = 0.23 | P = .488 | R2 = 0.27 | P = .890 | AUC = 0.74 | P = .473 | |
| rs1746048 | ||||||||
| CC | N = 1864 | 0.676 (0.003) | N = 1864 | 0.864 (0.005) | N = 1883 | 5.963 (0.050) | N = 1919 | 1 |
| TC | N = 565 | 0.687 (0.006) | N = 565 | 0.880 (0.010) | N = 576 | 6.042 (0.090) | N = 585 | 1.30 [0.81; 2.09] |
| TT | N = 49 | 0.642 (0.019) | N = 49 | 0.802 (0.033) | N = 50 | 5.687 (0.305) | N = 51 | 0.66 [0.09; 4.89] |
| R2 = 0.33 | P = .044 | R2 = 0.23 | P = .046 | R2 = 0.27 | P = .472 | AUC = 0.74 | P = .507 | |
| rs9982601 | ||||||||
| CC | N = 1876 | 0.676 (0.003) | N = 1876 | 0.865 (0.005) | N = 1896 | 6.031 (0.049) | N = 1941 | 1 |
| CT | N = 551 | 0.683 (0.006) | N = 551 | 0.867 (0.010) | N = 560 | 5.812 (0.090) | N = 565 | 0.92 [0.55; 1.56] |
| TT | N = 32 | 0.682 (0.023) | N = 32 | 0.859 (0.040) | N = 34 | 5.487 (0.367) | N = 33 | 1.89 [0.43; 8.40] |
| R2 = 0.33 | P = .619 | R2 = 0.23 | P = .970 | R2 = 0.28 | P = .043 | AUC = 0.74 | P = .729 | |
| rs10455872 | ||||||||
| AA | N = 2121 | 0.679 (0.003) | N = 2121 | 0.867 (0.005) | N = 2143 | 5.964 (0.047) | N = 2189 | 1 |
| GA | N = 370 | 0.683 (0.007) | N = 370 | 0.870 (0.012) | N = 381 | 6.031 (0.111) | N = 389 | 1.96 [1.21; 3.16] |
| GG | N = 13 | 0.670 (0.037) | N = 13 | 0.911 (0.064) | N = 14 | 5.660 (0.581) | N = 14 | --- |
| R2 = 0.33 | P = .799 | R2 = 0.23 | P = .769 | R2 = 0.27 | P = .741 | AUC = 0.75 | P = .022 | |
| ALOX5AP haplotype B | ||||||||
| 0* | N = 1433 | 0.679 (0.003) | N = 1433 | 0.870 (0.006) | N = 1452 | 5.990 (0.057) | N = 1434 | 1 |
| 1* | N = 902 | 0.679 (0.004) | N = 902 | 0.865 (0.008) | N = 916 | 5.960 (0.071) | N = 894 | 0.86 [0.55; 1.34] |
| 2* | N = 159 | 0.669 (0.010) | N = 159 | 0.853 (0.018) | N = 160 | 6.010 (0.171) | N = 157 | 0.49 [0.15; 1.60] |
| R2 = 0.33 | P = .629 | R2 = 0.23 | P = .655 | R2 = 0.27 | P = .930 | AUC = 0.75 | P = .381 | |
ABI, ankle-brachial index; AUC, area under the curve; IMTcca, common carotid artery intima-media thickness.
Mean and standard error of the mean and maximum common carotid intima media thickness and carotid stiffness; odds ratio and 95% confidence interval of individuals with pathological ankle-brachial index. The variability (R2) or discriminative capacity (area under the curve) explained with each model is also shown.
Age- and Sex-adjusted Regression Coefficients for the Association Between the Genetic Risk Score (Per 1 Standard Deviation) and the Different Subclinical Atherosclerotic Measurements
| sGRS (SE) | P | R2/AUC | |
|---|---|---|---|
| Maximum IMTbul | 0.006 (0.009) | .488 | 0.16 |
| Maximum IMTcca | 0.001 (0.005) | .792 | 0.23 |
| Maximum IMTica | 0.005 (0.006) | .423 | 0.08 |
| Mean IMTbul | 0.006 (0.005) | .191 | 0.19 |
| Mean IMTcca | 0.003 (0.003) | .370 | 0.33 |
| Mean IMTica | 0.004 (0.004) | .253 | 0.09 |
| Mean stiffness | 0.000 (0.045) | .997 | 0.27 |
| Pathological ABI | −0.030 (0.111) | .793 | 0.74 |
ABI, ankle brachial index; AUC, area under the curve; IMTbul, carotid bulb intima-media thickness; IMTcca, common carotid artery intima-media thickness; IMTica, internal carotid artery intima-media thickness; SE, standard error; sGRS, standardized genetic risk score.
Linear coefficients for carotid measurements (standard error; P-value and variability explained by the model [R2]) and logistic coefficient (standard error; P-value and area under the ROC curve –AUC- of the model) for pathologic ankle brachial index.
The method to assess carotid or arterial stiffness was very heterogeneous between studies and the number of studies assessing this phenotype was limited; therefore, we did not consider this atherosclerosis marker for the meta-analysis. Murabito et al recently published a meta-analysis of ABI studies, including more than 60 000 participants.27 Consequently, we limited our meta-analysis to IMTcca.
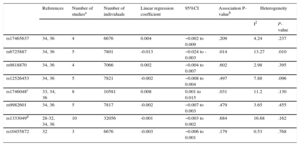
The process used to select the studies included in the meta-analysis is summarized in Table 2 of the supplementary material. We finally included 9 manuscripts,28–36 and the number of participants included in the meta-analysis ranged from 6676 (rs17465637 and rs10455872) to 32056 (rs1333049). The results reported in the studies included in the meta-analysis are shown in Table 3 of the supplementary material. The results of the meta-analysis indicated a negative association between the rs6725887 risk allele (C) and carotid IMT and a positive association between the rs1746048 risk allele (C) and carotid IMT (Table 6). There was heterogeneity between studies assessing the association between rs6725887 and carotid IMT (P = .010) (Table 6). In the meta-regression analyses we identified that the population mean IMT explained this heterogeneity: an association was present in those populations with higher mean IMT, but was not observed in those with lower IMT (Figure of the supplementary material). No associations between the rest of the selected genetic variants and IMTcca were observed (Table 6). We had 80% power to detect a β-coefficient ranging from > 0.007mm for rs1333049 to > 0.027mm for rs10455872. The funnel plots did not suggest the presence of publication bias.
Results of the Meta-analysis of the Association Between Genetic Variants of Interest and Common Carotid Artery Intima Media Thickness
| References | Number of studiesa | Number of individuals | Linear regression coefficient | 95%CI | Association P-valueb | Heterogeneity | ||
|---|---|---|---|---|---|---|---|---|
| I2 | P-value | |||||||
| rs17465637 | 34, 36 | 4 | 6676 | 0.004 | −0.002 to 0.009 | .209 | 4.24 | .237 |
| rs6725887 | 34, 36 | 5 | 7801 | -0.013 | −0.024 to -0.003 | .014 | 13.27 | .010 |
| rs9818870 | 34, 36 | 4 | 7066 | 0.002 | −0.004 to 0.007 | .602 | 2.98 | .395 |
| rs12526453 | 34, 36 | 5 | 7821 | -0.002 | −0.008 to 0.004 | .497 | 7.88 | .096 |
| rs1746048c | 33, 34, 36 | 8 | 10581 | 0.008 | 0.001 to 0.015 | .031 | 11.2 | .130 |
| rs9982601 | 34, 36 | 5 | 7817 | -0.002 | −0.007 to 0.003 | .479 | 3.65 | .455 |
| rs1333049d | 28-32, 34, 36 | 10 | 32056 | -0.001 | −0.003 to 0.002 | .684 | 16.68 | .162 |
| rs10455872 | 32 | 3 | 6676 | -0.003 | −0.006 to 0.001 | .179 | 0.53 | .768 |
95%CI: 95% confidence interval.
In this study we report the lack of association between 9 genetic variants associated with CAD, but not with cCVRFs, and 3 subclinical atherosclerosis measurements (carotid IMT, carotid stiffness, and ABI) in a population-based survey. This result was observed whether the variants were analyzed individually or as a weighted genetic risk score. Moreover, we have summarized all the available information in different meta-analyses and observed that only the rs1746048 (CXCL12) risk allele was directly associated with carotid IMT, whereas the rs6725887 (WDR12) risk allele was inversely associated with carotid IMT (opposite direction than expected).
Our findings extend the results of 3 recent studies having similar aims. Conde et al35 used data from 3 European community-based studies to assess the association between 12 genetic variants (7 of them included in our study, which added the LPA SNP and the ALOX5AP HapB) and mean common carotid artery IMT; none of the individual variants was associated with the outcome of interest. Hernesniemi et al36 analyzed the association between a genetic risk score, based on 24 SNPs identified in GWAS as associated with CAD (7 of them included in our study), and carotid IMT and carotid elasticity in 2 Finnish populations and an American population. They found no association with carotid IMT measured at 2 different times (2001 and 2007) or with the progression of the thickness in this 6-year period. They also analyzed the association of the individual SNPs with the subclinical atherosclerosis measurements; although 2 SNPs tended to associate with carotid IMT (rs4977574) or carotid elasticity (rs4773144), these findings could not be replicated.36 Finally, Zhang et al28 selected 10 SNPs associated with CAD (only rs1333049 in common with our study) and analyzed their association with 4 subclinical atherosclerosis measurements (IMTcca and MTica, presence of carotid plaque, and pathologic ABI) in 5 community-based surveys. They found that the rs780094 (GCKR) was associated with carotid plaque in the American Indian population but not in European American, African American, or Mexican American populations. No other associations were reported between the rest of the SNPs and the other intermediate phenotype of interest.28
The results of the meta-analysis support the lack of association between most of these genetic variants and subclinical atherosclerosis. These results have several possible explanations.
First, the mechanisms explaining the association between these 9 genetic variants and CAD are not related to artery remodeling, sclerosis, or distal flow limitation, and probably are not manifested in the arterial wall and reflected by changes in carotid IMT, stiffness, or ABI. Other subclinical atherosclerosis markers, such as presence of plaque, could be more sensitive to detect such progression; some studies have demonstrated the important predictive role of the presence and extent of atherosclerotic plaques by computed tomography as a potential substrate for coronary events.37 A more specific explanation may be related to the plaque stability; some genetic variants could predispose to the development of stable atherosclerostic plaques, whereas others could predispose to plaque instability with a subsequent higher risk of plaque rupture, thrombosis, and acute myocardial infarction. A recent study showed that specific -and different- genetic variants promote the development of coronary atherosclerosis (in gene ADAMTS7), but others are associated with acute events, such as myocardial infarction (in gene ABO).38 Supporting this argument, we observed that only the rs1746048 risk allele in the CXCL12 gene was associated with carotid IMT in the expected direction. The CXCL12 protein has been associated with plaque stabilization39 that could facilitate arterial remodeling and can be detected by a thickening of the artery wall. On the other hand, the rs6725887 risk allele in the WDR12 gene is associated with higher risk of CAD but with lower carotid IMT. The WDR12 gene encodes a protein involved in a variety of cellular processes, including cell cycle progression and cell proliferation. This risk allele could inhibit smooth muscle cell proliferation, compromising the stability of the plaque and increasing the risk of acute events without inducing arterial thickening.
Another possible explanation could be related to the different mechanisms and progression of atherosclerosis in different arterial territories. Bis et al40 identified 3 genetic variants associated with carotid IMT and 2 associated with carotid plaque in a meta-analysis of 9 populations participating in the CHARGE consortium. The only variant associated with carotid atherosclerosis in this meta-analysis and also with CAD in the CARDIoGRAM consortium was rs1878406 (EDNRA). On the other hand, there is only 1 GWAS aimed at identifying genetic variants associated with ABI, which included 21 population-based studies.27 Only 1 significant genome-wide association with ABI was identified, on chromosome 9p21 (rs10757269, in LD with the rs1333049, R2 = 0.87). Although this locus is also associated with CAD, the rest of the variants associated with CAD were not associated with ABI.
Our study has potential limitations. First, our sample size was modest and we cannot rule out that the magnitude of the association is too small for our statistical power; nonetheless, our meta-analysis of all the available information was designed to increase the statistical power of the study. Second, only those participants attending the follow-up visit could be included in this study and we cannot discard the possibility of a selection bias that could be affecting our results, probably towards de null hypothesis. Third, we did not include the genetic variants associated with CAD independently of cCVRFs that were more recently identified by the CARDIoGRAM-C4D consortium. Among the strengths, we included several subclinical measurements obtained with standardized methods in our population and analyzed the individual and joint effect of the selected genetic variants.
CONCLUSIONSOur results suggest that the analyzed genetic variants associated with CAD independently of cCVRFs influence CAD risk through mechanisms independent of subclinical atherosclerosis measured by carotid IMT, carotid stiffness, or ABI, with the exception of rs1746048 (CXCL12) and rs6725887 (WDR12). These results generate the hypotheses that the CXCL12 variant appears to influence CAD risk through arterial remodeling and thickening, whereas the WDR12 risk variant could be related to higher plaque vulnerability. Functional studies are required to confirm these hypotheses.
FUNDINGThis research was supported by funding from the Government of Spain through the Ministerio de Ciencia e Innovación, Instituto de Salud Carlos III, European Regional Development Fund [Red HERACLES RD12/0042]; Fondo de Investigación Sanitaria [FIS PI11/01801; PS09/00456]; CIBERESP; Fundació La Marató de TV3 [081632]; and Agència de Gestió d’Ajuts Universitaris i de Recerca [2009 SGR 1195].
CONFLICTS OF INTERESTNone declared.
The authors are grateful to Susanna Tello, Marta Cabañero and Leny Franco, for project and data management. We also appreciate the revision of the English text by Elaine Lilly of Writer's First Aid.