The aims of the study were: to describe the distribution of physical activity practice; to determine the prevalence and trends of sedentary lifestyle in the population aged 35 to 74 years of Girona in the 1995-2005 period; and to identify the variables associated to sedentary lifestyle at the population level.
MethodsData from three independent population-based cross-sectional studies undertaken in 1995 (n=1419), 2000 (n=2499), and 2005 (n=5628) were analyzed. Physical activity was measured using the Minnesota Leisure Time Physical Activity questionnaire. Sedentary lifestyle was defined as an energy expenditure in moderate physical activity (4-5.5 METs) <675 kcal/week or <420 kcal/week in intense physical activity (≥6 METs). Logistic regression was used to determine the variables associated with sedentary lifestyle.
ResultsThe age-standardized prevalence of sedentary lifestyle was 53.8%, 39.5%, and 32.6% in 1995, 2000, and 2005 respectively. The prevalence of sedentary lifestyle has decreased especially in women older than 50 years living in the urban areas. An increase in light and moderate physical activity practice in men older than 50 years and in light physical activity practice in women older than 50 years was observed. Female gender, age, smoking and lower educational level were associated with a higher prevalence of sedentary lifestyle.
ConclusionsPrevalence of sedentary lifestyle has decreased in the 1995-2005 period in Girona, especially in women, but is still high. Health promotion programs should include physical activity practice as a key element and should take into account gender and social inequalities.
Keywords
.
INTRODUCTIONRegular physical activity (PA) practice has been associated with lower mortality and lower incidence of chronic diseases, such as breast and colon cancer, chronic obstructive pulmonary disease, type 2 diabetes, obesity, osteoporosis, some mental disorders, and cardiovascular diseases.1, 2, 3, 4, 5, 6, 7 PA practice also has been associated with a better quality of life.8 Based on the evidence, several scientific societies and the World Health Organization recommend the practice of PA as an important element for health promotion.9, 10 The American College of Sports Medicine/American Heart Association recommendations include moderate-intensity aerobic PA for a minimum of 30min on 5 days each week or high-intensity aerobic PA for a minimum of 20min on 3 days each week.10
Despite all the evidence and recommendations, the prevalence of sedentary lifestyles in the population is still high.11 Few studies have assessed PA practice and the trends of PA practice at the population level.12, 13, 14 Moreover, it is also important to identify the factors related to PA practice in the population.
The objectives of this study were: a) to describe the distribution of leisure time PA practice in the 35- to 74-year-old population of Girona (Spain); b) to determine the prevalence and trend of sedentary lifestyle in the 1995-2005 period; and, c) to identify the variables associated with a sedentary lifestyle at the population level.
METHODS DesignThree consecutive independent population-based surveys were conducted in the province of Girona, in the northeast of Spain, in 1994-1996 (1995 survey), 1999-2001 (2000 survey) and 2004-2006 (2005 survey). The main objective of these studies was to determine the prevalence of cardiovascular risk factors in the population aged 25 to 74 years (1995 and 2000 surveys) and 35 to 74 years (2005 survey).
Inclusion criteria and recruitment methodology have been described in detail elsewhere.15, 16 Briefly, in 1995 and 2000 we selected participants aged 25 to 74 years, stratified by 10-year age and sex groups. A two stage sampling method was used: 33 and 17 towns in 1995 and 2000, respectively, were randomly selected in the first stage. Half of the towns were urban (≥10 000 inhabitants) and other half were rural (<10 000 inhabitants). The second sampling stage consisted of randomly recruiting the same number of women and men participants, stratifying by 10-year age groups of the population aged 25 to 74 years from the most recent census. In 2005, a random sample of inhabitants from the city of Girona and three nearby rural towns were selected, stratifying by 5-year age groups and sex of the population aged 35 to 74 years.
Selected participants were contacted by a letter informing them of the aims of the study and the tests to be performed. The response rate in the three studies was 72.4%, 70.0% and 73.8%, respectively. Participants were contacted by telephone to confirm the date of the visit. Participants were duly informed and signed their consent to participate in the studies. The three studies were approved by the local ethics committee and the results of the examination were sent to participants.
For this study we selected those participants aged 35 to 74 years from the three surveys.
Leisure-Time Physical Activity MeasurementLeisure time physical activity (LTPA) practice was collected by using the Minnesota LTPA Questionnaire17 validated for Spanish men and women.18, 19 The questionnaire was administered by trained interviewers who spent about 10 to 20min per participant colleting detailed information about PAs during the preceding year, the number of times this activity was performed and the average duration of each activity on each occasion. Each PA has an intensity code, based on the ratio between the metabolic rate during PA practice and the basal metabolic rate (MET).20 We assumed that 1 MET approximately corresponds to 1 kcal/min of energy expenditure. Therefore, we can calculate the total energy expenditure in leisure time of PA (EEPAtotal) in kilocalories per week. Moreover, based on the PA intensity code, we could quantify the energy expenditure in physical activity (EEPA) according to the activity's classification as intense, moderate or light intensity as follows:
• Light PA intensity is below 4 METs, such as walking (EEPAlight).
• Moderate PA intensity is 4–5.5 METs, such as brisk walking (EEPAmoderate).
• Intense PA intensity is greater than or equal to 6 METs, such as jogging (EEPAintense).
Thus, for each particular subject:

Based on recommendations from the American Heart Association,10 we considered as sedentary those participants who do not meet the recommendations of moderate-intensity aerobic PA practice for a minimum of 30min on 5 days each week (defined as EEPAmoderate<675kcal/week) or high-intensity aerobic PA practice for a minimum of 20min on 3 days each week (defined as EEPAintense<420kcal/week).
Other Variables: Sociodemographics, Cardiovascular Risk Factors, AnthropometricsStandardized questionnaires were used to gather information regarding sociodemographic, cardiovascular risk and anthropometrics variables.
Smoking was grouped into three categories: never smokers, current smokers (including former smokers <1 year) and former smokers (including only those who had quit smoking more than 1 year before inclusion). We defined as smokers those participants who reported smoking 1 or more cigarettes/day. A questionnaire to obtain detailed information on alcohol consumption during the preceding week defined three categories according to the grams of alcohol consumed per day: 0g/day, 1 to 20g/day and >20g/day. The prevalence of cardiovascular risk factors such as hypertension, dyslipidemia, and diabetes mellitus was based on self-reported information on treatment and the results of physical examination and laboratory determinations using standardized definitions. Hypertension was considered when systolic blood pressure was ≥140mmHg or diastolic blood pressure was ≥90mmHg or the participant was treated with antihypertensive drugs; dyslipidemia was defined by the presence of low-density lipoprotein cholesterol ≥160mg/dL or treatment with lipid-lowering drugs; diabetes was defined by the presence of fasting glycaemia ≥126mg/dL or hypoglycaemic treatment. Body mass index (BMI) was determined as weight (in kilograms) divided by squared height (in meters). Obesity was defined as a BMI ≥30kg/m2. Self-reported educational level was used as an indicator of socioeconomic position. Place of residence was divided into two categories, rural (<10 000 inhabitants) and urban (≥10 000 inhabitants).
Satistical AnalysesPrevalence of sedentary lifestyle and 95% confidence interval (95%CI) was calculated. Prevalence was standardized by the direct method using the structure of the European population.
To describe the distribution of PA practice we calculated the percentiles 5, 25, 50, 75, and 95 for the following variables: EEPAtotal, EEPAlight, EEPAmoderate, and EEPAintense, for each age group, gender, and cross-sectional study. The R program (R Project for statistical computing) was subsequently used to smooth the curve for each age group using the Kernel method.
Logistic regression models were used to determine the variables associated with sedentary lifestyle. Trends in the prevalence were analyzed introducing the period variable and two interaction terms, period*gender and period*gender*age, to the logistic regression model. All the analyses were also stratified by place of residence (rural or urban). All P-values <.05 were considered as statistically significant.
RESULTSWe included 9546 participants aged 35 to 74 years: 1419 from the 1995 survey, 2499 from 2000 and 5628 from the 2005 survey. The characteristics of the participants in each survey are presented in Table 1.
Table 1. Characteristics of the Participants in the Three Surveys.
| 1995 n=1419 | 2000 n=2499 | 2005 n=5628 | P value for linear trend | |
| Gender, % | .410 | |||
| Male | 47.6 | 48.9 | 47.1 | |
| Female | 52.4 | 51.1 | 52.9 | |
| Age, years | 54.5±11.4 | 53.7±11.0 | 54.5±10.9 | .189 |
| Age groups, % | .527 | |||
| 35-44 | 24.6 | 24.7 | 22.8 | |
| 45-54 | 25.0 | 27.9 | 27.6 | |
| 55-64 | 26.3 | 26.1 | 27.0 | |
| 65-74 | 24.1 | 21.3 | 22.6 | |
| Educational level, % | <.001 | |||
| Without studies | 5.0 | 5.8 | 2.5 | |
| Elementary | 74.9 | 65.1 | 44.0 | |
| Secondary | 15.2 | 20.0 | 29.7 | |
| University degree | 4.9 | 9.1 | 23.7 | |
| Smoking, % | ||||
| Never smoker | 59.9 | 57.0 | 49.9 | <.001 |
| Current smoker | 22.2 | 23.4 | 24.3 | |
| Former smoker | 17.8 | 19.6 | 25.8 | |
| Alcohol consumption, % | .540 | |||
| 0 g/day | 40.6 | 9.5 | 25.1 | |
| ≤20 g/day | 36.7 | 67.9 | 59.2 | |
| >20 g/day | 22.7 | 22.6 | 15.2 | |
| BMI, kg/m2 | 26.8±4.1 | 27.8±4.3 | 27.3±4.5 | .505 |
| Risk factors, % | ||||
| Hypertension | 42.4 | 47.0 | 35.4 | <.001 |
| Dyslipidemia | 45.7 | 44.5 | 33.6 | <.001 |
| Diabetes mellitus | 9.4 | 11.2 | 9.7 | .270 |
| Ischemic heart disease | 2.0 | 1.6 | 1.9 | .745 |
| Residence, % | ||||
| Urban | 46.4 | 55.1 | 60.4 | <.001 |
| EEPA, kcal/week | ||||
| Total | 1309 [623-2408] | 1402 [663-2492] | 1617 [839-2808] | <.001 |
| Light | 476 [98-1113] | 196 [0-749] | 364 [33-815] | .001 |
| Moderate | 63 [0-469] | 252 [1-793] | 350 [42-921] | <.001 |
| Intense | 224 [63-539] | 280 [105-785] | 396 [126-995] | <.001 |
| Sedentary lifestyle, % (95%CI) | ||||
| Observed prevalence | 54.7 (52.1-57.3) | 40.5 (38.5-42.4) | 33.6 (32.4-34.8) | <.001 |
| Standardized prevalence | 53.8 (51.1-56.4) | 39.5 (37.6-41.4) | 32.6 (31.4-33.9) | <.001 |
95%CI, 95% confidence interval; BMI, body mass index; EEPA, energy expenditure in physical activity.
Unless otherwise indicated, data are expressed as mean±standard deviation or median [interquartile range].
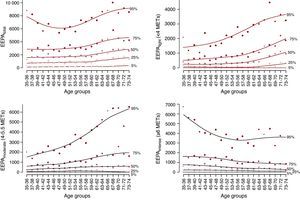
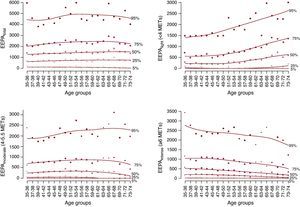
In Figure 1, Figure 2 we show the distribution of LTPA practice (EEPAtotal, EEPAlight, EEPAmoderate, EEPAintense) stratified by gender and across age groups in the 2005 survey. We observed an increase in EEPAtotal in men older than 50 years that was explained by an increase in EEPAlight and EEPAmoderate. This increase in light and moderate intensity PA practice in older participants was also observed in the two previous surveys (Supplementary material, Figs. 1 and 2). Nevertheless, in women, PA practice was stable across ages, although a slight increase in light PA practice was observed in those older than 50 years in the 2000 and 2005 surveys (Figure 2 and Supplementary material Figs. 1-2).

Figure 1. Distribution in percentiles of total, light, moderate and intense leisure time physical activity practice (kilocalories/week) in men by age groups in the 2005 survey. EEPA, energy expenditure in physical activity.

Figure 2. Distribution in percentiles of total, light, moderate, and intense leisure time physical activity practice (kcal/week) in women by age groups in the 2005 survey. EEPA, energy expenditure in physical activity.
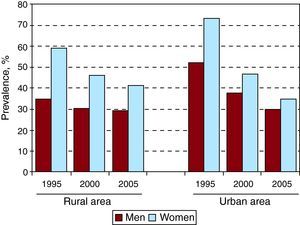
The age-standardized prevalence of sedentary lifestyle in each cross-sectional study (1995, 2000, and 2005) was 53.8%, 39.5%, and 32.6%, respectively (Table 1). The percentage of sedentary participants in each cross-sectional study stratifying by gender, age groups and both, gender and age groups, is presented in Table 2. The prevalence of sedentary lifestyle was higher in women than in men and decreased from 1995 to 2005, especially in women. The highest prevalence of sedentary lifestyle was observed in the group of participants aged 65 to 74, especially in women. When the analysis was stratified by place of residence we also observed a significant decrease in the prevalence of sedentary lifestyle, except in males of the rural areas. This decrease was especially important in women of the urban areas going from 73.0%, the highest prevalence in 1995, to 34.9% in 2005, lower than women living in the rural area at the same survey (Figure 3 and Supplementary material Tables 1 and 2). To assess if the city of Girona was representative of the other urban towns of the province of Girona we performed a sensitivity analysis. We compared those participants living in the city of Girona with those living in other urban towns and we observed similar prevalence and trends of sedentary lifestyle in the 1995 and 2000 surveys (Supplementary material Table 3).
Table 2. Gender- and Age- and Gender-Age-Stratified Sedentary Lifestyle Prevalence and the 95% Confidence Interval in Each of the Three Surveys.
| 1995 n=1419 | 2000 n=2499 | 2005 n=5628 | P value linear trend | |
| Gender, % (95%CI) | ||||
| Male | 42.8 (39.0-46.5) | 34.1 (31.5-36.8) | 29.4 (27.7-31.1) | <.001 |
| Female | 65.5 (62.1-69.0) | 46.5 (43.8-49.3) | 37.4 (35.6-39.1) | <.001 |
| P value | <.001 | <.001 | <.001 | |
| Age groups, % (95%CI) | ||||
| 35-44 | 46.7 (41.5-51.0) | 35.2 (31.4-38.9) | 28.3 (25.8-30.7) | <.001 |
| 45-54 | 55.2 (50.0-60.4) | 37.9 (34.3-41.5) | 31.4 (29.1-33.8) | <.001 |
| 55-64 | 57.1 (52.1-62.1) | 40.3 (36.5-44.0) | 35.3 (32.9-37.7) | <.001 |
| 65-74 | 59.6 (54.4-64.8) | 50.1 (45.8-54.3) | 39.6 (36.9-42.3) | <.001 |
| P value | .004 | <.001 | <.001 | |
| Men by age group, % (95%CI) | ||||
| 35-44 | 38.8 (31.4-46.2) | 31.2 (26.0-36.3) | 26.2 (22.6-29.8) | .006 |
| 45-54 | 44.8 (37.3-52.4) | 34.8 (29.6-39.9) | 29.9 (26.6-33.2) | .001 |
| 55-64 | 42.0 (34.6-49.3) | 33.0 (27.8-38.2) | 29.9 (26.6-33.2) | .004 |
| 65-74 | 45.3 (37.9-52.8) | 38.0 (32.2-43.8) | 31.1 (27.5-34.8) | .009 |
| P value | .599 | .356 | .265 | |
| Women by age group, % (95%CI) | ||||
| 35-44 | 53.8 (46.6-61.0) | 39.2 (33.7-44.7) | 30.0 (26.6-33.4) | <.001 |
| 45-54 | 64.2 (57.4-71.0) | 40.7 (35.7-45.7) | 32.8 (29.6-36.0) | <.001 |
| 55-64 | 70.4 (64.0-76.7) | 47.0 (41.7-52.4) | 40.4 (37.0-43.8) | <.001 |
| 65-74 | 74.1 (67.5-80.7) | 62.6 (56.7-68.5) | 47.7 (43.9-51.5) | <.001 |
| P value | <.001 | <.001 | <.001 | |
95%CI, 95% confidence interval.

Figure 3. Trends in the prevalence of sedentary lifestyle en men and women living in urban and rural areas in the 1995-2005 period.
The multivariate analyses to identify variables associated with sedentary lifestyle in each survey are shown in Table 3. Age and female gender were associated with a higher prevalence of sedentary lifestyle in all three surveys, but the magnitude of the association decreased over time. Urban residence was associated with a higher prevalence of sedentary lifestyle but this association disappeared in the last survey. Low educational level was associated with a higher prevalence of sedentary lifestyle and the magnitude of this association significantly increased over the period analyzed. Finally, alcohol consumption was associated with a lower prevalence of sedentary lifestyle.
Table 3. Variables Associated With Sedentary Lifestyle Prevalence in Each of the Three Surveys. Multivariate Logistic Regression Analyses.
| 1995 n=1419 | 2000 n=2499 | 2005 n=5628 | ||||
| OR (95%CI) | P | OR (95%CI) | P | OR (95%CI) | P | |
| Age groups | .040 | .199 | .001 | |||
| 35-44 | 1 (ref.) | 1 (ref.) | 1 (ref.) | |||
| 45-54 | 1.38 (0.99-1.92) | 1.09 (0.84-1.44) | 1.13 (0.95-1.35) | |||
| 55-64 | 1.38 (0.98-1.94) | 1.26 (0.94-1.70) | 1.36 (1.14-1.64) | |||
| 65-74 | 1.69 (1.18-2.43) | 1.39 (1.01-1.91) | 1.41 (1.16-1.72) | |||
| Gender | <.001 | <.001 | <.001 | |||
| Male | 1 (ref.) | 1 (ref.) | 1 (ref.) | |||
| Female | 2.17 (1.60-2.95) | 1.53 (1.21-1.94) | 1.30 (1.13-1.50) | |||
| Smoking | .048 | .275 | <.001 | |||
| Never smoker | 1 (ref.) | 1 (ref.) | 1 (ref.) | |||
| Smoker | 1.25 (0.90-1.74) | 1.23 (0.95-1.59) | 1.28 (1.09-1.50) | |||
| Former smoker | 0.77 (0.54-1.11) | 1.02 (0.78-1.34) | 0.91 (0.77-1.07) | |||
| Residence | <.001 | .008 | .327 | |||
| Urban | 1 (ref.) | 1 (ref.) | 1 (ref.) | |||
| Rural | 0.52 (0.41-0.66) | 0.76 (0.62-0.93) | 1.07 (0.94-1.22) | |||
| Educational level | .036 | .002 | <.001 | |||
| University | 1 (ref.) | 1 (ref.) | 1 (ref.) | |||
| Secondary | 0.94 (0.52-1.70) | 1.30 (0.87-1.93) | 1.31 (1.09-1.55) | |||
| Elementary | 1.25 (0.73-2.16) | 1.66 (1.16-2.38) | 1.65 (1.39-1.97) | |||
| Without studies | 2.47 (1.11-5.47) | 2.86 (1.57-5.19) | 5.10 (3.37-7.25) | |||
| Alcohol consumption | .074 | .101 | <.001 | |||
| 0 gr/day | 1 (ref.) | 1 (ref.) | 1 (ref.) | |||
| ≤20 gr/day | 0.87 (0.66-1.14) | 0.71 (0.51-0.99) | 0.67 (0.58-0.78) | |||
| >20 gr/day | 0.66 (0.46-0.94) | 0.66 (0.44-0.99) | 0.74 (0.60-0.91) | |||
95%CI, 95% confidence interval; OR, odds ratio.
In Table 4 we present the trend analysis of sedentary lifestyle prevalence from 1995 to 2005 and stratifying according to the interaction terms that were statistically significant. The prevalence of sedentary lifestyle declined in 2000 and 2005, especially due to a decrease of the prevalence in older women. The analysis stratified by place of residence showed a similar pattern (Supplementary material Tables 4 and 5), although the decrease in the prevalence of sedentary lifestyle was mainly observed in men and women living in urban areas and in women living in rural areas but not in men of the rural areas.
Table 4. Trends in the Prevalence of Sedentary Lifestyle in the Study Period Estimated by Multivariate Logistic Regression Analyses and Stratified by Gender and Age Groups.
| 1995 n=1419 | 2000 n=2499 | 2005 n=5628 | P value | |
| 1 | 0.57 (0.48-0.67) | 0.48 (0.42-0.56) | <.001 | |
| Interaction Period*Gender | <.001 | |||
| Gender | ||||
| Men | 1 | 0.70 (0.56-0.87) | 0.64 (0.52-0.78) | <.001 |
| Women | 1 | 0.50 (0.39-0.63) | 0.38 (0.31-0.47) | <.001 |
| Interaction Period*Age groups*Gender | .009 | |||
| Men | ||||
| 35-44 | 1 | 0.69 (0.44-1.08) | 0.70 (0.46-1.06) | .189 |
| 45-54 | 1 | 0.57 (0.36-0.88) | 0.58 (0.38-0.87) | .020 |
| 55-64 | 1 | 0.82 (0.52-1.29) | 0.75 (0.49-1.13) | .398 |
| 65-74 | 1 | 0.70 (0.44-1.12) | 0.55 (0.36-0.83) | .015 |
| Women | ||||
| 35-44 | 1 | 0.52 (0.33-0.83) | 0.47 (0.32-0.69) | .001 |
| 45-54 | 1 | 0.46 (0.30-0.72) | 0.37 (0.25-0.56) | <.001 |
| 55-64 | 1 | 0.57 (0.35-0.93) | 0.37 (0.25-0.55) | <.001 |
| 65-74 | 1 | 0.48 (0.28-0.82) | 0.33 (0.21-0.50) | <.001 |
Adjusted by place of residence, smoking, alcohol consumption, dyslipidemia, diabetes, hypertension and previous ischemic heart disease.
In this population-based study we observed a decrease in the prevalence of sedentary lifestyle from 1995 to 2005, especially in women living in urban areas. The prevalence of sedentary lifestyle remains high, increases with age and is higher in women, smokers, and those with low education level. The magnitude of the association between low education level and sedentary lifestyle has increased over the analyzed period. We also observed that PA practice increases from the age of 50 years but this increase mainly depends on the practice of light intensity PA.
There is no standardized definition of sedentary lifestyle21 however different scientific societies recommend, from a public health perspective, moderate-intensity aerobic PA for a minimum of 30min on 5 days each week or high-intensity aerobic PA for a minimum of 20min on 3 days each week.9, 10 We used this definition in our study although the exclusion of light intensity PA practice increases the prevalence of sedentary lifestyle especially among the population older than 50 years. At this point we should considerer that some studies have demonstrated that light PA practice, such as walking, is also associated with lower mortality and lower incidence of cardiovascular diseases and cancer, especially in elderly people.3, 22, 23 We think that a re-definition of sedentary lifestyle considering not only moderate and high intensity PA but also light intensity PA and adapting these criteria to different ages should be considered.
The comparison of our results with those of other studies is difficult because of the previously mentioned lack of standard definition of sedentary lifestyle, the different instruments used to measure PA practice and intensity, and the different socio-demographic characteristics of the populations. Only two studies have measured the prevalence of sedentary lifestyle in the Spanish population using the Minnesota LTPA questionnaire. One of them was conducted from 2000 to 2004 in the Canary Islands population aged 18 to 75 years14 and the other in Navarra from 2000 to 2005 in the population aged 35 to 84 years.24 The prevalence of sedentary lifestyle, with a similar definition to that used in this study, were 59% and 68% for men and women in the Canary Islands study, and 44% for men and 49% for women in Navarra. This prevalence are higher to those reported in our study, but apart from methodological and socio-demographic differences, the results observed in the Canary Islands could be related to the higher prevalence of obesity and diabetes in that region.
According to the 2003 National Survey of Health data, approximately 60% of the Spanish adult population declares they do not regularly undertake PA.25 In the 2002 Survey of the Health of Catalunya, 35%-40% of the adult population was declared sedentary or minimally active26 which is similar to our findings.
A European study11 reported the prevalence of sedentary lifestyle in Spain as 68.5% in men and 73.7% in women, although PA was measured with a different questionnaire, limiting the comparability between studies.
In our study, the prevalence of sedentary lifestyle had a decreasing trend especially in women. This trend is consistent with other findings in our population27, 28 and also in Finland29 and Canada.30 This is probably due to programs promoting PA practice. However a recent study performed in the Madrid region report an inverse trend with a decrease in LTPA practice and a slight decrease in sedentary lifestyle especially in women in the 1998-2005 period.31 Differences in the age range of the populations evaluated in these two studies could partially explain the differences observed in the trends. In our study, we are not including young people from 18 to 35 years and in the Meseguer's study they are not including old people from 65-74 years. In our study there was a trend to decrease the prevalence of sedentary lifestyle that was more important in older women.
On the other hand, there are few studies at population level assessing the intensity of PA practiced. Our findings indicate that in the oldest group there is an increase in light PA practice. A study conducted in Murcia (Spain)12 reported similar findings in the population aged 18 to 65 years, with a decrease in the intensity of PA practice with increased age.
When the variables associated to the sedentary lifestyle were analyzed, we observed that women are more likely to be sedentary. In addition, the prevalence of sedentary lifestyle increases as the level of studies decreases. These results agree with other national12, 13, 14, 31, 32 and international studies.11, 29, 30 At this point, it is important to mention that the magnitude of the association between gender and sedentary lifestyle is decreasing over time, whereas that for education level is increasing reflecting a widening in the gap between social classes regarding a healthy lifestyle. In a recent study, we have reported that this widening does not only affect to PA practice but also to the prevalence of smoking and obesity.33
Another relevant result of our study is that never smoking and moderate alcohol consumption is associated with a lower prevalence of sedentary lifestyle. This association may represent a pattern of healthy lifestyle choices.
Our study has some limitations. We used a questionnaire to measure PA practice and some memory bias could be present. Nevertheless, it is a validated method to determine LTPA. We do not have information related to occupational PAs; however, international recommendations are based in LTPA. We have already mentioned that there is not a standardized definition of sedentary lifestyle. An important strength of our study is its large sample size that is representative of the population, allowing us to estimate trends in PA practice during a 10-year period.
In our study we observed a dramatic change in the educational level of our population during the period analyzed with an increase in the proportion of individual with university studies. This change has also been observed and reported by the National official statistics of the global Spanish population,34 therefore we consider that it is not an artifact observed in our study. Finally, we should consider that the recruitment methodology was different in the 2005 survey compared to the two previous surveys (only the city of Girona was included as representative of the urban towns of the province and three surrounding towns as representatives of the rural area in 2005), this change could origin an artifact in the analysis of the trends. However, the prevalence and trends of sedentary lifestyle in the city of Girona were very similar to those observed in the other cities of the province in 1995 and 2000 suggesting that Girona could be considered representative of the urban population of the province.
CONCLUSIONSIn summary, the prevalence of sedentary lifestyle is decreasing, especially in women, although it is still elevated. The groups with higher prevalence of sedentary lifestyle are women, smokers, people with a lower educational level and those aged 55 to 74 years. The promotion of PA should be an important element of public health policies and should take into account social and gender equality policies.
CONFLICTS OF INTERESTNone declared.
Supplementary material.Supplementary material associated with this article can be found in the online version available at doi:10.1016/j.rec.2011.06.020.
Supplementary material.Received 15 February 2011
Accepted 6 June 2011
Corresponding author: Grupo de Epidemiología y Genética Cardiovascular, IMIM (Institut de Recerca Hospital del Mar), Dr Aiguader 88, 08003 Barcelona, Spain. relosua@IMIM.es