Information on trends in physical activity is very scarce in Mediterranean countries, which have the highest sedentariness in Europe. This study describes recent trends in leisure time physical activity (LTPA) and at work in the Madrid region.
MethodsThe data were taken from representative annual surveys of population aged 18–64 years, between 1995 and 2008, 28,084 people participated. We calculated total energy, quantified in metabolic equivalent (MET-1 h per week), spent on LTPA and on light LTPA ( <3 met moderate ltpa 3 ndash 6 and vigorous 6 MET). The annual change in LTPA was estimated by linear regression, and occupational activity by logistic regression, adjusting for age, gender and educational level.
ResultsThe total amount of LTPA in MET-1 h per week declined by 19.8% (P<.001) between 1995 and 2008; for both genders, all age groups and educational levels, except for those with the lowest level of education. The adjusted annual change in MET-1 h per week was: −0.21 (P<.001) for total LTPA; −0.1 (P<.001) for light; −0.08 (P<.001) for moderate; and −0.03 (P=.192) for vigorous. This decline is reflected by a shift to the left of the LTPA distribution in the population. Occupational physical inactivity has increased in the general population (odds ratio for annual change=1.01; 95% confidence interval, 1–1.02); specially in women, young and middle aged, and intermediate educational level.
ConclusionsThere has been a decline in LTPA, mainly in light and moderate activities, accompanied by greater occupational physical inactivity. This could have contributed to the increase in obesity in the Community of Madrid between 1995 and 2008.
Keywords
Physical activity (PA) reduces the risk of many diseases such as the cardiovascular diseases, cancer, diabetes mellitus, obesity and depression, among others.1,2,3,4 In Europe, physical inactivity causes an estimated 600000 deaths each year5 and, in the United States, between 200000 and 300000.6 To reduce this burden of disease, engaging in regular PA of at least moderate intensity is recommended.7
Despite these observations, in many countries PA does not reach the recommended levels.8,9,10 In particular, although a slight increase in leisure time physical activity (LTPA) is being observed in recent years, mainly in the so-called Anglo-Saxon countries, occupational activities are increasingly sedentary.11
Most of the available studies have estimated the trends in the proportion of individuals who engage in PA with the recommended regularity and intensity. However, very few of them have analyzed the changes in PA by evaluating energy expenditure.11 This information is important because of the marked increase in the prevalence of obesity, which may coincide with changes in the patterns of PA.12,13 Moreover, the majority of the population-based studies have been carried out in Anglo-Saxon countries and in those of northern Europe. However, there is very little information concerning the Mediterranean countries, which are precisely those in all of Europe in which leisure time sedentariness is the greatest.14
This study examines the trends in energy expenditure in LTPA, as well as those observed in the PA associated with work, in Madrid during the period between 1995 and 2008.
Methods Study Design and PopulationThe data were taken from the yearly SIVFRENT (System of Surveillance of Risk Factors of Noncommunicable Diseases), which monitors the major health-related lifestyles in a representative sample of the noninstitutionalized population between the ages of 18 and 64 years in the Madrid region. Each year, around 2000 subjects were selected among the homes in the region in which there was a standard telephone line (92% of all the homes, according to the Statistical Institute of the Community of Madrid), by means of sampling stratified according to sex, age and geographical region. The selection of the individuals and the interview were performed using CATI (Computer Assisted Telephone Interviewing) for one week each month except for the month of August. During the period between 1995 and 2008, 28084 individuals were interviewed. The methodological aspects of the system have been reported in a previous publication15 and, specifically, those related to PA have been described in another study,10 on which the present work is based and on which it is broadened.
Study VariablesThe LTPA was estimated on the basis of the frequency and duration of different PA performed over the two weeks prior to the interview: walking (light, intense pace) not including getting to work footboy walking, running, bicycling (light, intense pace), swimming (light, intense pace), tennis, pelota, squash, paddle ball, other paddle or racket sports, soccer, basketball, handball, other ball sports, skiing, martial arts, aerobics/gym-jazz/dance, weight lifting/gymnastics with apparatus and maintenance gymnastics. The questionnaire also included the option “others”, with information on activities not included in the preceding list.
On the basis of the frequency and duration of the activity session, as well as the assignment of metabolic equivalents (METs) corresponding to the baseline expenditure for each activity according to the proposal of Ainsworth et al.,16 the expenditure in MET-1 h per week was estimated by multiplying the MET for each LTPA by its duration (min) and cumulative frequency over the two weeks prior to the interview, which was divided by 60 and by 2 in order to obtain the cumulative expenditure at the rate of one hour a week. The total energy expended in LTPA in MET-1 h per week was calculated, as was that corresponding to LTPA of low (<3 MET), moderate (3–6 MET) and vigorous (>6 MET) intensity. In addition, subjects who completed the questionnaire were divided into three categories of LTPA according to their compliance with the recommendations of the American College of Sports Medicine/American Heart Association (ACSM/AHA):7 inactive, or those who engaged in no PA; active, but not complying with the recommendations of the ACSM/AHA (activity of at least moderate intensity for 150min a week or more, or of vigorous intensity for 60min a week or more); and those that did comply with the recommendations.
The usual PA in the workplace was gathered in a way similar to that employed in other surveys, such as that of Canada17 or the Spanish Health Survey (Ministry of Health and Social Policy), and the subjects were classified according to four categories: inactive (remaining seated most of the work day); active, with low-intensity PA (standing most of the time); active, with moderate-intensity PA (performing manual tasks with light loads); and active, with high-intensity PA (performing manual tasks with heavy loads).
Information was also gathered on sex, age (18–29 years, 30–44 years and 45–64 years) and level of education (primary school not completed, first cycle of secondary school completed, secondary school completed and university-educated).
Statistical AnalysisThe average annual changes in the expenditure in MET-1 h per week were estimated using linear regression models. Despite the positive asymmetry of the variable, MET-1 h per week, the means were used as indicators of the central position to facilitate the comparison with other studies. For the three categories of LTPA according to the compliance with the recommendations for LTPA (inactive individuals, active individuals who do not comply with the recommendations and active individuals who do comply with the recommendations) and for occupational PA, the annual change was calculated by means of odds ratio (OR) obtained with logistic regression. Both linear and logistic models were adjusted for sex, age and level of education, using non-automated methods for the introduction of the variables. To determine whether the trends differed from one population subgroup to another, we checked for interactions between the year of the survey and sex, age and level of education.
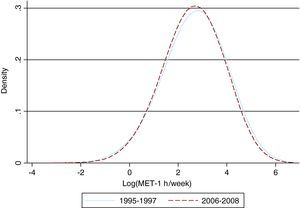
In order to represent the trends in energy expenditure in LTPA and detect nonlinear changes, the adjusted estimators were smoothed by means of cubic splines with three degrees of freedom, which make it possible to reflect up to two changes in the direction of the trend.18 To represent the population-based distribution of energy expenditure in LTPA, we grouped the first three years and the last three years of the series, and transformed logarithmically the MET-1 h per week owing to the asymmetry of the distribution (excluding those who expended no MET-1 h per week); then, density functions were obtained with kernel estimations (the Epanechnikov kernel).19
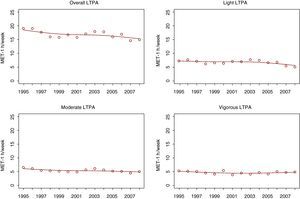
A P value of less than .05 was considered to indicate statistical significance. The analyses were performed with STATA v.9 (StataCorp, College Station, TX, USA, 2005), except those corresponding to Figure 1, which were carried out using S-Plus 2000 (Insightful Corporation, Seattle, WA, USA, 2000).

Figure 1. Changes in the energy expenditure (metabolic equivalent [MET]-1 h/week) in leisure time physical activity (LTPA) from 1995 to 2008 according to the intensity.
ResultsThe average response rate for the study period, defined as the percentage of complete interviews with respect to the total number of complete and incomplete interviews plus those that did not take place, was 65.5%. The age and sex structure of the participants in the study was similar to that of the population of the Madrid region aged 18–64 years (Statistical Institute of the Community of Madrid. Register of the Community of Madrid).
Table 1 shows the changes in the amount of LTPA in MET-1 h per week. The total energy expenditure decreased by 19.8% from 1995 to 2008, especially among women and among individuals aged 18–29 years. The LTPA was also reduced at all levels of education, except the lowest. The decrease in LTPA was mainly due to the reduction in light and moderate activities (Table 1), which is quite linear over the course of time (Figure 1). The adjusted annual change expressed in MET-1 h per week was −0.21 (P<.001) for overall LTPA, −0.1 (P<.001) for light LTPA, −0.08 (P<.001) for moderate LTPA and −0.03 (P=.192) for vigorous LTPA. No statistically significant interactions were observed between the year of the survey and the different population subgroups, except in the trend involving moderate activities, which differed between men and women (P=.031).
Table 1. Changes in Energy Expenditure in Leisure Time Physical Activity (LTPA), 1995–2008.
| Variables | MET-1 h/week, mean | Average annual change in MET-1 h/week, β (95% CI) a | |||||
| 1995 | 2001 | 2008 | Total LTPA | Light LTPA | Moderate LTPA | Vigorous LTPA | |
| Overall | 19.1 | 16.2 | 15.3 | −0.21 (−0.27 to −0.14) b | −0.10 (−0.13 to −0.07) b | −0.08 (−0.11 to −0.04) b | −0.03 (−0.07 to 0.01) |
| Sex | |||||||
| Men | 23.0 | 19.3 | 19.7 | −0.15 (−0.26 to −0.04) c | −0.09 (−0.14 to −0.05) b | −0.03 (−0.09 to 0.03) | −0.03 (−0.10 to 0.04) |
| Women | 15.3 | 13.3 | 11.1 | −0.27 (−0.35 to −0.20) b | −0.10 (−0.14 to −0.06) b | −0.13 (−0.17 to −0.09) b | −0.04 (−0.08 to 0) |
| Age | |||||||
| 18–29 years | 26.6 | 20.0 | 20.2 | −0.25 (−0.40 to −0.09) c | −0.10 (−0.14 to −0.05) b | −0.07 (−0.16 to 0.01) | −0.08 (−0.18 to 0.03) |
| 30–44 years | 15.1 | 14.5 | 13.2 | −0.22 (−0.32 to −0.12) b | −0.12 (−0.16 to −0.07) b | −0.07 (−0.12 to −0.01) c | −0.04 (−0.10 to 0.02) |
| 45–64 years | 15.8 | 14.4 | 13.7 | −0.14 (−0.23 to −0.04) c | −0.05 (−0.11 to 0.01) | −0.09 (−0.15 to −0.04) c | 0.00 (−0.04 to 0.04) |
| Level of education | |||||||
| Up to primary school | 12.5 | 12.3 | 14.8 | −0.05 (−0.20 to 0.11) | −0.04 (−0.13 to 0.06) | −0.03 (−0.10 to 0.04) | 0.02 (−0.05 to 0.09) |
| First cycle of secondary school | 17.4 | 13.3 | 12.7 | −0.23 (−0.35 to −0.11) b | −0.14 (−0.21 to −0.08) b | −0.07 (−0.14 to 0.00) c | −0.01 (−0.08 to 0.06) |
| Second cycle of secondary school | 22.7 | 18.6 | 16.8 | −0.29 (−0.42 to −0.16) b | −0.12 (−0.17 to −0.07) b | −0.11 (−0.18 to −0.04) c | −0.05 (−0.14 to 0.04) |
| University-educated | 21.0 | 17.5 | 15.2 | −0.18 (−0.30 to −0.06) c | −0.08 (−0.13 to −0.03) c | −0.06 (−0.13 to 0.01) | −0.04 (−0.12 to 0.04) |
Abbreviations: CI, confidence interval; MET, metabolic equivalent.
a Linear regression coefficient (95% CI), adjusted for the rest of the variables. They express the mean annual change in MET-1 h/week.
b P<.001.
c P<.05.
Figure 2 shows the population-based distribution of the total energy expenditure in LTPA from 1995 to 1997 and from 2006 to 2008. The leftward shift of the entire curve corresponding to 2006–2008 begins to be observed at low energy expenditure levels.

Figure 2. Distribution of the energy expenditure (metabolic equivalent [MET]-1 h/week) in leisure time physical activity from 1995 to 1997 and from 2006 to 2008.
Table 2 presents the compliance with the ACSM/AHA recommendations concerning LTPA. The incidence of leisure time physical inactivity increased from 23.1% in 1995 to 30.3% in 2008. After adjustment for sociodemographic variables, statistically significant increases are observed in the leisure time inactivity in each sex, in individuals under 45 years of age and at all the levels of education except the lowest. The percentage of active individuals who did not meet the recommendations for LTPA also decreased in the overall population, from 48.2% in 1995 to 42.6% in 2008. This reduction reached statistical significance only among the youngest subjects and those who had completed the first cycle of secondary school. The decrease in the prevalence of compliance with the LTPA recommendations was less marked, from 28.7% in 1995 to 27.1% in 2008. In the adjusted analysis, the decrease only reached statistical significance among women, from the age of 30 years on and among individuals who had completed the second cycle of secondary school.
Table 2. Changes in Compliance With the Recommendations a for Leisure Time Physical Activity (LTPA), 1995–2008.
| Variables | No LTPA | Active individuals who do not comply with LTPA recommendations | Active individuals who comply with LTPA recommendations | |||||||||
| 1995 % | 2001 % | 2008 % | Average annual change OR b (95% CI) | 1995 % | 2001 % | 2008 % | Average annual change OR b (95% CI) | 1995 % | 2001 % | 2008 % | Average annual change OR b (95% CI) | |
| Overall | 23.1 | 20.9 | 30.3 | 1.02 (1.01–1.03) c | 48.2 | 52.3 | 42.6 | 0.99 (0.98–0.99) d | 28.7 | 26.8 | 27.1 | 0.98 (0.98–0.99) c |
| Sex | ||||||||||||
| Men | 19.9 | 18.1 | 25.5 | 1.02 (1.01–1.03) d | 42.7 | 47.6 | 37.4 | 0.99 (0.98–1.00) | 37.4 | 34.3 | 37.1 | 0.99 (0.98–1.00) |
| Women | 26.2 | 23.5 | 35.0 | 1.03 (1.02–1.04) c | 53.5 | 56.7 | 47.7 | 0.99 (0.98–1.00) | 20.3 | 19.8 | 17.4 | 0.97 (0.96–0.98) c |
| Age | ||||||||||||
| 18–29 years | 16.2 | 16.4 | 30.1 | 1.03 (1.02–1.05) c | 40.0 | 42.0 | 29.0 | 0.98 (0.97–0.99) d | 43.8 | 41.7 | 41.0 | 0.99 (0.98–1.00) |
| 30–44 years | 24.5 | 19.7 | 31.2 | 1.03 (1.02–1.04) c | 50.3 | 56.4 | 42.9 | 0.99 (0.98–1.00) | 25.2 | 24.0 | 25.9 | 0.98 (0.97–0.99) d |
| 45–64 years | 28.2 | 26.4 | 29.5 | 1.00 (0.99–1.01) | 53.7 | 58.1 | 52.9 | 1.01 (0.99–1.02) | 18.1 | 15.5 | 17.6 | 0.98 (0.96–0.99) d |
| Level of education | ||||||||||||
| Up to primary school | 39.4 | 35.9 | 36.7 | 0.99 (0.98–1.01) | 48.4 | 54.9 | 48.9 | 1.01 (0.99–1.02) | 12.2 | 9.2 | 14.4 | 0.98 (0.96–1.01) |
| First cycle of secondary school | 24.4 | 23.9 | 39.5 | 1.03 (1.02–1.05) c | 52.2 | 58.9 | 37.5 | 0.98 (0.97–0.99) d | 23.4 | 17.2 | 23.0 | 0.98 (0.97–1.00) |
| Second cycle of secondary school | 18.1 | 20.6 | 29.2 | 1.03 (1.02–1.04) c | 44.6 | 44.9 | 42.0 | 0.99 (0.98–1.01) | 37.3 | 34.5 | 28.8 | 0.97 (0.96–0.99) c |
| University-educated | 16.0 | 13.5 | 24.5 | 1.02 (1.00–1.03) d | 48.5 | 54.0 | 44.7 | 0.99 (0.98–1.00) | 35.5 | 32.5 | 30.9 | 0.99 (0.98–1.01) |
Abbreviations: CI, confidence interval; OR, odds ratio.
a Recommendations of the American College of Sports Medicine/American Heart Association: 7 engage in physical activities of at least moderate intensity for ≥150min/week, or of vigorous intensity for ≥60min/week, or a combination of the two.
b OR (95% confidence interval) estimated by logistic regression and adjusted for the rest of the variables. They express the average annual change in compliance with the recommendations.
c P<.001.
d P<.05.
The incidence of physical inactivity in the workplace increased from 38% in 1995 to 47.8% in 2008 (Table 3). This pattern was observed in both sexes, in all the age groups and at all levels of education, although it was statistically significant only among the women, in subjects under 45 years of age and in those who had an intermediate-level education (having completed the first or second cycle of secondary school). The annual change in occupational physical inactivity differed between men and women (interaction P=.027) and in individuals aged 45–64 years as compared to younger subjects (P=.01). In contrast, there was a decrease in PA of low (P=.019) and moderate (P=.001) intensity. Finally, in the adjusted analyses, there was an increase in high-intensity PA (P<.001).
Table 3. Changes in Usual Occupational Physical Activity (PA), 1995–2008.
| Variables | Inactive | Low-intensity PA | Moderate-intensity PA | High-intensity PA | ||||||||||||
| 1995 % | 2001 % | 2008 % | Average annual change, OR a (95% CI) | 1995 % | 2001 % | 2008 % | Average annual change, OR a (95% CI) | 1995 % | 2001 % | 2008 % | Average annual change, OR a (95% CI) | 1995 % | 2001 % | 2008 % | Average annual change, OR a (95% CI) | |
| Overall | 38.0 | 43.6 | 47.8 | 1.01 (1,00–1.02) b | 45.1 | 45.1 | 42.4 | 0.99 (0.98–0.99) b | 13.6 | 7.9 | 7.8 | 0.98 (0.97–0.99) b | 3.3 | 3.3 | 2,0 | 1.03 (1.01–1.05) c |
| Sex | ||||||||||||||||
| Men | 44.6 | 48.4 | 52.8 | 1,00 (0.99–1.01) | 36.4 | 36.7 | 34.9 | 0.98 (0.97–0.99) b | 13.2 | 9.5 | 8.6 | 1.01 (0.99–1.02) | 5.8 | 5.4 | 3.6 | 1.03 (1.01–1.05) b |
| Women | 31.6 | 39.0 | 43.1 | 1.02 (1.01–1.03) c | 53.5 | 53.1 | 49.6 | 0.99 (0.98–1,00) | 14.1 | 6.5 | 6.9 | 0.95 (0.94–0.97) c | 0.8 | 1.4 | 0.4 | 1.05 (1.01–1.09) b |
| Age | ||||||||||||||||
| 18–29 years | 48.7 | 57.7 | 59.8 | 1.02 (1.00–1.03) b | 34.4 | 31.6 | 31.9 | 0.98 (0.97–0.99) b | 14.1 | 6.9 | 6.8 | 0.98 (0.96–1,00) | 2.8 | 3.7 | 1.5 | 1,00 (0.97–1.03) |
| 30–44 years | 35.7 | 38.2 | 49.0 | 1.02 (1.01–1.03) c | 46.4 | 48.5 | 40.7 | 0.98 (0.97–0.99) b | 13.9 | 9.5 | 8.3 | 0.98 (0.97–0.99) b | 4.0 | 3.9 | 1.9 | 1.04 (1.02–1.07) b |
| 45–64 years | 30.0 | 35.5 | 37.3 | 1.00 (0.99–1.01) | 54.0 | 54.6 | 52.4 | 1,00 (0.99–1.02) | 12.9 | 7.3 | 7.9 | 0.98 (0.96–0.99) b | 3.0 | 2.5 | 2.4 | 1.02 (0.99–1.06) |
| Level of education | ||||||||||||||||
| Up to primary school | 16.8 | 16.9 | 16.7 | 0.99 (0.96–1.01) | 57.3 | 73.2 | 62.2 | 1.02 (1,00–1.04) b | 18.2 | 6.6 | 13.3 | 0.96 (0.94–0.99) b | 7.6 | 3.3 | 7.8 | 1.03 (0.99–1.07) |
| First cycle of secondary school | 21.1 | 24.6 | 28.6 | 1.01 (1,00–1.03) b | 56.2 | 59.6 | 57.3 | 0.99 (0.98–1,00) | 17.8 | 10.4 | 10.7 | 0.99 (0.97–1,00) | 4.9 | 5.4 | 3.3 | 1.01 (0.99–1.04) |
| Second cycle of secondary school | 47.1 | 47.7 | 51.2 | 1.01 (1,00–1.02) b | 37.6 | 38.7 | 38.4 | 0.98 (0.97–0.99) b | 13.3 | 9.7 | 9.1 | 0.98 (0.97–1,00) | 1.9 | 3.8 | 1.3 | 1.04 (1.01–1.07) b |
| University-educated | 59.0 | 65.4 | 63.3 | 1.01 (0.99–1.02) | 34.4 | 29.9 | 33.1 | 0.99 (0.98–1,00) | 6.4 | 3.8 | 3.1 | 0.98 (0.96–1.01) | 0.2 | 0.9 | 0.4 | 1.09 (1.02–1.18) b |
Abbreviations: CI, confidence interval; OR, odds ratio.
a OR (95% CI) estimated by logistic regression and adjusted for the rest of the variables. They express the annual change in occupational PA.
b P<.05.
c P<.001.
Our results show an increase in physical inactivity from 1995 to 2008 among the adult population in the Community of Madrid; this is due to both a lower energy expenditure in LTPA and to an increase in the inactivity at work.
To the best of our knowledge, this is the first population-based study with annual data on the temporal trends in PA in a country in southern Europe. Although comparisons are difficult due to the variety of methods utilized, starting in the nineties of the past century, moderate increases in LTPA are being observed in the United States,6,20 Canada21 and Australia,22 and the prevalence is stabilized in Taiwan.23 In Europe, there are variations in the magnitude and the direction of the trend: in England,24 Scotland25 and Denmark,26 the participation in LTPA is increasing, whereas in Russia27 and Finland,28 it remains stable and in Sweden,29,30 Greece31 and France,32 it is decreasing. In Spain, two previous studies in Catalonia demonstrated moderate increases in LTPA up to 200233 and 2003.34
According to our study, the energy expenditure in LTPA has decreased at an annual average of 0.21 MET-1 h per week. This amount constitutes a reduction of approximately one hour of walking a week from 1995 to 2008. That is equivalent to the decrease in energy necessary for a person weighing 60kg to gain 1kg of body weight during the study period. Physically active individuals are at lower risk of weight gain over time than those who are inactive; thus, although PA does not contribute substantially to weight loss, it is an essential factor in maintaining it stable.12 Therefore, given the marked increase in the prevalence of overweight and obesity in the Community of Madrid over the past two decades, our results are very important.35
It should be pointed out that the decrease in LTPA between 1995 and 2008 has affected the population as a whole, and the entire distribution of LTPA has shifted to the left; this means that the proportion of individuals who do not engage in LTPA has increased and the amount of LTPA of all those who do perform it has decreased. This indicates that, in order to control this problem, population-based interventions are necessary.36 Craig et al.21 also observed changes in LTPA between 1981 and 2000 that affected the population as a whole, although the shift was towards a greater energy expenditure.
Another important aspect is the fact that the activities that contribute the most to the decrease in LTPA were those of low and moderate intensity, mainly due to a decrease in the expenditure associated with walking at a light and at an intense pace (data not shown). Given the importance of these activities in the population as a whole, this could explain, at least partially, the shift to the left of the distribution of the LTPA. However, the expenditure in vigorous LTPA (more closely related to sports) is stabilized. These changes have taken place despite the fact that, in Spain, the number of sports facilities increased by 36.8% between 1986 and 200537 and that the number of licenses granted by sports federations also increased by 35.3% between 1995 and 2008.38
The decrease in LTPA is observed in the majority of the groups, whether classified according to age, sex or level of education, with the exception of the lowest education level, precisely the group in which the prevalence of LTPA is lowest. This has led to a decrease in the disparity in LTPA, which has also been reported in other countries.21 Nevertheless, as in the Community of Madrid, most of the studies show certain homogeneity in the temporal trend of LTPA in the different population groups.20,22,24,27,31,32,33,34,39,40
With respect to occupational PA, all the previous studies report a decrease over time,6,11,24,33,34 possibly due to the greater mechanization in the workplace. An increase in physical inactivity is also observed in the Madrid region, and could be due to changes in the ratio of manual workers to non-manual workers, to a real increase in inactivity or to both. Specifically, during the 14 years of the study, the percentage of non-manual occupations has risen from 53% to 61%. However, the increase in inactivity is observed in both manual and non-manual workers.
The fact that the reduction in occupational PA is not compensated for by an increase in LTPA is a matter of concern. In fact, the percentage of the population that is totally inactive at work and during leisure time has doubled in the Community of Madrid and has risen from 7.5% in 1995 to 13.7% in 2008. Moreover, the majority of the population lives in an urban setting and, thus, is exposed to the negative impact of urban sprawl,6 or urban expansion, favoring sedentary behaviors such as, for example, a dependence on the use of the car.
This study has a number of limitations. First, given that the data are self-reported by the subjects, there may be a certain memory bias, but it is not very likely that there be a differential time-related error because the same questions were posed every year. Moreover, one study analyzed the differential bias in the estimation of PA over time and found no non-response bias.41 Second, despite their limitations, PA questionnaires are widely utilized in population-based studies to measure trends in PA.42 Third, taking into account the definition of LTPA, the questionnaire did not include activities of daily living, especially housework or transportation, which are usually classified as being of low intensity.16 However, if these or other activities had been structured by the interviewee as corresponding to leisure time (do-it-yourself projects, repairs, gardening, etc.), they would have been included in our study.
This study is based on an extensive sample that is representative of the Madrid region in terms of age and sex, although individuals with a low level of education may be underrepresented.43 Despite the fact that the participation was greater than that of reference studies carried out with a similar methodology, like the Behavioral Risk Factor Surveillance System of the United States, we cannot rule out a response bias.
Nevertheless, taking into account the fact that this is a time series study based on surveys carried out with the same methodology, the existence of this bias should not affect the year-to-year comparisons. Moreover, the surveys were carried out throughout the entire year in order to minimize seasonal variability, the questions have remained constant over the 14 years of the study in order to guarantee their comparability, and the questionnaire has exhibited good reproducibility15 and convergence validity.43
We should be cautious in drawing an inference from our results with regard to other populations. However, similarly with many other regions of Spain in which there is a high degree of urbanization, the Madrid region probably shares the social changes underlying the reduction of PA.
ConclusionsAmong the adult population of the Community of Madrid, physical inactivity has increased between 1995 and 2008, mainly due to a decrease in the PA of low and moderate intensity, which has been accompanied by a greater physical inactivity in the workplace. Taking into account the disruption of the energy balance that has led to a marked increase in overweight and obesity,35 in the Community of Madrid, it is necessary to develop effective strategies for the promotion of PA and prevention of sedentariness, aimed at the population as a whole, which include non-sports PA.
Conflicts of interestThe authors state that they have no conflicts of interest.
Acknowledgments
We thank all the participants in the study for the information provided, Miguel de la Fuente for his support in the fieldwork and Aurelio Tobías for his assistance in the statistical study.
Received 17 May 2010
Accepted 28 July 2010
Corresponding author: Servicio de Epidemiología, Consejería de Sanidad de Madrid, Madrid, Spain. inaki.galan@salud.madrid.org