Population-based studies in other countries have reported a reduction of standardized rates of hospitalization for heart failure (HF) but data from a well-defined population are lacking in Spain.
MethodsAll hospitalizations with a principal diagnosis of HF between 2003 and 2013 were obtained from the Minimum Basic Data Set, which includes all hospitals in the Region of Murcia. Health care episodes were identified by the individual health card (27 158 episodes). For each year, we studied the following parameters: crude, age-standardized and sex-standardized hospitalization rates for HF, length of stay, mortality, clinical variables, and the Elixhauser index. Time trends were analyzed using joinpoint regression.
ResultsHospitalization rates increased by 76.7%, from 1.28‰ to 2.26‰ (crude) and 1.06‰ to 1.77‰ (standardized); the mean annual percentage of change (APC) was 8.2% until 2007 and was subsequently 1.9% (P < .05). Rates doubled in persons ≥ 75 years, reaching 19.9‰ in those aged 75 to 84 years (APC, 5.4%) and 32.5‰ in those aged ≥ 85 years (APC, 11.7%) but were unchanged in persons aged < 75 years. The hospitalization rate was 36% higher in women than in men but was equal after age-standardization and showed no temporal change. The Elixhauser comorbidity index increased by almost 1 point during the study period and episodes > 6 points increased by 2-fold. Length of stay and mortality were unchanged during the study period.
ConclusionsBetween 2003 and 2013, there was a sustained increase in standardized rates of hospitalization for HF, which affected persons ≥ 75 years and was associated with a rise in comorbidity. There is a need for strategies focused on this population.
Keywords
Heart failure (HF) is one the most pressing current public health concerns. Because HF is the final stage of most heart diseases, its prevalence has increased due to population aging and advances in the treatment and management of acute myocardial infarction and other heart diseases.1 During the next 2 decades, the predicted proportional increase in HF prevalence will probably exceed that of other cardiovascular diseases.2 Its costs are high (2% of health expenditure), largely due to its high hospitalization rate, which is responsible for two-thirds of its health expenses. In Spain, its annual cost per patient ranges between €12 995 and €18 220 and increases with patient age.3
Few population and trend data are available for Spain. The RECALCAR registry,4 maintained by the Spanish Society of Cardiology, found an increase in the total number of hospitalizations in recent years. However, this registry only provides crude episode data and lacks age- and population-standardized rates. This type of data is particularly important due to population growth and structural changes, largely those caused by aging. A national study of avoidable hospitalizations reported that 25% of them were due to HF.5 However, registries from other countries that used standardized rates have found a reduction in HF hospitalization rates in recent years.6–11 These decreases were associated with improvements in treatment and care and a consequent decrease in avoidable hospitalizations.12
To properly study the behavior of this disease, trustworthy indicators are required, as well as adequate bias control. These criteria require complete follow-up of each individual during the health care process associated with each episode, avoiding duplicates in the calculation of admissions and an overestimation of hospitalizations. At the same time, the identification of representative population-wide indicators is crucial. This study investigated these methodological aspects and analyzed HF hospitalization behavior in an 11-year period in a well-defined territory and population.
METHODSDesign and Study PopulationThis observational study was based on the Minimum Basic Data Set discharge registry of the Department of Health of the Region of Murcia. The study population included all discharges after conventional hospitalization of residents of the Region of Murcia with a “principal diagnosis of HF” that were funded by the National Health System in either public hospitals of the Murcian Health Service or private subsidized hospitals between 2003 and 2013. “Heart failure” was defined using the following codes of the ICD-9-CM (International Classification of Diseases, Ninth Revision, Clinical Modification): 398.91, 402.01, 402.11, 402.91, 404.01, 404.03, 404.11, 404.13, 404.91, 404.93, and 428.XX.13 We excluded discharges after a secondary diagnosis of HF and discharges after emergency hospitalizations. Elective admissions were also excluded, as well as mid-to-long–term hospitalizations, defined as those pertaining to the “long-term care unit” and, by agreement, those with a duration > 90 days in private subsidized hospitals. Health care episodes were then established by grouping together the discharges showing continuity of care (transfers between hospitals), identifying these people via their individual health care card codes and verifying them with the PERSAN population database, which includes all users of the Murcian Health Service. Of the 29 290 discharges after HF hospitalization initially identified in the period, the following were sequentially eliminated: 1.7%, for not pertaining to residents of Murcia; 4.6%, for not being funded by the Murcian Health Service; and 0.5%, for being mid-to-long–term stays. Thus, the total number of episodes studied was 27 581. Of these, 91.5% were assigned to single individuals, allowing their follow-up in all hospitals of the network. In the remaining 8.5% of episodes, the individual in question could not be identified due to a missing health care card or an error in the card, meaning that follow-up was conducted only by the initial admitting hospital.
Study VariablesFor each year, the following variables were obtained: a) “hospitalization rate” (number of events per 1000 population for each year according to the municipal census of the Region of Murcia) and “standardized hospitalization rate” (taking as reference the standard European population)14; b) “in-hospital mortality” (percentage of observed deaths) and “standardized in-hospital mortality” (taking as reference the total number of episodes identified); c) the sex ratio (rate in women/rate in men); and d) the mean length of hospital stay. To determine the rates, the population was calculated mid-way through the year using arithmetic interpolation from the census data of January 1, 2016.14 Standardization was performed using the direct method.
The following demographic and clinical variables were obtained from the appropriate source: sex and age (categorized into 5 groups); principal diagnosis (reason for admission); any secondary diagnoses indicating the presence of heart disease (arrhythmias, ischemic heart disease, valvular heart disease, hypertensive heart disease, pericardial disease, cardiomyopathies, or congenital heart disease); and cardiovascular risk factors (diabetes, hypertension, atherosclerosis, dyslipidemia, and smoking). To evaluate the comorbidity burden, the Elixhauser index15 was calculated for each episode; this system includes 30 different comorbidities (Table 1 of the supplementary material) and is a validated index for predicting the use of hospital resources and the risk of in-hospital mortality and readmission.16
Statistical AnalysisAnalysis of descriptive statistics was performed with SPSS version 21.0. For the study of time trend changes in hospitalization and in-hospital mortality rates, joinpoint regression model version 4.2.0.2 was used.17 This tool estimates the presence of changes in the trends in standardized annual rates and the mean annual percentage change (APC). An APC value was considered statistically significant if it differed from 0 with a P value < .05.
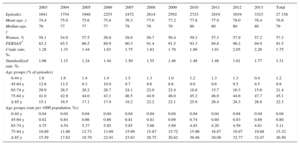
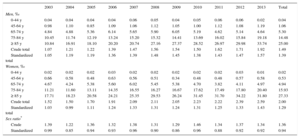
RESULTSTrends in Health Care Episodes by Age and SexFrom 2003 to 2013, 27 581 health care episodes related to HF were identified. Because 1.5% corresponded to transfers between hospitals, the actual number of single episodes during the period was 27 158. A year-by-year analysis of episodes is shown in Table 1. The annual number of HF hospitalization episodes grew 102.5% (from 1641 episodes in 2003 to 3323 in 2013) and the hospitalization rate (episodes per 1000 population, ‰) also increased by 76.7%, from 1.28‰ to 2.26‰ (crude) and from 1.06‰ to 1.77‰ (standardized).
Heart Failure Hospitalizations (2003-2013): Characteristics, Distributions by Age Group, and Hospitalization Rates (per 1000 Population)
| 2003 | 2004 | 2005 | 2006 | 2007 | 2008 | 2009 | 2010 | 2011 | 2012 | 2013 | Total | |
|---|---|---|---|---|---|---|---|---|---|---|---|---|
| Episodes | 1641 | 1754 | 1948 | 2253 | 2472 | 2614 | 2592 | 2723 | 2819 | 3019 | 3323 | 27 158 |
| Mean age, y | 74.4 | 75.0 | 75.6 | 75.8 | 76.3 | 77.0 | 77.2 | 77.8 | 77.9 | 78.0 | 78.4 | 76.9 |
| Median age, y | 76 | 77 | 77 | 77 | 78 | 79 | 79 | 80 | 80 | 80 | 80 | 79 |
| Women, % | 58.1 | 54.9 | 57.5 | 56.9 | 58.0 | 56.7 | 56.4 | 59.3 | 57.3 | 57.9 | 57.2 | 57.3 |
| PERSAN* | 83.2 | 85.5 | 86.5 | 89.9 | 90.3 | 91.4 | 91.5 | 93.3 | 94.8 | 96.2 | 94.9 | 91.5 |
| Crude rate, ‰ | 1.28 | 1.33 | 1.44 | 1.63 | 1.75 | 1.82 | 1.78 | 1.86 | 1.91 | 2.05 | 2.26 | 1.75 |
| Standardized rate, ‰ | 1.06 | 1.15 | 1.24 | 1.44 | 1.50 | 1.55 | 1.46 | 1.48 | 1.48 | 1.61 | 1.77 | 1.31 |
| Age groups (% of episodes) | ||||||||||||
| 0-44 y | 1.6 | 1.6 | 1.4 | 1.4 | 1.5 | 1.3 | 1.0 | 1.2 | 1.3 | 1.3 | 0.4 | 1.2 |
| 45-64 y | 12.6 | 12.5 | 9.3 | 10.9 | 9.7 | 9.6 | 8.6 | 9.0 | 9.6 | 9.5 | 9.5 | 9.9 |
| 65-74 y | 29.9 | 26.5 | 28.2 | 26.7 | 24.1 | 22.0 | 22.4 | 18.8 | 15.7 | 16.3 | 15.6 | 21.4 |
| 75-84 y | 41.0 | 42.9 | 44.0 | 43.1 | 46.5 | 44.9 | 46.0 | 45.2 | 46.9 | 44.6 | 47.7 | 45.1 |
| ≥ 85 y | 15.1 | 16.5 | 17.1 | 17.9 | 18.2 | 22.2 | 22.1 | 25.9 | 26.4 | 28.3 | 26.8 | 22.3 |
| Age groups (rate per 1000 population, ‰) | ||||||||||||
| 0-44 y | 0.04 | 0.04 | 0.04 | 0.04 | 0.04 | 0.04 | 0.04 | 0.04 | 0.04 | 0.04 | 0.04 | 0.04 |
| 45-64 y | 0.82 | 0.84 | 0.66 | 0.86 | 0.81 | 0.81 | 0.69 | 0.74 | 0.80 | 0.83 | 0.89 | 0.80 |
| 65-74 y | 4.75 | 4.54 | 5.37 | 5.85 | 5.85 | 5.66 | 5.69 | 4.93 | 4.20 | 4.59 | 4.81 | 5.11 |
| 75-84 y | 10.89 | 11.66 | 12.73 | 13.89 | 15.99 | 15.87 | 15.72 | 15.96 | 16.87 | 16.97 | 19.88 | 15.32 |
| ≥ 85 y | 15.59 | 17.82 | 19.79 | 22.91 | 23.83 | 28.75 | 26.62 | 30.46 | 30.09 | 32.77 | 32.47 | 26.56 |
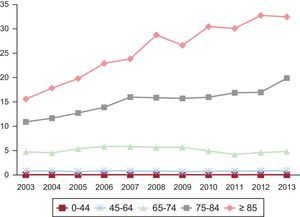
Analysis by age group (Table 1) showed that 67.4% of HF hospitalization episodes were due to patients ≥ 75 years (45.1% in the 75 to 84 age group) vs 1.2% in the group aged 0 to 44 years. The trend (in relative terms) revealed an increased percentage of episodes in patients ≥ 75 years, whereas there were fewer episodes in those < 75 years. The hospitalization rate showed similar behavior (Figure 1). The mean age of patients with episodes increased by 4 years during the period.
 by age from 2003 to 2013.")
When adjusted by population, the increase in the standardized hospitalization rate from 2003 to 2013 was due to older age groups (≥ 75 years), whose levels doubled. Thus, the rate increased from 10.89‰ to 19.88‰ in the group aged 75 to 84 years and from 15.59‰ to 32.47‰ in those older than 84 years. In contrast, there were no changes in the hospitalization rate in those younger than 75 years (Table 1).
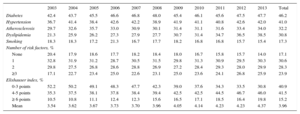
Women accounted for 57.3% of episodes and their relative contribution to HF hospitalization was unchanged during the study period (Table 1). In terms of population, the hospitalization rate showed the same female predominance in crude rates with a sex ratio of 1.36 (136 episodes in women for every 100 episodes in men) and a time trend by age equivalent to that of men (Table 2). However, when the rates were standardized by age, HF hospitalization rates were similar in men and women. Although initially seeming paradoxical, the reason for these results is that women are 50.5% more common than men in the group aged ≥ 75 years (Table 2).
Heart Failure Hospitalization Rates (2003-2013), Stratified by Sex and Age (per 1000 Population)
| 2003 | 2004 | 2005 | 2006 | 2007 | 2008 | 2009 | 2010 | 2011 | 2012 | 2013 | Total | |
|---|---|---|---|---|---|---|---|---|---|---|---|---|
| Men, ‰ | ||||||||||||
| 0-44 y | 0.04 | 0.04 | 0.04 | 0.04 | 0.06 | 0.05 | 0.04 | 0.05 | 0.06 | 0.06 | 0.02 | 0.04 |
| 45-64 y | 0.98 | 1.10 | 0.85 | 1.09 | 1.06 | 1.12 | 1.05 | 1.00 | 1.12 | 1.08 | 1.19 | 1.06 |
| 65-74 y | 4.84 | 4.88 | 5.36 | 6.14 | 5.65 | 5.90 | 6.05 | 5.19 | 4.62 | 5.14 | 4.64 | 5.30 |
| 75-84 y | 10.45 | 11.74 | 12.19 | 13.24 | 15.20 | 15.32 | 14.41 | 13.69 | 16.02 | 15.84 | 19.18 | 14.48 |
| ≥ 85 y | 10.84 | 16.91 | 18.10 | 20.20 | 20.74 | 27.16 | 27.37 | 28.52 | 26.97 | 29.98 | 33.74 | 25.00 |
| Crude total | 1.07 | 1.21 | 1.22 | 1.39 | 1.47 | 1.56 | 1.54 | 1.50 | 1.62 | 1.71 | 1.92 | 1.49 |
| Standardized total | 1.05 | 1.19 | 1.19 | 1.36 | 1.39 | 1.48 | 1.45 | 1.38 | 1.43 | 1.47 | 1.57 | 1.39 |
| Women, ‰ | ||||||||||||
| 0-44 y | 0.02 | 0.02 | 0.02 | 0.03 | 0.02 | 0.02 | 0.02 | 0.02 | 0.02 | 0.03 | 0.01 | 0.02 |
| 45-64 y | 0.66 | 0.58 | 0.48 | 0.63 | 0.56 | 0.51 | 0.34 | 0.48 | 0.48 | 0.57 | 0.58 | 0.53 |
| 65-74 y | 4.67 | 4.24 | 5.38 | 5.60 | 6.02 | 5.45 | 5.38 | 4.70 | 3.82 | 4.11 | 4.97 | 4.94 |
| 75-84 y | 11.21 | 11.60 | 13.11 | 14.35 | 16.55 | 16.27 | 16.67 | 17.62 | 17.49 | 17.80 | 20.40 | 15.93 |
| ≥ 85 y | 17.71 | 18.23 | 20.58 | 24.21 | 25.35 | 29.53 | 26.24 | 31.45 | 31.70 | 34.22 | 31.80 | 27.33 |
| Crude total | 1.52 | 1.50 | 1.70 | 1.91 | 2.09 | 2.11 | 2.05 | 2.23 | 2.22 | 2.39 | 2.59 | 2.00 |
| Standardized total | 1.03 | 0.99 | 1.11 | 1.24 | 1.33 | 1.31 | 1.24 | 1.31 | 1.25 | 1.33 | 1.43 | 1.29 |
| Sex ratio* | ||||||||||||
| Crude | 1.39 | 1.22 | 1.36 | 1.32 | 1.38 | 1.31 | 1.29 | 1.46 | 1.34 | 1.37 | 1.34 | 1.36 |
| Standardized | 0.99 | 0.85 | 0.94 | 0.93 | 0.96 | 0.90 | 0.86 | 0.96 | 0.88 | 0.92 | 0.92 | 0.94 |
Analysis showed that the rates of hypertension, diabetes, and atherosclerosis were stable over time, whereas that of dyslipidemia increased (Table 3). In contrast, there were fewer patients without risk factors and more patients with 3 or more factors, increasing from 17.1% to 23.9%. This increment in the number of risk factors was seen in all age groups (Table 2 of the supplementary material). Cardiac arrhythmias were the most common heart disease at discharge (63.7%), followed by ischemic heart disease (30.6%) and valvular heart diseases (29.1%). There were no changes over time in this variable (Table 3 of the supplementary material). Regarding comorbidities, the Elixhauser index increased during the period (from 3.54 points in 2003 to 4.37 points in 2013) due to fewer episodes with an index score between 0 and 3 points and more episodes in the remaining groups, so much so that there was a doubling in the number of episodes with a score of 6 or more (Table 3).
Cardiovascular Risk Factors and the Elixhauser Comorbidity Index From 2003 to 2013
| 2003 | 2004 | 2005 | 2006 | 2007 | 2008 | 2009 | 2010 | 2011 | 2012 | 2013 | Total | |
|---|---|---|---|---|---|---|---|---|---|---|---|---|
| Diabetes | 42.4 | 43.7 | 45.5 | 46.6 | 46.8 | 48.0 | 45.4 | 46.1 | 45.6 | 47.5 | 47.7 | 46.2 |
| Hypertension | 36.7 | 41.4 | 38.4 | 42.6 | 42.2 | 38.9 | 41.9 | 41.1 | 40.8 | 42.6 | 42.0 | 41.0 |
| Atherosclerosis | 29.7 | 32.6 | 35.7 | 33.0 | 30.9 | 30.1 | 31.4 | 31.1 | 31.6 | 33.4 | 34.0 | 32.2 |
| Dyslipidemia | 21.3 | 25.9 | 26.2 | 27.3 | 27.9 | 27.7 | 30.7 | 31.4 | 34.7 | 36.5 | 38.5 | 30.8 |
| Smoking | 18.3 | 18.3 | 17.2 | 21.3 | 16.7 | 17.7 | 18.2 | 16.8 | 16.8 | 15.7 | 15.4 | 17.3 |
| Number of risk factors, % | ||||||||||||
| None | 20.4 | 17.9 | 18.6 | 17.7 | 18.2 | 18.4 | 18.0 | 16.7 | 15.8 | 15.7 | 14.0 | 17.1 |
| 1 | 32.8 | 31.9 | 31.2 | 28.7 | 30.5 | 31.5 | 29.8 | 31.3 | 30.9 | 29.5 | 30.3 | 30.6 |
| 2 | 29.8 | 27.5 | 26.8 | 28.6 | 28.8 | 26.9 | 27.2 | 28.4 | 29.3 | 28.0 | 29.9 | 28.3 |
| ≥3 | 17.1 | 22.7 | 23.4 | 25.0 | 22.6 | 23.1 | 25.0 | 23.6 | 24.1 | 26.8 | 25.9 | 23.9 |
| Elixhauser index, % | ||||||||||||
| 0-3 points | 52.2 | 50.2 | 49.1 | 48.3 | 47.7 | 42.3 | 39.0 | 37.6 | 34.3 | 33.5 | 30.8 | 40.9 |
| 4-5 points | 35.3 | 37.5 | 38.1 | 37.8 | 38.4 | 39.4 | 42.5 | 42.5 | 44.5 | 46.7 | 46.0 | 41.5 |
| ≥ 6 points | 10.5 | 10.8 | 11.1 | 12.4 | 12.3 | 15.6 | 16.5 | 17.1 | 18.5 | 16.4 | 19.8 | 15.2 |
| Mean | 3.54 | 3.62 | 3.67 | 3.73 | 3.70 | 3.96 | 4.05 | 4.14 | 4.23 | 4.23 | 4.37 | 3.96 |
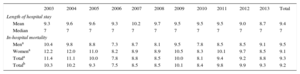
The length of hospital stay of each episode was unchanged during the study period. The mean was 9.4 days and the median was 7, with no differences according to age or sex. In-hospital mortality was 9.2% (8.7% in men and 9.6% in women). Again, no significant changes were seen during the period (Table 4).
Length of Hospital Stay and In-hospital Mortality From 2003 to 2013
| 2003 | 2004 | 2005 | 2006 | 2007 | 2008 | 2009 | 2010 | 2011 | 2012 | 2013 | Total | |
|---|---|---|---|---|---|---|---|---|---|---|---|---|
| Length of hospital stay | ||||||||||||
| Mean | 9.3 | 9.6 | 9.6 | 9.3 | 10.2 | 9.7 | 9.5 | 9.5 | 9.5 | 9.0 | 8.7 | 9.4 |
| Median | 7 | 7 | 7 | 7 | 7 | 7 | 7 | 7 | 7 | 7 | 7 | 7 |
| In-hospital mortality | ||||||||||||
| Mena | 10.4 | 9.8 | 8.8 | 7.3 | 8.7 | 8.1 | 9.5 | 7.8 | 8.5 | 8.5 | 9.1 | 9.5 |
| Womena | 12.2 | 12.0 | 11.0 | 8.2 | 8.9 | 8.9 | 10.5 | 8.3 | 10.1 | 9.7 | 8.5 | 9.1 |
| Totala | 11.4 | 11.1 | 10.0 | 7.8 | 8.8 | 8.5 | 10.0 | 8.1 | 9.4 | 9.2 | 8.8 | 9.3 |
| Totalb | 10.3 | 10.2 | 9.3 | 7.5 | 8.5 | 8.5 | 10.1 | 8.4 | 9.8 | 9.9 | 9.3 | 9.2 |
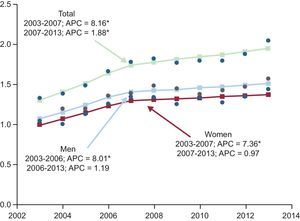
Joinpoint analysis of the standardized hospitalization rate showed an inflection point in 2007 with an APC of 8.2%, with a subsequent decrease to 1.9% until 2013, although the upward trend was statistically significant for both rates (Figure 2). According to sex, the hospitalization rate showed a similar upward trend in both women (APC of 7.4%) and men (APC of 8.0%); however, from 2007 and 2006, respectively, the growth rate decreased for both sexes (Figure 2).
, overall and by sex, from 2003 to 2013. APC, mean annual percentage of change (%). Points: values observed; line: calculated trend; arrow: joinpoint. *APC that is significantly different from 0 (P < .05).")
Joinpoint regression analysis of trends in the standardized hospitalization rate (per 1000 population), overall and by sex, from 2003 to 2013. APC, mean annual percentage of change (%). Points: values observed; line: calculated trend; arrow: joinpoint. *APC that is significantly different from 0 (P < .05).
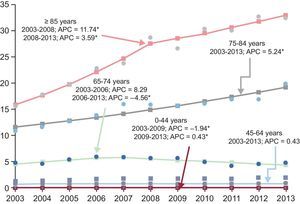
By age group, there were notable significant upward trends in the group aged 75 to 84 years (APC of 5.2%) and in those aged > 84 years (APC of 11.7%), with an inflection point for this last group in 2008, when the APC decreased to a still statistically significant 3.6% (Figure 3). However, the other groups aged < 75 years showed no significant changes in the standardized rate during the 2003 to 2013 period. The 65 to 74 year-old subgroup showed an increase until 2006 and subsequently a decrease, with no significant changes during the entire period (Figure 3). There was a nonsignificant downward trend in in-hospital mortality with an overall APC of 1.6% (2.5% in women and 0.6% in men).
 by age from 2003 to 2013. APC, mean annual percentage of change (%).Points: values observed; line: calculated trend; arrow: joinpoint. *APC that is significantly different from 0 (P < .05).")
Joinpoint regression analysis of trends in the standardized hospitalization rate (per 1000 population) by age from 2003 to 2013. APC, mean annual percentage of change (%).Points: values observed; line: calculated trend; arrow: joinpoint. *APC that is significantly different from 0 (P < .05).
This study, focused on a well-defined geographical area and population, analyzed the behavior and trends in HF hospitalization over a prolonged period of 11 years. The results show a marked increase in the number of HF episodes—even after adjustment for population (standardized rate)—, with a trend that was maintained over time, although lower in recent years, and was related to the increased number of episodes in elderly people as well as the degree of associated comorbidity.
In Spain, there are few data on temporal trends in HF hospitalization. A study performed some years ago (1990-2000) in Andalusia18 found a more acute increase in HF hospitalization trends in women and patients older than 65 years. Because studies such as RECALCAR4 refer to a limited time frame and did not adjust for population, analysis of time trends is not possible. Another more recent study that considered both in-hospital and outpatient incidence in the region of a single hospital in the south of Spain also indicated an increase in new diagnoses in the 2000 to 2007 period.19 Compared with the other studies, the main strength of the present work is its temporal, geographic, and population setting. Casemix analysis was performed of all hospitals (public and private subsidized hospitals) located in the Region of Murcia and the selection and interhospital transfer biases observed in hospital-based studies were avoided. Indeed, 1.5% of the discharges were actually transfers to other hospitals and were recoded as single episodes. Thus, our study used population-based indicators involving patient follow-up by the health care system, constituting indicators with less bias than those calculated by studies based on information from one or a few hospitals.
The first finding is that, during the years studied (2003-2013), there was an increase in episodes and in the HF hospitalization rate that was due to patients ≥ 75 years. In this period, there was an overall population increase of 14.6% and marked population aging. Indeed, the number of patients > 75 years increased by 40.2% and the mean population age increased by 4 years (38.1% of the population > 75 years in 2013). Given the association between HF and age, the population growth and aging would explain the increase in the number of episodes but not the trends in the standardized rates and the joinpoint analysis. The increased hospitalization rate (significant during the entire period) continued after adjustment for population and age, although—as shown by joinpoint analysis—it slowed from 2007 onward. These data contrast with those of other Western studies that also evaluated standardized rates, such as a Danish study that analyzed a 30-year period6 and found a hospitalization increase from 1983 to 2000 and a subsequent decrease until 2012. In addition, other work carried out in Scotland (1986-2003),7 Australia (1990-2007),8 Canada (1999-2007),9 and the United States (2001-2009)10,11 all showed a peak in the rates in the 1990s and a subsequent decrease. However, the considerable time elapsed between the periods evaluated by these studies and ours (2003-2013) limits their comparison.
These data suggest a divergent trajectory of HF hospitalizations in our population and health care setting vs that in other countries. In addition, the sustained increase in hospitalizations was concentrated in older population groups. This finding also diverges from that of other studies that found a greater reduction in hospitalization rate in older patients6,9–11 or in all age groups.7,8 Thus, patients between 75 and 84 years showed an annual growth of 5.2% during the period, whereas the growth of those older than 84 years was 11.2% until 2008 and subsequently lessened (3.6%), but remained significant. An important aspect is that, in the present analysis, it was not possible to determine if the hospitalization increase was due to incident cases or recurrent cases. Improved disease survival (“survivor cohort”) would increase recurrent hospitalizations, although this effect would not explain the difference from other population studies. Advances in disease prevention strategies (including infarct treatment) and the use of drugs with proven benefit for HF with systolic dysfunction should lead to improvements.7 In addition, improvements in disease management—both due to better diagnosis in primary care and the use of home-based and outpatient resources after a first hospitalization—are also factors associated with reduced hospitalization.10,11 All of these factors are implicated in the lower hospitalization rate published in the other studies and could explain the lower upward trend from 2007. Currently, it does not seem that the use of evidence-based treatments is capable of reversing this trend (given that the available registries show a use that is close to that recommended by guidelines20), but it does seem probably that a lack of expansion in the multidisciplinary care model for this chronic disease explains the disparity with other countries. In fact, local experiences from Catalonia support the ability of a combination of multidisciplinary programs and primary care to reduce rehospitalizations.21,22 All of these findings are reinforced by national data showing that 25% of avoidable hospitalizations are due to HF.5 In addition, the data clearly show that elderly patients are those who would benefit most from specific multidisciplinary interventions in the outpatient setting and from prevention of both incident and recurrent hospitalizations.
The analysis reveals the interaction of sex with age. Although the crude hospitalization rate was 34.9% higher in women than in men, after adjustment for the influence of age using standardization, the rate was similar in the 2 sexes. Joinpoint analysis also showed that the trend was similar in men and women. The higher number of HF hospitalizations in women and its relationship with age have been described elsewhere.23 However, the results of this study show that female sex predominance in episodes reflects the preponderance of women in the population ≥ 75 years (50% higher than that of men), in line with their longer life expectancy.
In addition, our study found that the growth in the HF hospitalization rate in patients ≥ 75 years was associated with an increase in comorbidity and the number of risk factors, which could be summarized as an “increase in complexity”. This finding was consistently seen in the other studies.6–11 Thus, the mean score of the Elixhauser index increased, as well as the percentage of patients with a high score (> 6 points). At the same time, although there were no major changes in the prevalence of each individual risk factor, there was an increase in patients with multiple risk factors. The Elixhauser index has been associated with the length and cost of hospital stay, in-hospital mortality, and the risk of emergency 30-day hospitalization.24 The present study found a progressive increase (from 3.54 in 2003 to 4.37 in 2013), whereas the index increased from 5.58 to 5.91 in an American population10 between 2001 and 2009, reflecting an even greater overall comorbidity level than in Spain. The most frequent comorbidities and those showing growth are coronary heart disease, arrhythmias, and hypertension, similar to that observed in other studies and in the overall discharge record for Spanish public hospitals.25
In-hospital mortality and the mean length of hospital stay were stable. In-hospital mortality showed a nonsignificant downward trend. Most studies note a decrease in both in-hospital mortality10,11 and 30-day mortality.7,8,10 The increase in age and comorbidity observed during the study period might have hampered the improvement in these indicators but the lack of a decrease in hospitalizations could also imply greater mortality given that decompensations and hospitalizations themselves increase the risk of death.
LimitationsThis work shares the limitations of all studies using information derived from a clinical and administrative database (Minimum Basic Data Set). The quality and completeness of the medical history information and discharge reports, as well as the coding process, could influence the results. However, this possibility has been limited by the use of a single health care system (with trained personnel, homogeneous coding rules, and shared sources). The limited information from this source affected the analysis of the possible causes of the changes seen in the trends. The identification of individuals was exhaustive (91.5%) and constitutes an indicator rarely used in other studies, allowing us to determine that 1.5% of patients had been transferred between hospitals. Thus, and given that the numbers of public hospitals and beds per population in this region have been stable in this period and that health care access is considered adequate, the possibility of significant biases is low.
CONCLUSIONSIn the 2003 to 2013 period, HF hospitalizations showed sustained growth. The increase was slower in recent years but was still significant. This growth is explained by the increased hospitalization rates in patients ≥ 75 years and is associated with greater comorbidity. These results support the need for expanded multidisciplinary health care programs for HF, particularly those directed at patients ≥ 75 years that address the complexity of this chronic disease.
CONFLICTS OF INTERESTNone declared.
- –
HF hospitalization represents a health care challenge because it is the primary cause of hospitalization in people older than 65 years.
- –
Population studies performed in other countries have shown a reduced hospitalization rate in the last decade; however, in Spain, there are few standardized data on its temporal trends and profile in a well-defined population setting.
- –
This work focuses on a complete territorial region and integrates the information obtained on all individuals with hospital discharges and a primary diagnosis of HF during a long period of 11 years, from 2003 to 2013.
- –
HF hospitalizations showed a sustained growth that was slower in recent years but was still significant.
- –
This increase was maintained after standardization of the rates per population; it was concentrated in individuals older than 74 years and was associated with greater comorbidity.
- –
The findings of this study support the need for multidisciplinary health care programs directed at this population.