Cardiac resynchronization therapy improves clinical symptoms and prognosis of heart failure patients. However, it has been shown that up to 40% of patients do not respond to this therapy. Three main determinants of cardiac resynchronization therapy response have been identified: left ventricular dyssynchrony, left ventricular lead position, and extent and location of myocardial scar tissue. Two-dimensional echocardiography is the first imaging technique to evaluate patients who may be candidates for cardiac resynchronization therapy. However, a multimodality approach based on 3-dimensional imaging techniques may provide a more comprehensive evaluation of these patients by combining the assessment of the aforementioned pathophysiological determinants of cardiac resynchronization therapy response.
Keywords
.
INTRODUCTIONSeveral randomized controlled trials have reported significant improvements in clinical symptoms, left ventricular (LV) systolic function and long-term outcome of heart failure patients treated with cardiac resynchronization therapy (CRT).1 However, many studies have also shown that up to 30% to 40% of patients do not improve.2, 3, 4 Inclusion criteria based on New York Heart Association (NYHA) functional class III-IV heart failure symptoms, LV ejection fraction (LVEF)<35%, and QRS complex duration >120ms do not seem to accurately identify the patients who will benefit from CRT. Current evidence has identified 3 main pathophysiological determinants of response to CRT: LV dyssynchrony,5 extent and location of myocardial scar tissue,6 and LV lead position.7, 8 Two-dimensional (2D) echocardiography is the first imaging technique to evaluate patients who are candidates for CRT.9 However, 3-dimensional (3D) imaging techniques have demonstrated their role in selecting heart failure patients for CRT and provide a comprehensive approach to evaluate the pathophysiologic mechanisms underlying CRT response.10, 11, 12 The present article reviews the role of 3D echocardiography, cardiac magnetic resonance (CMR) imaging, nuclear imaging, and multi-detector row computed tomography (MDCT) in the patients’ selection process for CRT, addressing each of the 3 main determinants of response.
THREE-DIMENSIONAL IMAGING TO ASSESS LEFT VENTRICULAR DYSSYNCHRONYCurrent guidelines include evaluation of electrical dyssynchrony by quantification of the QRS duration prior to CRT implantation.13, 14 However, the relationship between baseline QRS duration and the improvement in clinical or echocardiographic endpoints after CRT is not straightforward.15 In 242 heart failure patients with a wide QRS complex treated with CRT, the percentage of patients showing clinical response to CRT at 6 months follow-up was similar among the different baseline QRS duration categories.15 A QRS duration ≥163ms predicted clinical response with suboptimal sensitivity and specificity (53% for both). In light of these results, extensive research has focused on the accuracy of cardiac mechanical dyssynchrony to predict response to CRT. By using different cardiac imaging modalities, it was shown that cardiac mechanical dyssynchrony is an important determinant of response to CRT.9 Three levels of cardiac dyssynchrony have been identified: atrio-ventricular (between the atria and the ventricles), inter-ventricular (between the right and the left ventricle), and intra (LV)-ventricular (within the LV). Of those three components, LV dyssynchrony is demonstrated to be an independent predictor of response to CRT and long-term outcome.9 The assessment of LV dyssynchrony has been commonly performed with 2D echocardiography evaluating different aspects of LV mechanics (ie, time difference between septal and posterior inward wall motion, between peak systolic velocities for example).16 However, in order to obtain a unique evaluation of LV dyssynchrony within the entire left ventricle, several 3D cardiac imaging modalities have been developed. Three-dimensional echocardiography, nuclear imaging and CMR are valuable imaging techniques to identify LV dyssynchrony and predict response to CRT. In addition, preliminary experiences have shown the usefulness of MDCT to assess LV dyssynchrony.17
Three-Dimensional EchocardiographyThe assessment of LV dyssynchrony with 3D echocardiography can be performed with triplane tissue synchronization imaging, real-time 3D echocardiography and 3D speckle tracking strain imaging.11, 18
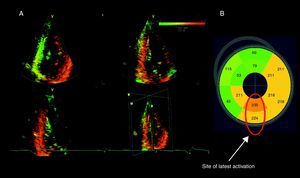
Triplane tissue synchronization imaging is a technology derived from tissue Doppler imaging that evaluates the timing of myocardial tissue velocities of 12 LV segments (6 basal and 6 midventricular segments) along the cardiac cycle. The standard deviation (SD) of the time to peak systolic velocities of 12 segments (Ts-12-SD) is subsequently calculated, providing an estimate of LV dyssynchrony. Additionally, the postprocessing software provides a color-coded bull's eye reconstruction of the time to peak systolic velocity for the basal and mid LV segments, permitting identification of the site of the latest mechanical activation (Figure 1). Several studies have demonstrated the accuracy of this method to assess LV dyssynchrony.11, 19 A Ts-SD-12 value ≥ 33ms predicted significant LV reverse remodeling (≥15% reduction in LV end-systolic volume) after 6 months of CRT with a sensitivity of 90% and a specificity of 83%.11

Figure 1. Tri-plane tissue synchronization imaging to evaluate left ventricular dyssynchrony and site of latest activation. A: A color-coded 3-dimensional dataset of the left ventricle displaying the apical 4-, 2-, and 3- chamber views. The earliest activated areas appear in green and the latest in red. Significant left ventricular dyssynchrony calculated as the standard deviation of time to peak velocity in 12 segments was observed (64ms). 11 B: A bull's eye image shows the timings of peak myocardial velocity for each of the 12 segments. The site of latest activation was subsequently identified.
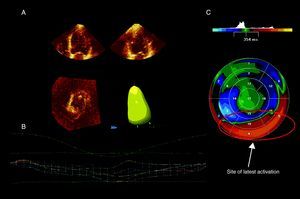
In addition, real-time 3D echocardiography provides also an accurate methodology to assess LV dyssynchrony, based on the SD of time to minimum systolic volume of 16 or 17 LV segments throughout the cardiac cycle (the so-called systolic dyssynchrony index or SDI).20 A color-coded parametric image is derived indicating the time dispersion of LV activation and the site of latest mechanical activation (Figure 2). The merit of real-time 3D echocardiography SDI to assess LV dyssynchrony and predict response to CRT has been previously reported. An SDI value ≥ 6.4% predicted significant LV reverse remodeling 6 months after CRT with a sensitivity and specificity of 88% and 85%, respectively.18

Figure 2. Real time 3-dimensional echocardiography and evaluation of left ventricular dyssynchrony and site of latest activation. A: Endocardial contours are first defined using the apical 4- and 2-chamber views. B: The software generates a time to left ventricular end-systolic volume curve for the whole left ventricle and for each of the 16 segments studied. Here, there was significant left ventricular dyssynchrony (systolic dyssynchrony index: 8.9%). 18 C: A parametric image shows the timing of minimal left ventricular end-systolic volume for each of 16 segments. The latest activated area (in red) was identified.
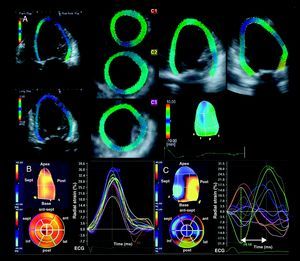
However these 3D echocardiographic modalities do not detect active myocardial contraction and, particularly in ischemic heart failure patients, differentiation between LV segments with active contraction and segments tethered by the traction of viable surrounding segments may be of interest. Recent advances in 3D echocardiography have also permitted the analysis of myocardial deformation or strain. Speckle tracking imaging is of special interest since it permits an accurate assessment of myocardial deformation by tracking the acoustic myocardial markers (speckles) independently of the angle of the ultrasound beam. After alignment of the multiplanar reformation planes to obtain the maximal LV long-axis dimensions and the true apex, the LV full volume dataset is displayed in 5 different cross-sections: the apical, mid and basal LV short-axis views, and the apical 4- and 2-chamber views. The endocardium is then manually traced in the apical views and the region of interest including the myocardial wall is displayed automatically (Figure 3). Finally, the software displays the time-strain curves for 16 LV segments along the cardiac cycle. Time differences between segmental peak systolic strains are calculated to derive LV dyssynchrony. The use of 3D speckle tracking radial strain echocardiography to quantify LV dyssynchrony has been recently reported in a series of 64 patients, including 54 heart failure patients treated with CRT.22 Tanaka et al. showed that heart failure patients undergoing CRT implantation had larger time delays between opposing walls as compared to healthy volunteers (316±112ms vs 59±12ms respectively; P<.001).22 However, the value of 3D speckle tracking radial strain echocardiography to predict response to CRT has not been reported yet.

Figure 3. Three-dimensional strain and evaluation of left ventricular dyssynchrony. A: After alignment of the multiplanar reformation planes to obtain the long-axis view of the left ventricle, the region of interest is displayed in the 3 cross-sectional views (apex, midventricular and base) and the apical 2- and 4-chamber views. The left ventricular volumes and left ventricular ejection fraction can be obtained and the time-strain curves for the 16 segments are displayed. B: Example of a healthy volunteer with synchronous contraction of the left ventricle as shown in the time-strain plot and the parametric image. C: Example of a heart failure patient with left ventricular dyssynchronous contraction. The latest activated regions correspond to the posterior segments as shown in the parametric image.Reproduced with permission from Nesser et al. 21 and Tanaka et al. 22
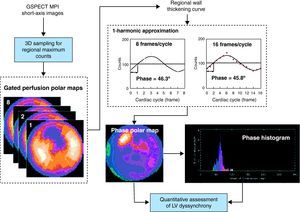
Nuclear ImagingRecent advances in phase analysis have permitted the evaluation of LV dyssynchrony with myocardial perfusion single photon emission computed tomography (SPECT).23 Applying a mathematical algorithm to conventional myocardial perfusion gated SPECT datasets, the amplitude (systolic wall thickening) and phase (onset of mechanical contraction) can be obtained from the regional LV count changes throughout the cardiac cycle. From these data the uniformity and homogeneity of the LV contraction can be evaluated in a polar phase map and a histogram. The LV dyssynchrony can be quantified with 5 parameters: peak phase, phase SD, bandwidth, kurtosis, and skewness. Figure 4 illustrates the assessment of LV dyssynchrony with phase analysis. The histogram bandwidth (range of 95% of the phase angles) and the phase SD are the most often used indices of LV dyssynchrony. The value of these indices to predict improvement of ≥1 NYHA functional class 6 months after CRT was evaluated by Henneman et al.25 In 42 heart failure patients treated with CRT, the optimal cut-off values were identified for the histogram bandwidth (≥1350, sensitivity and specificity 70%) and the phase SD (≥430, sensitivity and specificity 74%).25

Figure 4. Nuclear imaging to assess left ventricular dyssynchrony. From the gated single photon emission computed tomography myocardial perfusion images, the regional maximal counts are obtained in 3 dimensions. The gated perfusion polar maps display these 3-dimensional samples over the cardiac cycle. Afterwards, the regional maximal count variation over the cardiac cycle is derived and, applying the first-harmonic Fourier function to the regional wall thickening curve, the regional phase is calculated. This sequence is repeated for all the left ventricular regions obtaining the onset of mechanical contraction phase distribution, which is represented as phase polar map and phase histogram. Reproduced with permission from Chen et al. 24 3D, three-dimensional; GSPECT, gated single photon emission computed tomography; LV, left ventricular; MPI, myocardial perfusion imaging.
Cardiac Magnetic ResonanceThe assessment of LV dyssynchrony with CMR can be performed with various methodologies: fast cine gradient echo pulse sequences, CMR-derived strain, and velocity-encoded CMR.
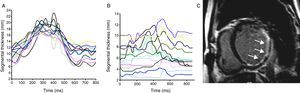
Steady-state free precession gradient echo sequence is commonly used for LV volumetric and functional evaluation. Based on this methodology, several LV dyssynchrony indices have been developed. For example, from short-axis stacks of the LV, the myocardial wall motion can be evaluated in the radial direction for up to 20 phases along the R-R interval and fitted to a sine wave curve. The segmental phase shift of the maximum radial wall motion is obtained from the fit and the LV dyssynchrony index, the so-called CMR tissue synchronization index (TSI), is calculated as the SD of all segmental phase shift of the radial wall motion.26 Chalil et al. recently demonstrated that heart failure patients with a CMR TSI ≥110ms had higher risk of all-cause mortality or hospitalization for heart failure (hazard ratio [HR]=2.21; 95% confidence interval [95%CI] 1.33-4.14, P=.0018) and higher risk of cardiovascular mortality (HR=4.1, 95%CI 1.83-17.47, P=.0001) compared to patients with a CMR TSI < 110ms.26 Therefore, in line with previous studies based on echocardiographic techniques, significant LV dyssynchrony is an independent prognostic marker. These results were further extended by evaluating the use of steady-state free precession CMR-derived LV dyssynchrony indices to predict response to CRT and long-term outcome.10 In a series of 35 heart failure patients undergoing CRT implantation, LV dyssynchrony was measured from 3 short-axis slices of the LV (including the basal, mid-ventricular, and apical levels), quantifying the time to maximal systolic myocardial thickness of 16 LV segments (Figure 5-A, 5-B).10 The SD of these 16 timings was derived as an estimate of LV dyssynchrony. Responder patients, defined by ≥15% reduction in LV end-systolic volume at 6 months follow-up, had significantly larger CMR-derived LV dyssynchrony as compared to non-responders (median 97ms [interquartile range: 90-106] vs 60ms [47-71]; P<.001). Furthermore, LV dyssynchrony was independently related to echocardiographic CRT response (odds ratio=6.3, 95%CI 3.1-9.9, P<.001).10

Figure 5. Cardiac magnetic resonance imaging for cardiac resynchronization therapy patients. A: Shows the results of left ventricular dyssynchrony assessment with cardiac magnetic resonance in a normal individual. There was no left ventricular dyssynchrony. B: Displays the analysis of left ventricular dyssynchrony in an ischemic heart failure patient prior to cardiac resynchronization therapy. There was significant left ventricular dyssynchrony, calculated as the standard deviation of time to maximum thickness (92ms). C: Shows a delayed contrast enhancement cardiac magnetic resonance sequence with sub-endocardial scar tissue (bright) in the lateral, posterior and inferior walls (arrows).
In addition, tagged CMR permits the assessment of LV dyssynchrony based on myocardial strain analysis. The harmonic phase method measures LV circumferential strain by evaluating the myocardial tag pattern along the cardiac cycle. Among several indices of LV dyssynchrony derived from tagged CMR, the circumferential uniformity ratio estimate (CURE) index has provided the most extensive data to predict CRT response and long-term clinical outcome.12 From the short-axis slices of the LV, circumferential strain is measured in several LV segments along the cardiac cycle and the temporal dispersion of circumferential deformation is analyzed with Fourier series decomposition to obtain the CURE index. The CURE index ranges between 0 (perfectly synchronous) and 1 (perfect LV synchrony). In a recent study including 43 heart failure patients, Bilchick et al. demonstrated that a CURE index <0.75 adequately predicted improvement of ≥1 NYHA functional class 6 months after CRT (sensitivity 100%, specificity 71%).12 Therefore, CMR-derived dyssynchrony indices based on strain analysis may improve the patient selection process for CRT by accurately identifying the patients with significant LV dyssynchrony amenable to be corrected with CRT. The advent of novel CMR methodologies based on 3D tagging sequences and optical flow method permits the assessment of myocardial strain in 3 dimensions and ongoing research will show whether this novel technology further helps to select candidates for CRT.27
Furthermore, the assessment of LV dyssynchrony with CMR also has been reported to be feasible using velocity-encoded imaging.28 Applied to long-axis views of the LV, velocity-encoded CMR measures myocardial wall motion along the cardiac cycle and provides time-velocity curves similar to tissue Doppler imaging. The time difference in peak systolic velocity between two opposing walls provides an estimate of LV dyssynchrony. Compared to controls, heart failure patients with left bundle branch block had more dyssynchronous LV contraction as assessed with this methodology (5±17ms vs 49±38ms, respectively).28 So far, no data evaluating the merit of velocity-encoded CMR-derived LV dyssynchrony to predict response and long-term outcome after CRT have been reported yet.
Based on this evidence, LV dyssynchrony is an important determinant of CRT response that can be accurately assessed with 3D imaging modalities. Lower temporal resolution and availability are the main limitations of these imaging techniques. In addition, assessment of LV dyssynchrony with these imaging techniques requires high expertise in order to provide accurate and reproducible measurements. LV mechanical dyssynchrony is not considered as an inclusion criterion for CRT implantation. Despite the results of many trials showing the prognostic value of this parameter, the PROSPECT trial demonstrated moderate accuracy of several LV dyssynchrony parameters based on 2-D echocardiography to predict response to CRT.29 Ongoing randomized trials, such as the EchoCRT trial, will provide further information on the usefulness of LV dyssynchrony assessment in heart failure patients who do not fulfill the current paradigm (QRS duration >120ms).30 Furthermore, integration of LV dyssynchrony information with other pathophysiological factors such as extent and location of myocardial scar may help to further identify the patients who will benefit from CRT. In this regard, 3D imaging techniques such as nuclear imaging and CMR may provide a comprehensive evaluation of patients who may benefit from CRT. Accordingly, the role of CMR in assessing viability and fibrosis content of the myocardium, along with the value of other 3D imaging modalities, will be discussed in the next section.
TOTAL BURDEN AND LOCATION OF SCAR TISSUERecent subanalyses of landmark trials have shown that the prognostic benefits of CRT are comparable in patients with ischemic and nonischemic heart failure. However, these subanalyses have also shown that ischemic heart failure patients exhibit LV reverse remodeling and improvement in LV function to a lesser extent than nonischemic heart failure patients.6, 31 High burden of myocardial scar tissue may prevent LV reverse remodeling and determine a less favorable response to CRT.6 Moreover, scar tissue at the site of LV lead implantation may reduce the efficacy of CRT.32, 33 Contrast-enhanced CMR, SPECT myocardial perfusion imaging, and positron emission tomography are the current imaging techniques of reference for the assessment of scar tissue and myocardial viability. Additionally, strain analysis with speckle tracking echocardiography or myocardial contrast echocardiography may indicate the presence of scar tissue.34, 35
Cardiac Magnetic ResonanceCMR with late gadolinium-enhancement sequence is the gold standard for the assessment of myocardial scar. The paramagnetic contrast media accumulates in the interstitial space, providing a hyperenhanced image on T1-weighted sequences. In the myocardial scar areas, the interstitial space is larger than in the regions with normal myocardium and can be accurately identified with gadolinium contrast CMR as hyperenhanced (bright) regions and low-signal (dark) tissue, respectively (Figure 5-C). In addition, this CMR technique permits accurate differentiation between transmural and subendocardial scar.
Several studies have shown the relationship between the location and extent of myocardial scar and response to CRT.32, 33, 36 The presence of transmural scar at the region where the LV pacing lead is placed was predictive of nonresponse to CRT in an study including 40 end-stage ischemic heart failure patients who underwent late-gadolinium enhanced CMR prior to CRT implantation.32 Patients with transmural scar (>50% of LV wall thickness) at the posterolateral region showed lower response rate compared to patients without posterolateral transmural scar (14% vs 81%, P>.001). In addition, unlike patients without posterolateral transmural scar, patients with transmural scar maintained significant LV dyssynchrony. These findings suggested that pacing in an area with transmural scar may reduce the effect of CRT. Moreover, White et al. demonstrated that the extent of myocardial scar tissue as assessed with late-gadolinium enhanced CMR determines the response to CRT.36 In a series of 28 heart failure patients undergoing CRT implantation, a volume of myocardial scar occupying ≥15% of the LV myocardium could accurately predict response to CRT at 3 months follow-up (sensitivity 85%, specificity 90%; P=.0001).36 These results were further extended in a study including 34 ischemic heart failure patients who underwent late-gadolinium enhanced CMR prior to CRT implantation.6 A significant inverse relationship between the total scar burden and the amount of LV reverse remodeling 6 months after CRT was demonstrated (R=0.91, P<.05).6 Moreover, responders to CRT had significantly less segments with transmural scar than nonresponders (1.6±1.5 vs 5.6±1.6, P<.05).6 Finally, Chalil et al. analyzed the impact of both global burden and location of scar tissue on the response to CRT in 45 ischemic heart failure patients.33 At multivariate analysis percentage of total myocardial scar and transmurality were the strongest determinants of response to CRT (χ2=5.21 and 8.23, respectively; P<.05) whereas the specific location of scar did not determine the response to CRT.33
Nuclear ImagingUse of SPECT myocardial perfusion imaging provides invaluable information on scar burden and location.23 Ypenburg et al. described the use of SPECT myocardial perfusion imaging in 51 patients undergoing CRT implantation to assess the extent of scar tissue and viable myocardium, and to predict CRT response.37 At 6 months follow-up, 27 patients (53%) were responders to CRT.37 Remarkably, responders had significantly more viable segments (segment with tracer uptake ≥75%) than nonresponders (12 segments [11,13] vs 8 segments [5,10]; P<.001).37 Moreover, patients with transmural scar tissue (tracer uptake < 50%) at the site of LV lead implantation experienced no significant LV reverse remodeling 6 months after CRT compared to patients with nontransmural perfusion defect.37 In addition, the impact of scar on the long-term outcome of CRT patients has been reported.38 A cohort of 380 nonischemic heart failure patients and 190 ischemic heart failure patients underwent baseline 201Tl rest myocardial perfusion imaging before CRT and were followed for a median 1.9 years (range 2 days to 10 years).38 Scar content was determined for each of 17 segments (0=normal tracer uptake to 4=absent uptake) and combined to generate the summed scar score.38 Ischemic heart failure patients with a high burden of scar (score ≥27) had significantly worse outcome than nonischemic heart failure patients (P<.001) and ischemic heart failure patients with a lower scar burden (scar score < 27) (P=.002).38
Myocardial viability has also been assessed with positron emission tomography in patients treated with CRT.39 In 61 ischemic heart failure patients who underwent positron emission tomography prior to CRT implantation, the number of total viable segments (tracer activity >75%) was directly related to the absolute change in LVEF 6 months after CRT (R=0.56; P<.05).39 An optimal cut-off value of 11 viable segments (potential of 17 segments) could adequately predict response 6 months after CRT (sensitivity 74% and specificity 87%).39
EchocardiographyPeak 2D speckle tracking systolic strain value has been used to identify myocardial scar tissue and viability.40 Higher strain values are associated with the presence of viable myocardium. Becker et al. demonstrated that 2-D speckle tracking strain imaging could differentiate transmural from nontransmural scar.40 For example, a cut-off value of 16.5% for peak radial speckle tracking strain could distinguish between transmural and nontransmural scar with a sensitivity and specificity of 70% and 71%, respectively.40 Furthermore, the use of 3D strain echocardiography has been validated against CMR for wall motion analysis in 32 patients.41 However, the value of 3D strain to assess viability and predict response to CRT in heart failure patients has not been reported yet.
LEFT VENTRICULAR LEAD POSITIONFinally, besides LV dyssynchrony and myocardial scar tissue, optimal position of the LV lead is also important to maximize the response rate and to provide survival advantage after CRT.7 The latest activated area of the LV has been proposed as the preferable location for LV lead placement as it provides the largest hemodynamic benefits.42 Real-time 3D echocardiography, 3D speckle tracking strain analysis and perfusion SPECT imaging have shown to accurately identify the site of latest mechanical activation. In a study of 58 patients undergoing CRT implantation, Becker et al. identified the sites of latest activation with real-time 3D echocardiography. An LV lead position concordant with the latest activated region of the LV was defined as optimal LV lead placement.43 Patients with an optimal site of implantation had statistically significant greater improvement in LV volumes, LVEF, and peak O2 consumption than patients with a non-optimal pacing site (P<.001 for all comparisons).43 Moreover, in a study including 95 patients treated with CRT, Boogers et al. demonstrated that patients with a concordance between the site of latest LV activation as assessed with SPECT myocardial perfusion imaging and the LV lead position experienced significant improvement in NYHA functional class, LV volumes, and LVEF (P<.05 between baseline and 6 months follow-up).44 In contrast, patients with discordant LV lead positions showed no significant functional improvement 6 months after CRT.44 Finally, a recent study has also reported on the feasibility of assessing the site of latest activation with 3D speckle tracking strain on 54 heart failure patients treated with CRT.22
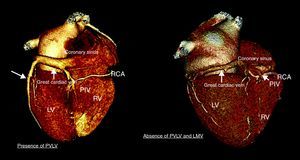
This cumulative evidence indicates that the LV lead should be placed at the site of latest activation. However, the venous anatomy might not be always suitable for such placement. Indeed, considerable interindividual anatomic variations of the coronary venous anatomy have been reported.45 Prior myocardial infarction could potentially explain such variations.8 In particular, in a series of 100 individuals evaluated with MDCT, van de Veire et al. showed that the posterior vein and the left marginal vein (commonly selected for placing the LV lead) were significantly less frequently observed in patients with history of myocardial infarction as compared to controls (26.5% vs 71.4%; P<.001) (Figure 6).8 Therefore, in addition to identifying the site of latest activation and optimal site of LV lead implantation, noninvasive evaluation of the cardiac venous anatomy with MDCT may be of interest in order to anticipate the presence of significant venous branch draining the targeted LV pacing area.46 Indeed, the role of a combined assessment of latest activation site with 3D echocardiographic modalities and coronary venous anatomy with MDCT venography prior to CRT implantation has been reported.46 In 21 heart failure patients who underwent 64-slice MDCT prior to CRT implantation, the site of latest mechanical activation was evaluated with tri-plane tissue synchronization imaging and the presence of a suitable venous anatomy at that area was assessed with MDCT.46 In 12 patients, the lead was positioned in the vein which drained (matched) the area of latest activation. These patients experienced a significant decrease in LV end-systolic volume (mean reduction of 26mL, 13.3%) and improvement in LVEF (mean increase 12%) after CRT, whereas patients with discordant LV lead position did not experience such improvements.46 Moreover, the patients with concordant LV position showed a significant decrease in LV dyssynchrony (43±7ms to 11±9ms, P<.0001) with reduction in LV end-systolic volume (188±54ml to 162±48ml, P<.01) and improvement in LVEF (22±9% to 34±9%, P<.01) within 72h after CRT implantation.46 In contrast, patients with a mismatch between the area of latest activation and the LV lead position remained dyssynchronous without improvement in LV function.46

Figure 6. Coronary venous anatomy for cardiac resynchronization therapy patients. Three-dimensional reconstruction of the coronary venous anatomy with multi-detector row computed tomography of 2 patients selected for cardiac resynchronization therapy. The left panel shows a suitable venous anatomy allowing optimal placement of the left ventricular lead. Conversely, the right panel shows absent left ventricular posterior vein and absent left marginal vein. LMV, left marginal vein; LV, left ventricle; PIV, posterior inter-ventricular vein; PVLV, posterior vein of the left ventricle; RCA, right coronary artery; RV, right ventricle.
Radiation exposure and the use of iodinated contrast agents are currently the main limitations for widespread use of MDCT. However, the implementation of tube modulation or sequential scanning has reduced significantly the effective radiation dose.47
THREE-DIMENSIONAL IMAGING TECHNIQUES: COMPREHENSIVE ASSESSMENT OF DETERMINANTS OF CARDIAC RESYNCHRONIZATION THERAPY RESPONSELV dyssynchrony, scar tissue, and LV lead site of implantation are the 3 main determinants of response and long-term outcome after CRT. Each of the determinants can be assessed with 3D imaging modalities, providing a comprehensive evaluation of candidates for CRT. For example, Bilchick et al. reported the accuracy of a combined CMR evaluation of scar tissue and LV dyssynchrony (the CURE index) to predict response to CRT.12 A CURE index value <0.75 and a scar volume ≤15% of the LV myocardial volume showed the highest accuracy (95%, P<.001) to identify the responders (positive predictive value [93%], negative predictive value [100%]).12 Finally, the assessment of combined determinants of response may provide further prognostic information on patients who are candidates to CRT. Accordingly, Leyva et al. developed a composite prognostic scoring system including CMR TSI LV dyssynchrony and posterolateral scar location.48 A group of 148 heart failure patients underwent prognostic scoring before CRT and were consequently followed-up for a median period of 913 days (interquartile range 967 days). The calculated score at baseline was a strong predictor of cardiovascular mortality. Moreover, compared to patients with the lowest score (score index < 3), patients with a high score (≥5) exhibited the highest risk of cardiovascular events (HR=30.5, 95%CI 9.15-101.8; P<.0001).48 Patients with intermediate scores (3 ≤ score <5) showed intermediate risk of cardiovascular events (HR=11.1, 95%CI 3.0-41.1, P=.003).48 Furthermore, the increased accuracy of an approach that combines the assessment of LV dyssynchrony, viability, and site of latest activation with 2D speckle tracking radial systolic strain to predict all cause mortality has recently been reported in 397 ischemic heart failure patients after CRT.34
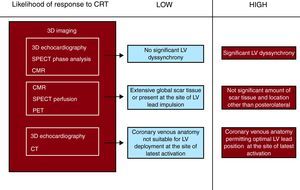
In light of this evidence, an ideal multimodalilty approach would combine the evaluation of LV dyssynchrony, optimal LV lead position (and coronary venous anatomy), and scar tissue for each patient to determine the likelihood of response.13, 14 Patients showing significant LV dyssynchrony, absence of scar tissue at the area targeted by the LV lead, low global scar tissue burden, and a venous anatomy which allows optimal LV lead placement (at the site of latest activation) would have the highest likelihood of response (Figure 7). Such an approach may translate into improved selection of CRT patients and permit a more individualized heart failure therapy.

Figure 7. Proposed multimodal approach to determine the individual likelihood of response to cardiac resynchronization therapy. 3D, 3- dimensional; CMR, cardiac magnetic resonance; CRT, cardiac resynchronization therapy; CT, computed tomography; LV, left ventricle; PET, positron emission tomography; SPECT, single photon emission computed tomography.
In this regard, recent advances in 3D imaging techniques have provided the possibility to comprehensively evaluate patients who may benefit from CRT. Temporal resolution, accurate and reproducible assessment of the 3 pathophysiological determinants of CRT response, and additional aspects, such as radiation exposure and costs, are important challenges to definitively implement these imaging techniques in routine clinical practice. Ongoing research will provide enough evidence to define the role of these imaging techniques in the patient selection process for CRT.
CONFLICTS OF INTERESTProfessor Schalij received grants from Biotronik, Medtronic, and Boston Scientific. Professor Bax received grants from Biotronik, Medtronic, Boston Scientific, BMS Medical Imaging, St. Jude Medical, Edwards Lifesciences, and GE Healthcare. Dr. Delgado received consulting fees from St. Jude Medical. Dominique Auger is financially supported by the “Programme de bourse de perfectionnement et de fellowship du Centre Hospitalier de l’Université de Montréal (CHUM) et de la Fondation du CHUM”.
Acknowledgements
The authors would like to thank J.J.M. Westenberg for kindly sharing illustrations used in Figure 5.
Corresponding author: Department of Cardiology, Leiden University Medical Centre, Albinusdreef 2, 2333 ZA Leiden, The Netherlands. v.delgado@lumc.nl