An increased epicardial adipose tissue (EAT) thickness has become a new risk factor for coronary heart disease (CHD). We aimed to study the role of EAT dysfunction as a CHD marker by focusing on its thickness and microRNA (miRNA) expression profile, and the potential factors possibly influencing them.
MethodsOne hundred and fifty-five CHD sudden cardiac death victims and 84 non–CHD-sudden death controls were prospectively enrolled at autopsy. A representative subset underwent EAT thickness measurements and EAT miRNA expression profiling.
ResultsEpicardial adipose tissue thickness was increased and allowed an accurate diagnosis of patient status (among other measurements, EAT score area under the curve 0.718, P < .001). Epicardial adipose tissue from patients showed 14 up- and 14 down-regulated miRNAs and miR-34a-3p, -34a-5p, -124-3p, -125a-5p, 628-5p, -1303 and -4286 were validated by quantitative real-time polymerase chain reaction. Patients exhibited higher EAT levels of miR-34a-3p and -34a-5p than controls (with a positive trend considering EAT from coronaries without stenosis, with stable stenosis and complicated plaques) and correlated with age only in controls. The mild positive correlation between liver and EAT miR-34a-5p levels in patients (r = 0.295, P = .020) dramatically increased in EAT from complicated plaques (r = 0.799, P = .017). Similar correlations were observed for high-sensitivity-C-reactive protein levels and miR-34a-5p levels both in EAT and liver extracts.
ConclusionsIncreased age-independent levels of miR-34a-3p and -34a-5p characterize the EAT miRNA expression profile of CHD regardless of EAT thickness, anthropometric parameters, and the presence of underlying atherosclerotic plaques.
Keywords
Sudden cardiac death (SCD) is the leading cause of adult sudden unexpected nontraumatic deaths in Western countries. It is usually the first manifestation of cardiovascular disease,1 with an estimated incidence of 1.40-6.68 per 100000 inhabitants per year.1 Coronary heart disease (CHD) is its most prevalent cause in industrialized countries, accounting for 60% to 80% of the SCDs.2,3
Epicardial adipose tissue (EAT) thickness has been recently proposed as a new cardiovascular risk factor.4–6 It is regarded as brown/beige adipose tissue and exhibits a particular transcriptomic activity including expression of proinflammatory and antifibrinolytic adipokines.7–10 It is located between the myocardium and the visceral pericardium, mostly concentrated along the main coronary arteries. Thus, its close spatial relationship with these structures provides the rationale for suspecting that either paracrinally or vasocrinally EAT could promote CHD and possibly its destabilization.11
Other ectopic fats, such as those associated with nonalcoholic fatty liver disease (NAFLD), have also been associated with cardiovascular risk factors, CHD, and cardiovascular events.12–15 Of note, NAFLD has been associated with EAT thickness16,17 and CHD17 but little is known about the underlying mechanisms, which remain independent from cardiovascular risk factors including metabolic syndrome.17
MicroRNAs (miRNAs) are small noncoding RNAs widely expressed in healthy and diseased tissues. They may play a key role both as effectors of deregulated pathways (amenable as therapeutic targets) and as useful biomarkers. Some of them have been related to dyslipidemia,18,19 adipogenesis,20,21 NAFLD (notably miR-34a22,23), and a wide range of cardiac disorders.24 Recently, 2 articles described a miRNA proinflammatory signature involving the insulin signaling pathway in the EAT from CHD patients.25,26 Very valuable and brand new data were reported but certain issues remained unexplored. One example is the variability of EAT miRNA expression depending on the presence and stability of atherosclerotic plaque. Another instance is the possibility that the increased EAT thickness could explain its increased miRNA levels in CHD patients. Our study aimed to fill these knowledge gaps to further characterize the distribution and depth of EAT and its miRNA expression profile as a marker of CHD in SCD victims. First, our patient group comprised not only stable but unstable coronary lesions. Second, in addition to miRNAs analyses, systematic EAT measurements were made to assess their correlation with CHD and miRNAs levels. Third, the EAT miRNA expression profiles were studied according to the presence/absence of underlying significant stenosis. Fourth, we studied the relationship between liver and EAT miR-34a-5p. Finally, the sample size of the present report consisted of at least twice as many individuals as previous studies.25,26
METHODSClinical GroupsOne hundred and fifty-five cases of SCD due to CHD (CHD-SCD, patients) and 84 cases of non-CHD unexpected sudden deaths (non-CHD-SD, controls) with negative toxicological studies were prospectively enrolled from 2008 to 2013. The definition of sudden death (SD) followed international recommendations.1 Coronary heart disease due to SCD autopsies identified at least 1 significant coronary stenosis (> 75%) and/or complicated plaques (with erosion, rupture, thrombosis and/or intraplaque hemorrhage) and/or acute or healed histologic signs of myocardial infarctions.27 Non–CHD-SD controls comprised 38 noncardiac SDs and 46 nonischemic SCDs (myocarditis and primary cardiomyopathies). Premortem clinical information, circumstances of death, autopsy examination including body mass index, abdominal circumference, heart and liver examination and routine toxicological analyses satisfied current guidelines.27
Our protocol conformed to the ethical guidelines of the 1975 Declaration of Helsinki and was approved by the human research committee of our institution. Patients and controls were dead at the time of enrollment and all the biological samples analyzed had been obtained at the forensic autopsy required by Spanish Laws in cases of out-of-hospital unexpected SDs. Thus, no written informed consent was obtained.
Analytical ParametersWhenever possible, analytical parameters were quantified in postmortem peripheral blood. Total cholesterol, triglycerides, and GGT were determined by enzymatic and high-density lipoprotein cholesterol with direct methods (Architect 16000 Abbott Diagnostic). When triglycerides were < 300mg/dL, low-density lipoprotein cholesterol was calculated with the Friedewald formula. Very low-density lipoprotein cholesterol was obtained from triglycerides/5. Lipoprotein(a) and apolipoprotein A and B were measured using kinetic nephelometry (Immage Nephelometer, Beckman Coulter Inc., Brea, California, United States) and high-sensitivity C-reactive protein levels with kinetic turbidimetric methods (Immage Nephelometer).
Epicardial Adipose Tissue ThicknessDuring the macroscopic examination of the heart, cross-sectional cuts were made at every 0.5cm starting at the apex, always parallel to the atrioventricular grooves, to register the maximal EAT thickness at each site (Figure 1 of the supplementary material). The total sum of the EAT thicknesses in each individual was termed EAT score, and was regarded as an estimate of the total amount of EAT in the heart.
Tissue Sample Collection for miRNA AnalysesEpicardial adipose tissue samples in patients were obtained mainly from coronary arteries with significant stenosis, some from the vicinity of complicated plaques and some from coronary arteries without stenosis, whereas in controls EAT extracts always came from coronary arteries without stenosis. Samples, immediately rinsed in cold phosphate-buffered saline to eliminate blood contamination, were stored in RNA later (Ambion, Austin, Texas, United States) at -20°C until their study. Fresh liver samples were collected and processed as previously described.15
RNA ExtractionTotal RNA was extracted from EAT using the mirVana-Paris miRNA isolation kit (Ambion), according to the manufacturer's protocol. The RNA concentration and purity were determined using a NanoDrop ND-1000 spectrophotometer (Nanodrop Technologies, Wilmington, Delaware, United States). Ribonucleic acid quality for miRNA expression arrays was assessed using the Agilent Bioanalyzer 2100 (Agilent Technologies, Santa Clara, California, United States).
miRNA Expression ProfilesRibonucleic acid for microarray analyses included 3 EAT samples of controls (in particular, 1 EAT sample next to the healthy left anterior descending artery from each control) and 3 EAT samples from patients (from coronary arteries with significant stable stenosis, in particular 2 from the left anterior descending artery and 1 from the right coronary artery). They were performed at the Array Service of our institution (Instituto de Investigación Sanitaria La Fe, Valencia, Spain) with the GeneChip miRNA 3.0 Array (Affymetrix, Santa Clara, California, United States), which contains probes of 1733 mature human miRNAs (miRBase version 17).
Data analysis was performed by using PARTEK Genomic Suite software (PARTEK, St. Louis, Missouri, United States) and normalized using a Robust Multiarray Analysis algorithm. A list of miRNAs with significant differences (± 1.5-fold change; P value < .05) between patients and controls was obtained. Bioinformatic tools (mirbase.org, microrna.org, targetscan.org, and Diana tools) enabled us to choose 7 miRNAs among those differently expressed, whose targets were involved in atherosclerosis, lipid metabolism, or adipocyte pathophysiology: miR-34a-3p, -34a-5p, -124-3p, -125a-5p, -628-5p, -1303 and -4286.
miRNA Quantification by Quantitative Real-time Polymerase Chain Reaction in Epicardial Adipose Tissue and Liver SamplesOur selected miRNAs were validated in 28 EAT samples from 28 controls and 186 EAT samples from 99 patients (1 EAT sample from a coronary artery with significant stable stenosis was collected in 78 patients, 1 EAT sample from a complicated plaque in the 21 remaining patients, and finally 1 EAT sample from a coronary artery without atherosclerotic plaques in 87 of the aforementioned patients). Since the levels of the small nuclear RNA RNU6B were highly variable in our real-time quantitative real-time polymerase chain reaction runs, we selected the miRNA-363-3p instead as endogenous control, with stable expression in our arrays and quantitative real-time polymerase chain reaction runs. Hepatic miR-34a-5p was quantified in liver samples from 23 controls and 62 patients from whom paired EAT samples had been obtained (1 EAT sample from a coronary artery without significant stenosis was collected in each of the 23 controls, 1 EAT sample from a coronary artery with a significant stable stenosis in 54 patients, 1 EAT sample from a complicated plaque in the 8 remaining patients, and finally 1 EAT sample from a coronary artery without atherosclerotic plaques in 55 of the aforementioned patients).
Quantitative real-time polymerase chain reaction quantifications were performed using miRCURY LNA Universal RT microRNA PCR (Exiqon, Vedbaek, Denmark) and a Light Cycler 480 II instrument (Roche Applied Science, Penzberg, Germany) following the manufacturer's instructions.
Statistical AnalysisQualitative variables are expressed as percentages and were compared with the chi-square test. Depending on the normality of the test, continuous variables are expressed as mean ± standard deviation, mean ± standard error of the mean or median and range [percentile 25-percentile 75] and were compared with the Student t test, ANOVA or the Mann-Whitney U test, where applicable. miRNA quantification is presented as fold change relative to the results obtained in EAT from healthy coronaries in controls. Correlations were determined using the Spearman rho test or the Pearson correlation coefficient, where applicable. To assess the performance of the classifiers, receiver operating characteristic curves were drawn. A P value < .05 was considered statistically significant. The statistical analyses were performed with the Statistical Package for the Social Sciences Release 20.0 for Windows (SPSS Inc., Chicago, Illinois, United States).
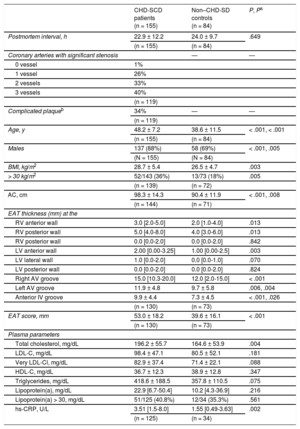
RESULTSStudy PopulationNo significant differences were observed in postmortem intervals. The general characteristics of patients and controls are presented in Table 1. Compared with controls, patients were older, mainly men and exhibited higher values for anthropometric values, total cholesterol, and high-sensitivity C-reactive protein. Complicated atherosclerotic plaques were seen in 34% of the patients and this situation was only associated with age (46.2 ± 8.4 vs 48.6 ± 6.1, for patients with and without complicated plaques, P = .002).
General Parameters in CHD-SCD Patients Versus Non–CHD-SD Controls
| CHD-SCD patients (n = 155) | Non–CHD-SD controls (n = 84) | P, Pa | |
|---|---|---|---|
| Postmortem interval, h | 22.9 ± 12.2 | 24.0 ± 9.7 | .649 |
| (n = 155) | (n = 84) | ||
| Coronary arteries with significant stenosis | — | — | |
| 0 vessel | 1% | ||
| 1 vessel | 26% | ||
| 2 vessels | 33% | ||
| 3 vessels | 40% | ||
| (n = 119) | |||
| Complicated plaqueb | 34% | — | — |
| (n = 119) | |||
| Age, y | 48.2 ± 7.2 | 38.6 ± 11.5 | < .001, < .001 |
| (n = 155) | (n = 84) | ||
| Males | 137 (88%) | 58 (69%) | < .001, .005 |
| (N = 155) | (N = 84) | ||
| BMI, kg/m2 | 28.7 ± 5.4 | 26.5 ± 4.7 | .003 |
| > 30 kg/m2 | 52/143 (36%) | 13/73 (18%) | .005 |
| (n = 139) | (n = 72) | ||
| AC, cm | 98.3 ± 14.3 | 90.4 ± 11.9 | < .001, .008 |
| (n = 144) | (n = 71) | ||
| EAT thickness (mm) at the | |||
| RV anterior wall | 3.0 [2.0-5.0] | 2.0 [1.0-4.0] | .013 |
| RV posterior wall | 5.0 [4.0-8.0] | 4.0 [3.0-6.0] | .013 |
| RV posterior wall | 0.0 [0.0-2.0] | 0.0 [0.0-2.0] | .842 |
| LV anterior wall | 2.00 [0.00-3.25] | 1.00 [0.00-2.5] | .003 |
| LV lateral wall | 1.0 [0.0-2.0] | 0.0 [0.0-1.0] | .070 |
| LV posterior wall | 0.0 [0.0-2.0] | 0.0 [0.0-2.0] | .824 |
| Right AV groove | 15.0 [10.3-20.0] | 12.0 [2.0-15.0] | < .001 |
| Left AV groove | 11.9 ± 4.8 | 9.7 ± 5.8 | .006, .004 |
| Anterior IV groove | 9.9 ± 4.4 | 7.3 ± 4.5 | < .001, .026 |
| (n = 130) | (n = 73) | ||
| EAT score, mm | 53.0 ± 18.2 | 39.6 ± 16.1 | < .001 |
| (n = 130) | (n = 73) | ||
| Plasma parameters | |||
| Total cholesterol, mg/dL | 196.2 ± 55.7 | 164.6 ± 53.9 | .004 |
| LDL-C, mg/dL | 98.4 ± 47.1 | 80.5 ± 52.1 | .181 |
| Very LDL-Cl, mg/dL | 82.9 ± 37.4 | 71.4 ± 22.1 | .088 |
| HDL-C, mg/dL | 36.7 ± 12.3 | 38.9 ± 12.8 | .347 |
| Triglycerides, mg/dL | 418.6 ± 188.5 | 357.8 ± 110.5 | .075 |
| Lipoprotein(a), mg/dL | 22.9 [6.7-50.4] | 10.2 [4.3-36.9] | .216 |
| Lipoprotein(a) > 30, mg/dL | 51/125 (40.8%) | 12/34 (35.3%) | .561 |
| hs-CRP, U/L | 3.51 [1.5-8.0] | 1.55 [0.49-3.63] | .002 |
| (n = 125) | (n = 34) | ||
AC, abdominal circumference; AV, atrioventricular; BMI, body mass index; CHD, coronary heart disease; EAT, epicardial adipose tissue; EAT score, total sum of the epicardial adipose tissue thickness measurements in each individual; HDL-C, high-density lipoproteins cholesterol; hs-CRP, high-sensitivity C-reactive protein; IV, interventricular; LDL-C, low-density lipoprotein cholesterol; LV, left ventricular; RV, right ventricular; SCD, sudden cardiac death; SD, sudden death.
Unless otherwise indicated, values are expressed as mean ± standard deviation or median [range].
Patients exhibited a thicker EAT than controls at different sites (Table 1). On adjustment in a multivariate model with age, sex, body mass index, and abdominal circumference, only EAT thickness at the left atrioventricular and the anterior interventricular grooves remained significantly increased. The thickest EAT was observed at the atrioventricular grooves in both groups.
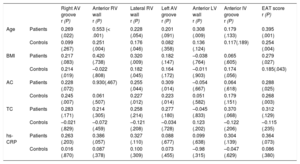
Epicardial adipose tissue thickness at each site significantly correlated with the total EAT score (Figure 2 of the supplementary material). At different sites of the right ventricle and atrioventricular grooves, EAT thickness often showed a mild positive correlation with age, body mass index and abdominal circumference, which was rare for EAT at left ventricular locations (Table 2).
Correlations Between EAT Measurements and Epidemiologic, Anthropometric and Analytical Parameters in CHD-SCD Patients (n = 130) and non–CHD-SD Controls (n = 73)
| Right AV groove r (P) | Anterior RV wall r (P) | Lateral RV wall r (P) | Left AV groove r (P) | Anterior LV wall r (P) | Anterior IV groove r (P) | EAT score r (P) | ||
|---|---|---|---|---|---|---|---|---|
| Age | Patients | 0.269 (.022) | 0.553 (< .001) | 0.228 (.054) | 0.201 (.091) | 0.308 (.009) | 0.179 (.133) | 0.395 (.001) |
| Controls | 0.099 (.267) | 0.251 (.004) | 0.176 (.046) | 0.082 (.358) | 0.136 (.124) | 0.117(.189) | 0.254 (.004) | |
| BMI | Patients | 0.217 (.083) | 0.420 (.738) | 0.320 (.009) | 0.182 (.147) | –0.038 (.764) | 0.065 (.605) | 0.279 (.027) |
| Controls | 0.214 (.019) | –0.022 (.808) | 0.182 (.045) | 0.164 (.172) | –0.011 (.903) | 0.174 (.056) | 0.185(.043) | |
| AC | Patients | 0.228 (.072) | 0.930(.467) | 0.255 (.044) | 0.309 (.014) | –0.054 (.667) | 0.064 (.618) | 0.288 (.025) |
| Controls | 0.245 (.007) | 0.061 (.507) | 0.227 (.012) | 0.223 (.014) | 0.051 (.582) | 0.179 (.151) | 0.268 (.003) | |
| TC | Patients | 0.283 (.171) | 0.214 (.305) | 0.258 (.214) | 0.277 (.180) | –0.045 (.833) | 0.370 (.068) | 0.312 (.129) |
| Controls | –0.021 (.829) | –0.072 (.459) | –0.121 (.208) | –0.034 (.728) | 0.123 (.202) | –0.122 (.206) | –0.115 (.235) | |
| hs-CRP | Patients | 0.263 (.203) | 0.386 (.057) | 0.327 (.110) | 0.088 (.677) | 0.099 (.638) | 0.304 (.139) | 0.364 (.073) |
| Controls | 0.016 (.870) | 0.087 (.378) | 0.100 (.309) | 0.073 (.455) | –0.98 (.315) | –0.047 (.629) | 0.086 (.380) |
AC, abdominal circumference; AV, atrioventricular; BMI, body mass index; CHD, coronary heart disease; EAT score, total sum of the epicardial adipose tissue thickness measurements in each individual; hs-CRP, high-sensitivity C-reactive protein; IV, interventricular; LV, left ventricular; RV, right ventricular; SCD, sudden cardiac death; SD, sudden death; TC, total cholesterol.
Statistical significance (P < .05) was assessed by Pearson correlation.
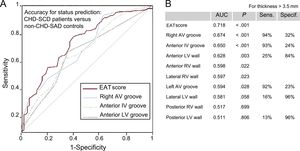
Epicardial adipose tissue thicknesses discriminated well between patients and controls (Figure 1). The best area under the curve was observed for the EAT score followed by the right atrioventricular groove and the anterior interventricular groove. They exhibited high sensitivity but low specificity for the cutoff of 3.5mm and inverse estimates were found for the anterior, posterior and lateral left ventricular walls.
 and non–CHD-SD controls (n = 73). A: only AUC with the most statistically significant P values and their reference line are shown. B: all AUC are listed with the most useful combination of sensitivity and specificity for each EAT measurement (cutoff point > 3.5mm). AUC, area under the curve; AV, atrioventricular; CHD, coronary heart disease; EAT, epicardial adipose tissue; EAT score, total sum of the EAT thickness measurements in each individual; IV, interventricular; LV, left ventricular; SCD, sudden cardiac death; SD, sudden death. Sens., sensitivity; Specif., specificity. Statistical significance (P < .05) was assessed by the receiver operating characteristic method.")
Accuracy of EAT measurements for status prediction in CHD-SCD patients (n = 130) and non–CHD-SD controls (n = 73). A: only AUC with the most statistically significant P values and their reference line are shown. B: all AUC are listed with the most useful combination of sensitivity and specificity for each EAT measurement (cutoff point > 3.5mm). AUC, area under the curve; AV, atrioventricular; CHD, coronary heart disease; EAT, epicardial adipose tissue; EAT score, total sum of the EAT thickness measurements in each individual; IV, interventricular; LV, left ventricular; SCD, sudden cardiac death; SD, sudden death. Sens., sensitivity; Specif., specificity. Statistical significance (P < .05) was assessed by the receiver operating characteristic method.
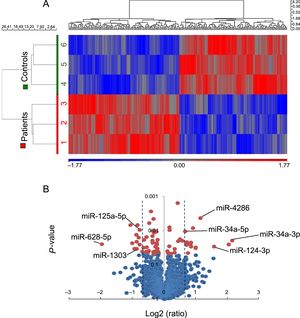
miRNA expression profile in patients and controls clustered separately (Figure 2A). Twenty-eight mature miRNAs were found to be significantly deregulated: 14 up- and 14 down-regulated in patients (Table 1 of the supplementary material). To validate these results, 7 miRNAs were selected among them regarding their potential targets (lipid metabolism, adipocyte physiopathology or other related pathways involved in atherosclerosis and plaque destabilization), namely miR-34a-3p, -34a-5p, -124-3p, -4286, -125a-5p, -628-5p, and -1303 (Figure 2B).
. B: Vulcano plot representing the magnitude of the changes of those miRNAs differentially expressed (± 1.5 fold change, P < .05, shaded lines). CHD, coronary heart disease; EAT, epicardial adipose tissue; miRNA, microRNA; SCD, sudden cardiac death; SD, sudden death. Statistical significance (P < .05) was assessed by ANOVA.")
miRNA expression profile in EAT samples from 3 CHD-SCD patients and 3 non–CHD-SD controls. A: unsupervised hierarchical clustering showing different miRNAs expression patterns (red for up-regulated miRNAs, blue for down-regulated miRNAs). B: Vulcano plot representing the magnitude of the changes of those miRNAs differentially expressed (± 1.5 fold change, P < .05, shaded lines). CHD, coronary heart disease; EAT, epicardial adipose tissue; miRNA, microRNA; SCD, sudden cardiac death; SD, sudden death. Statistical significance (P < .05) was assessed by ANOVA.
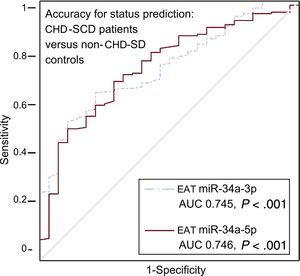
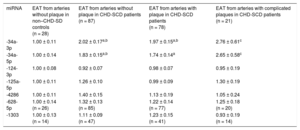
Higher levels of miR-34a-3p and -5p were found in EAT from patients than in controls, irrespective of the presence or absence of atherosclerotic plaques nearby (Table 3). When specifically addressed in patients, no differences were identified in any of the miRNAs analyzed regarding the presence or absence of coronary stenosis underneath. However, a trend toward a greater deregulation of miR-34a-3p and -34a-5p in EAT adjacent to complicated atherosclerotic plaques was observed (Table 3). The accuracy for prediction of the clinical group (patients vs controls) was statistically significant for EAT miR-34a-3p and -34a-5p (Figure 3).
Quantitative Real-time Polymerase Chain Reaction miRNA Levels in EAT Extracts From non–CHD-SD Controls and CHD-SCD Patients, in the Latter Attending to the Presence/absence of Underlying Stable Atherosclerotic Stenosis and Unstable Plaques
| miRNA | EAT from arteries without plaque in non–CHD-SD controls (n = 28) | EAT from arteries without plaque in CHD-SCD patients (n = 87) | EAT from arteries with plaque in CHD-SCD patients (n = 78) | EAT from arteries with complicated plaques in CHD-SCD patients (n = 21) |
|---|---|---|---|---|
| -34a-3p | 1.00 ± 0.11 | 2.02 ± 0.17a,b | 1.97 ± 0.15a,b | 2.76 ± 0.61c |
| -34a-5p | 1.00 ± 0.14 | 1.83 ± 0.15a,b | 1.74 ± 0.14a | 2.65 ± 0.58c |
| -124-3p | 1.00 ± 0.08 | 0.92 ± 0.07 | 0.98 ± 0.07 | 0.95 ± 0.19 |
| -125a-5p | 1.00 ± 0.11 | 1.26 ± 0.10 | 0.99 ± 0.09 | 1.30 ± 0.19 |
| -4286 | 1.00 ± 0.11 | 1.40 ± 0.15 | 1.13 ± 0.19 | 1.05 ± 0.24 |
| -628-5p | 1.00 ± 0.14 (n = 26) | 1.32 ± 0.13 (n = 85) | 1.22 ± 0.14 (n = 77) | 1.25 ± 0.18 (n = 20) |
| -1303 | 1.00 ± 0.13 (n = 14) | 1.11 ± 0.09 (n = 47) | 1.23 ± 0.15 (n = 41) | 0.93 ± 0.19 (n = 14) |
CHD-SCD, sudden cardiac death due to coronary heart disease; EAT, epicardial adipose tissue; miRNA, microRNA; non-CHD-SD, sudden death due to noncoronary heart disease causes.
Data are expressed as mean ± standard error of the mean. miRNA expression is presented as fold change relative to levels in EAT from arteries without plaque in non-CHD-SD controls.
Any group vs control:
 and non–CHD-SD controls (n = 28). ROC curves for miRNA with statistically significant results and their reference line are provided. AUC, area under the curve; CHD, coronary heart disease; EAT, epicardial adipose tissue; miRNA, microRNA; ROC, receiver operating characteristic; SCD, sudden cardiac death; SD, sudden death. Statistical significance (P < .05) was assessed by the ROC method.")
Accuracy of EAT miRNA-34a-3p and miRNA-34a-5p levels for status prediction in CHD-SCD patients (n = 186) and non–CHD-SD controls (n = 28). ROC curves for miRNA with statistically significant results and their reference line are provided. AUC, area under the curve; CHD, coronary heart disease; EAT, epicardial adipose tissue; miRNA, microRNA; ROC, receiver operating characteristic; SCD, sudden cardiac death; SD, sudden death. Statistical significance (P < .05) was assessed by the ROC method.
Only in the control group, EAT miR-34a-3p and -34a-5p significantly correlated with age and miR-34a-3p, -34a-5p and -124-3p also correlated with the EAT score and several individual EAT thickness measurements (Table 2 of the supplementary material). No other potentially relevant (r > 0.5) and statistically significant correlations were observed in controls or patients.
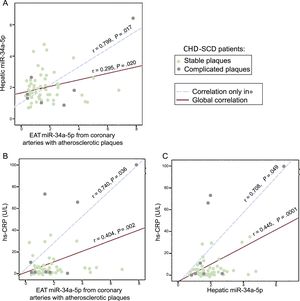
We previously reported increased hepatic miR-34a-5p levels in SD victims with CHD and/or NAFLD15 and in the present study we assessed them simultaneously in liver and EAT extracts of controls and patients. We found a mild and significant correlation between miR-34a-5p levels in liver and in EAT close to coronary stenosis in patients, which markedly increased in the subgroup of EAT samples from complicated plaques (Figure 4A). Furthermore, we explored the relationship of high-sensitivity C-reactive protein and miR-34a-5p assessed either in EAT samples or in liver specimens from the same patients (Figure 4B and C). Again, the mild significant correlations observed in the EAT adjacent to atherosclerotic plaques grew stronger when only EAT from complicated atherosclerotic plaques was analyzed. In contrast, no significant correlations were found in EAT from coronary arteries without stenosis from the same patients or in EAT from controls (data not shown).
. Epicardial adipose tissue was obtained from diseased coronary arteries. A: correlation between EAT and liver miR-34a-5p levels. B: correlation between EAT miR-34a-5p and hs-CRP levels. C: correlation between hepatic miR-34a-5p and hs-CRP levels. CHD, coronary heart disease; EAT, epicardial adipose tissue; SCD, sudden cardiac death; hs-CRP, high-sensitivity C-reactive protein. Statistical significance (P < .05) was assessed by Pearson correlations.")
Correlations between EAT and hepatic miR-34a-5p levels and between each of them and hs-CRP in CHD-SCD patients (n = 78). Epicardial adipose tissue was obtained from diseased coronary arteries. A: correlation between EAT and liver miR-34a-5p levels. B: correlation between EAT miR-34a-5p and hs-CRP levels. C: correlation between hepatic miR-34a-5p and hs-CRP levels. CHD, coronary heart disease; EAT, epicardial adipose tissue; SCD, sudden cardiac death; hs-CRP, high-sensitivity C-reactive protein. Statistical significance (P < .05) was assessed by Pearson correlations.
The series presented here confirms knowledge that CHD-SCD predominates in men who are older and exhibit a more unfavorable anthropometric profile (higher body mass index and abdominal circumference) compared with victims of non-CHD-SD. More importantly, we have explored the role of EAT in CHD from a double innovative perspective, in terms of anatomical thickness and physiopathological effect mediated by miRNAs.
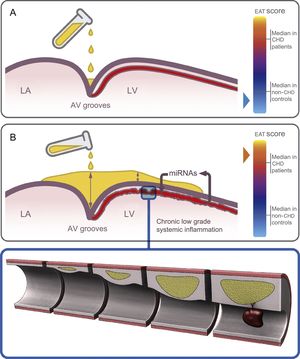
Epicardial adipose tissue thickness at different sites was significantly increased in patients compared with controls in the uni- and multivariate model even though some important analytical parameters (total cholesterol and high-sensitivity C-reactive protein levels) lost their statistical significance in the multivariate model (Table 1). We report, for the first time, a good accuracy of the postmortem EAT thickness in almost all locations to predict CHD as the cause of death (Figure 1). In keeping with previous knowledge,4 we suggest that fat does not homogeneously accumulate in the heart; indeed deposits predominate at the AV grooves, where there is more room to be filled (Figure 5). However, the finding of EAT on the left ventricular surface outside the grooves is clearly abnormal. Thus, we found high sensitivity with low specificity for EAT thickness at the AV grooves and opposite estimates for EAT thickness at the left ventricular surface (Figure 1), in keeping with previous echocardiographic reports.28
 but also on the anterior interventricular groove and the LV surface in a CHD patient, with a high EAT score. Chronic low-grade systemic inflammation induces an altered miRNA expression profile in the EAT surrounding coronary arteries which promotes atherosclerosis and destabilization of the plaques. AV, atrioventricular; CHD, coronary heart disease; EAT, epicardial adipose tissue; EAT score, total sum of the EAT thickness measurements in each individual; LA, left atrium; LV, left ventricular; RV, right ventricular.")
Hypothesis for the region-dependent EAT accumulation and its role in the heart. Fat deposits start at the grooves and then extend to the RV and finally LV surfaces. A: schematic view of the initial EAT deposition at the AV grooves in a control, with a low EAT score. B: at an advanced deposition stage, EAT accumulates not only at the grooves (with a maximal depth) but also on the anterior interventricular groove and the LV surface in a CHD patient, with a high EAT score. Chronic low-grade systemic inflammation induces an altered miRNA expression profile in the EAT surrounding coronary arteries which promotes atherosclerosis and destabilization of the plaques. AV, atrioventricular; CHD, coronary heart disease; EAT, epicardial adipose tissue; EAT score, total sum of the EAT thickness measurements in each individual; LA, left atrium; LV, left ventricular; RV, right ventricular.
The chronic low-grade inflammation that characterizes CHD may induce a different miRNA expression profile in EAT.29,30 To our knowledge, only 2 studies have assessed the role of EAT miRNAs in stable CHD based on a reduced number of samples obtained during bypass grafting or valvular heart surgery.25,26 Each study identified a specific miRNA profile in CHD patients but no correlations with EAT thickness and no subanalyses concerning the stability of the plaques underlying EAT were performed. Like other authors,31 we obtained good-quality postmortem EAT samples. Our results confirm that CHD is associated with a deregulated miRNA EAT expression pattern (Figure 2). Gross differences in the setting of our study and the 2 previous ones25,26 explain the differences in the identified miRNAs. Our series shows for the first time that the linear association in controls between EAT thickness and age with miRNAs levels is lost when CHD is established (Table 2 of the supplementary material). The shift in miRNA profile may probably be gradual due to the increasing levels of miR-34a-3p and -34a-5p in EAT from healthy coronary arteries of controls, from patients without stenosis, surrounding stable stenosis or complicated plaques (without statistical differences in the 2 latter groups, Table 3). Thus, we have proven that whenever EAT changes toward a more unfavorable profile, the miR34a-3p and -34a-5p levels increase so much that age and EAT thickness eventually lose their previous influence on them. Furthermore, we suggest that miRNA deregulation in EAT might precede CHD development in the underlying coronary arteries, as a sign of a latent systemic disease because EAT from coronary arteries without significant stenosis in patients was also altered in comparison with controls (Table 3, Figure 5).
Diabetes mellitus was not included in the multivariate model. One reason is that it was not available from the forensic files. In addition, glycemia in the biochemical study was not sufficiently accurate (it depends on the time lapse from the last meal, highly variable in SD victims). Hyperglycemia-induced alteration in miRNA EAT expression profile has been recently reported,32,33 and we acknowledge that our differences in miRNA expression profile could partially be due to differences in glycemic metabolism.
The reduced number of patients with complicated plaques precludes firm conclusions but definitely points toward EAT miRNA expression as another player in the destabilization of atherosclerotic plaques. New prospective studies focusing on complicated plaques will overcome this limitation.
Finally, as a step further in our previous observations,15 our novel finding of a positive correlation between miR-34a-5p levels in EAT and liver samples from patients and of both with high-sensitivity C-reactive protein levels, supports the deleterious effect of systemic inflammation as a promoter of NAFLD and CHD and may also help to explain the mechanism by which inflammation triggers destabilization in atherosclerotic coronary plaques (Figure 4).
CONCLUSIONSIn brief, EAT thickness is increased in CHD-SCD victims, does not correlate with analytical parameters and, when located on the left ventricular surface, exhibits good specificity for the identification of CHD and poorly correlates with age and anthropometric variables. This tissue displays a deregulated miRNA expression profile in CHD patients, which is thickness-independent, also affects EAT from coronary arteries without stenosis, and parallels systemic inflammation supporting the concept of atherosclerosis as a systemic disease. Finally, a trend toward greater deregulation close to complicated plaques warrants confirmation in the future.
FUNDINGThis work was supported by grants from the Instituto de Salud Carlos III, European Regional Development Funds “European Union. A way of making Europe” (RD12/0042/0029, PI14/01477 and La Fe Biobank PT17/0015/0043), and “Premio Borrasca” (Sociedad Española de Trombosis y Hemostasia). A. Braza-Boïls is supported by Roche “Stop Brain Drain”-Instituto de Investigación Sanitaria La Fe (2017/0055) and J. Marí-Alexandre by a Fundación Española de Trombosis y Hemostasia-2016 Grant.
CONFLICTs OF INTERESTNone declared.
- –
Epicardial adipose tissue may change its metabolic behavior under pathogenic circumstances. Coronary arteries are surrounded by EAT. An increased EAT thickness and also the presence of NAFLD have emerged as new cardiovascular risk factors for CHD, although the precise underlying mechanisms remain unknown. miRNAs regulate physiologic and pathologic pathways. Liver miR-34a-5p is up-regulated when NAFLD and/or CHD is present.
- –
The miRNA expression profile in EAT from CHD-SCD victims is deregulated. The high miR-34-3p and -34-5p levels observed in patients are not related to age, EAT thickness or anthropometric parameters and show a positive trend considering EAT from coronary arteries with increasing atherosclerotic burden. Patients exhibit a significant correlation of miR-34a-5p levels in EAT and liver extracts, and also of high-sensitivity C-reactive protein and EAT miR-34a-5p, especially when EAT is close to a complicated plaque. More mechanistical studies focusing on the deleterious role of EAT in CHD promotion and destabilization are needed.
The authors thank José Ramón Sanz and the Asociación Valenciana de Cardiopatías Familiares y Muerte Súbita for their technical assistance.