To the Editor:
In patients with ventricular septal defect (VSD), estimating the ventricular gradient using a Doppler EKG is the normal method of measuring pressure within the right ventricle.1
However, cases of discrepancies between the pressure gradients taken using Doppler and hemodynamic studies have been reported, which is attributed to asynchrony in the pressure peaks of both ventricles.2 Another cause of discrepancy could be the pressure recovery phenomenon, which is well known in conjunction with aortic stenosis3 and is also described in experimental VSD,4 although not in real clinical cases.
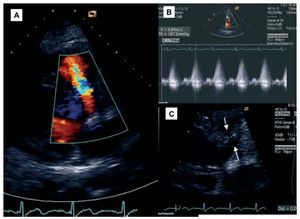
We present the case of a 44-year old patient examined because of dyspnea on exertion. The examination showed a blood pressure of 130/75 mm Hg and a systolic murmur IV/VI and thrills in the left sternal border. The EKG is taken during sinus rhythm, with a left axis orientation and normal QRS duration. In the echocardiogram, we can see a perimembranous VSD with a maximum flow velocity of 6.47 m/s, a ventricular gradient of 187 (maximum) and 86 (average) mm Hg and Qp/Qs of 3.05/1. The peak Q ejection period was 213 ms in the right ventricle and 193 ms in the left ventricle, with a difference of 20 ms. Detailed analysis of the 2-dimensional image identifies the VSD path as a tubular zone measuring 2.9´9 mm crossing the interventricular septum beneath the aortic root (Figure). The left ventricle was slightly dilated (59 mm) and showed normal tractility (ejection fraction =64%). The rest of the cavities were of normal dimensions and the valves did not show alterations. The catheterization confirmed the VSD, and an oxymetric gap of 12.1% was found between the right ventricle and the pulmonary artery. Pressures were normal (right ventricle, 25/5 mm Hg; pulmonary artery, 25/8 mm Hg; left ventricle, 140/5 mm Hg; aorta, 140/80 mm Hg) and Qp/Qs was 3/1. As a result, the ventricular gradient derived by catheter is 115 mm Hg, while the Doppler measurement is 187 mm Hg, and is probably overestimated due to the pressure recovery phenomenon.

Figure 1. Color Doppler images of the perimembranous location of VSD (A), its flow curve (B), and a close-up of anatomy with tubular path between the 2 arrows (C).
Such a high ventricular gradient in the Doppler study could be explained by: a) a pressure increase in the left ventricle (due to systemic arterial hypertension or an obstruction to ejection), which this patient did not present; b) a marked asynchrony between peak left and right ventricular pressures, which was also ruled out in this case; and c) a pressure recovery phenomenon, which is defined as a gradient increase near the distal zone of a stenosis by conversion of kinetic energy into potential energy. Its presence is related to the stenosis geometry, and tubular stenoses are prone to this effect.
Yoganathan et al4 described it in dogs with experimental VSD, but after reviewing the literature, we have not yet found described cases of patients with VSD who presented high ventricular gradients because of this phenomenon. Given that gradient "magnification" leads to underestimating the pressure in the right ventricle and pulmonary artery, we feel that our case, apart from being the first one described, could be important in clinical practice.
We therefore conclude that in the echocardiographic assessment of VSD, the ventricular gradient may underestimate right ventricular pressure if that ventricle is subject to the pressure recovery phenomenon. To avoid this from happening, it will be useful to consider this possibility and analyze all of the echocardiographic data.