In Spain, data based on large population-based cohorts adequate to provide an accurate prediction of cardiovascular risk have been scarce. Thus, calibration of the EuroSCORE and Framingham scores has been proposed and done for our population. The aim was to develop a native risk prediction score to accurately estimate the individual cardiovascular risk in the Spanish population.
MethodsSeven Spanish population-based cohorts including middle-aged and elderly participants were assembled. There were 11800 people (6387 women) representing 107915 person-years of follow-up. A total of 1214 cardiovascular events were identified, of which 633 were fatal. Cox regression analyses were conducted to examine the contributions of the different variables to the 10-year total cardiovascular risk.
ResultsAge was the strongest cardiovascular risk factor. High systolic blood pressure, diabetes mellitus and smoking were strong predictive factors. The contribution of serum total cholesterol was small. Antihypertensive treatment also had a significant impact on cardiovascular risk, greater in men than in women. The model showed a good discriminative power (C-statistic=0.789 in men and C=0.816 in women). Ten-year risk estimations are displayed graphically in risk charts separately for men and women.
ConclusionsThe ERICE is a new native cardiovascular risk score for the Spanish population derived from the background and contemporaneous risk of several Spanish cohorts. The ERICE score offers the direct and reliable estimation of total cardiovascular risk, taking in consideration the effect of diabetes mellitus and cardiovascular risk factor management. The ERICE score is a practical and useful tool for clinicians to estimate the total individual cardiovascular risk in Spain.
Keywords
.
INTRODUCTIONCurrent recommendations on the prevention of cardiovascular disease (CVD) in clinical practice encourage health workers to assess the individual's total CVD risk rather than focus on a specific CVD outcome alone.1
Several risk calculators are available in Europe and the United States2-5 but most of them have been only validated in middle-aged populations or in areas with a relatively high coronary heart disease (CHD) risk and they do not account for the effect of medications used for risk factor management.6–8 Although calibration of these foreign scores have been done in countries with lower CHD rates such as China and Spain and validated in the VERIFICA Study8. However, until now we did not have a native scale of cardiovascular risk based on the follow-up of large cohorts andderived from the same population where it will be later administered. In most of the Southern European countries, however, no sufficiently large population-based cohorts existed thus far to provide accurate and reliable estimates of the CVD risk by age and sex9. Furthermore, the impact of diabetes mellitus (DM) that is an important aspect to be considered in the CVD risk assessments has not been included in the available European risk scores leaving out the potential impact of DM when assessing CVD risk in clinical practice.2
The existing risk scores vary widely in terms of the background risk in study populations, predictors and outcomes considered (the Framingham score focuses on the CHD incidence and the SCORE (Systematic COronary Risk Evaluation) function on CVD mortality rather than the total CVD risk). Most can be used up to the age of 75 years. The scores do not take into account the possible effects of pharmacological risk factor management in the study population and will therefore underestimate the actual cardiovascular risk. The SCORE function does not include DM as a risk factor, and the Framingham algorithm underestimates its impact.
In addition, most of the existing scores were derived from cohorts of primarily middle-aged people at baseline, leaving older persons underrepresented. For example, the SCORE function concentrates on middle-aged people and is only recommended for use in the age range of 40 to 65 years.4 The estimation of cardiovascular risk in people >70 years is problematic because the predictive power of classical CVD risk factors decreases with age. For instance, the Framingham score seems to be of limited utility for elderly people, according to the Leiden 85-plus study, which showed a very poor discrimination, with the area under the curve in the receiver operating characteristics calculation only 0.53 (95% confidence interval [95%CI], 0.43-0.64)7
According to the guidelines of the Fourth Joint Task Force,2 it is important to develop a European CVD risk score adapted to specific geographical areas and to include individuals at older ages that will allow a more precise identification of asymptomatic individuals at high risk of CVD and a more effective implementation of the preventive interventions targeted to lower the total CVD risk. Hence, there is a place for a new CVD score that overcomes some of the limitations of previous tools.
The aim of this study is to develop a new CVD risk assessment tool that will accurately predict the individual risk of total CVD in the population of Spain.
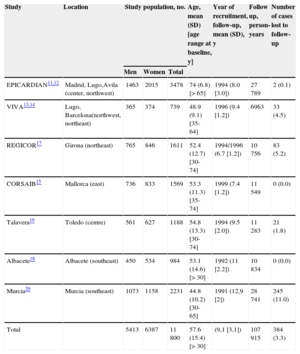
METHODSData SourcesThe ERICE (Ecuación de Riesgo Cardiovascular Española) project comprised seven population-based cohort studies in different geographical areas of Spain. The designs of the original studies have been detailed elsewhere.10–20 A collaborative database was created with the individual data from all participants in these 7 cohorts (Table 1).
Characteristics of the Cohorts Included in the ERICE Project
| Study | Location | Study population, no. | Age, mean (SD) [age range at baseline, y] | Year of recruitment, follow-up, mean (SD), y | Follow up, person-years | Number of cases lost to follow-up | ||
|---|---|---|---|---|---|---|---|---|
| Men | Women | Total | ||||||
| EPICARDIAN11,12 | Madrid, Lugo,Avila (center, northwest) | 1463 | 2015 | 3478 | 74 (6.8) [> 65] | 1994 (8.0 [3.0]) | 27789 | 2 (0.1) |
| VIVA13,14 | Lugo, Barcelona(northwest, northeast) | 365 | 374 | 739 | 48.9 (9.1) [35-64] | 1996 (9.4 [1.2]) | 6963 | 33 (4.5) |
| REGICOR17 | Girona (northeast) | 765 | 846 | 1611 | 52.4 (12.7) [30-74] | 1994/1996 (6.7 [1.2]) | 10756 | 83 (5.2) |
| CORSAIB15 | Mallorca (east) | 736 | 833 | 1569 | 53.3 (11.3) [35-74] | 1999 (7.4 [1.2]) | 11549 | 0 (0.0) |
| Talavera19 | Toledo (centre) | 561 | 627 | 1188 | 54.8 (13.3) [30-74] | 1994 (9.5 [2.0]) | 11283 | 21 (1.8) |
| Albacete18 | Albacete (southeast) | 450 | 534 | 984 | 53.1 (14.6) [> 30] | 1992 (11 [2.2]) | 10834 | 0 (0.0) |
| Murcia20 | Murcia (southeast) | 1073 | 1158 | 2231 | 44.8 (10.2) [30-65] | 1991 (12,9 [2]) | 28741 | 245 (11.0) |
| Total | 5413 | 6387 | 11800 | 57.6 (15.4) [> 30] | (9,1 [3,1]) | 107915 | 384 (3.3) | |
Vital status was ascertained for 100% of participants.
Lost to follow-up was considered when there was no information about the vital status when the cohort was closed.
Unless otherwise indicated, data are expressed as No. (%) or mean (standard deviation).
The studies had to meet the following criteria: single or multicenter surveys of general adult population of both sexes aged ≥20 years; a clear description of the target population and the sampling methods, a random selection of participants, an adequate participation in the baseline survey (>60%), a sufficiently long follow-up, a small number of participants lost to follow-up, a description of standardized measurement of clinical variables (blood pressure, blood lipids, smoking, and fasting plasma glucose) and a reliable method of assessing CVD events during the follow-up. In this analysis, only individuals aged ≥30 years and free of clinical CVD at baseline were included.
Measurement and Definition of Cardiovascular Risk FactorsThe CVD risk factors were assessed at baseline examination. The final common database included the following study variables: age, sex, place of residence, body mass index, systolic blood pressure (SBP), diastolic blood pressure, cigarette consumption, total serum total cholesterol (TC), fasting or random glucose, and personal history of hypertension, hypercholesterolemia, DM, and drug treatment for hypertension, hypercholesterolemia, and DM. Whole blood and capillary glucose values were converted to plasma values using the formula proposed by Carstensen et al.21 For the development of Cox models, the independent variables were categorized as follows: age was grouped in 10-year categories except for women <50 years, because there were few cardiovascular events in this age- group. Systolic blood pressure was categorized: <140mmHg; 140-159mmHg; 160-179mmHg; ≥180mmHg. Categories for TC were: <5.2mmol/L, 5.2-6.4mmol/L, 6.5-7.7mmol/L and ≥7.8mmol/L. The smoking status was categorized as nonsmokers and smokers (including exsmokers who had stopped smoking <6 months earlier and those who smoked at baseline).
Hypertension was considered when SBP≥140mmHg or diastolic blood pressure ≥90mmHg or treatment with antihypertensive drugs.22 Hypercholesterolemia was considered when TC≥5.1mmol/L or treatment with lipid-lowering drugs.23 Diabetes mellitus was defined as fasting venous plasma glucose ≥7.0mmol/L, random capillary glucose ≥11.1mmol/L or treatment with oral antidiabetic drugs or insulin at baseline. Body mass index was calculated for each individual using the formula of weight in kilograms divided by the square of height in meters, and obesity was defined as body mass index ≥30.
Follow-up and Cardiovascular EventsInformation on CVD events was collected by searching all potential sources (primary care and hospital records, interviews with general practitioners, National Institute of Statistics, mailings, and phone calls to the participants or their relatives). The date and cause of death of each deceased individual in the cohort was also confirmed through the Spanish National Death Index and the mortality registries of each autonomic community.
Cardiovascular Disease Event RegistrationUsing the International Classification of Diseases (ICD-9 and ICD-10), causes of death were defined as CHD (ICD-9: 410-414, ICD-10: I20-I25), cerebrovascular disease (ICD-9: 430-434, 436-438; ICD-10:I58-I61), and other potential cardiovascular conditions (ICD-9: 797-799; ICD-10: I46, R96, R98, I50).
Cardiovascular Disease Event ClassificationCoronary events were classified following the World Health Organization MONICA Project24 algorithm adapted by the REGICOR.25 Cerebrovascular cases were classified following the MONICA stroke study algorithm.26
Cardiovascular disease is a composite of first “hard” coronary event (definite fatal and nonfatal myocardial infarction and possible fatal myocardial infarction) or cerebrovascular event (including acute ischemic stroke and other nondetermined stroke events).
Statistical MethodsFor the description of the selected data, arithmetic mean (standard deviation) was used when the variables were continuous and relative frequency distribution when categorical. For comparison of proportions, the Pearson chi-square test and the Sommer D were used in the case of ordinal variables. For group comparison, the Student-Fisher t test was used in the case of independent binary measures and analysis of variance for variables of more than 2 categories.
Multivariate Models and Estimation of General Cardiovascular Disease Risk FunctionsTo analyze the association between each independent variable collected (age, sex, SBP, diastolic blood pressure, smoking, DM, TC, serum high-density lipoprotein cholesterol, and triglycerides) and the outcome variables, both bivariate and multivariate analyses were performed. Due to the precise data available about risk factor treatments, modeling the impact of a participant's SBP or TC levels with or without pharmacological treatment for these two risk factors was possible.
Cox regression analyses were conducted to identify and examine the contributions of the different variables for CVD as the potential basis for the ERICE-score. Coefficients independently associated with each potential risk factor for the first recorded CVD event were estimated separately for men and women. A Kaplan-Meier extrapolation of the first fatal or nonfatal CVD event during the 10-year period was performed to calculate the overall mean ERICE cumulative incidence of the CVD event. To estimate the survival function, analysis was performed using Kaplan-Meier method stratified by sex and age (≤70 years or >70 years). Cox models were also adjusted by the study cohort. Omnibus test was used to validate the model (P < .05). Sex-specific risk score sheets for CVD event prediction using categorical variables were developed from the β-coefficients of Cox proportional hazards models.
A graphical inspection of the proportionality of the hazard assumption was carried out. Possible violations of the proportional hazards assumption in Cox regression were assessed using graphical methods. In addition, the model assumptions were tested for compliance.
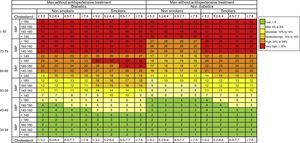
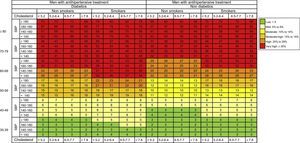
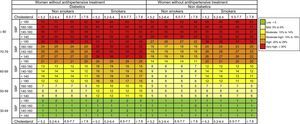
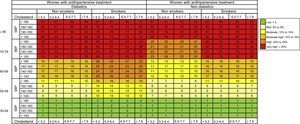
We split the ERICE score into 6 categories of total 10-year CVD risk: low risk: < 5%; mild risk: 5% to 9%; moderate risk: 10% to 14%; moderate-high risk: 15% to 19%; high risk: 20% to 29%, and very high risk: ≥ 30%.
EthicsOur research is in compliance with the Helsinki Declaration. All individual studies obtained informed consent of the participants at baseline examination, and all studies were approved by the local ethics committees.
RESULTSCharacteristics of the Study PopulationThere were 11 800 participants (5413 men and 6387 women) representing 107 915 person-years of follow-up. The median follow-up for the entire study was 9.1 years. A complete follow-up was reported in 11 416 people (96.7% of the total population; 5235 men and 6181 women). We were able to assess the vital status of 100% of cohort participants (Table 1).
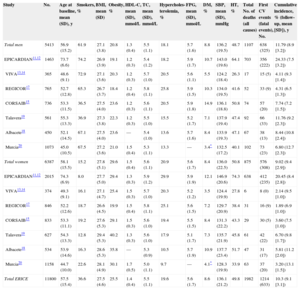
Table 2 shows the cardiovascular risk factors and events distribution by sex and study cohort. In total, 1214 CVD events occurred in the entire cohort during the 10-year follow-up period (638 in men and 576 in women), of which 633 were CVD deaths (325 in men and 308 in women). The distribution by sex of the CVD risk factor categories in the ERICE study is detailed in Table 1 of supplementary material. Variables such as diastolic blood pressure, body mass index, and lipid-lowering medication were not statistically associated with CVD (Table 2 of supplementary material), and there were only some participants with data available for triglycerides and high-density lipoprotein cholesterol (only one third of the participants).
Risk Factor Information and Events by Sex and Study Cohort
| Study | No. | Age at baseline, mean (SD), y | Smokers, % | BMI, mean (SD) | Obesity, % | HDL-C, mean (SD), mmol/L | TC, mean (SD), mmol/L | Hypercholes-terolemia, % | FPG, mean (SD), mmol/L | DM, % | SBP, mean (SD), mmHg | HT, % | Total No. of deaths (all causes) | First CV events (fatal events), No. | Cumulative incidence, % (follow-up, mean [SD]), y |
|---|---|---|---|---|---|---|---|---|---|---|---|---|---|---|---|
| Total men | 5413 | 56.9 (15.2) | 61.9 | 27.1 (3.8) | 20.8 | 1.3 (0.4) | 5.5 (1.1) | 18.1 | 5.7 (1.6) | 8.8 | 136.2 (19.5) | 48.7 | 1107 | 638 (325) | 11.79 (8.9 [3.2]) |
| EPICARDIAN11,12 | 1463 | 73.7 (6.6) | 74.2 | 26.9 (3.9) | 19.1 | 1.2 (0.3) | 5.4 (1.2) | 18.2 | 5.9 (1.7) | 10.7 | 143.0 (19.6) | 64.1 | 703 | 356 (222) | 24.33 (7.5 [3.2]) |
| VIVA13,14 | 365 | 48.6 (9.1) | 72.9 | 27.1 (3.6) | 20.3 | 1.2 (0.3) | 5.7 (1.0) | 20.5 | 5.6 (1.1) | 5.5 | 124.2 (18.4) | 26.3 | 17 | 15 (5) | 4.11 (9.3 [1.4]) |
| REGICOR17 | 765 | 52.7 (12.8) | 65.3 | 26.7 (3.7) | 18.4 | 1.2 (0.4) | 5.8 (1.1) | 25.8 | 5.9 (1.5) | 10.3 | 134.0 (19.5) | 41.6 | 52 | 33 (9) | 4.31 (6.5 [1.3]) |
| CORSAIB15 | 736 | 53.3 (11.5) | 36.5 | 27.5 (4.0) | 23.6 | 1.2 (0.3) | 5.6 (1.1) | 20.5 | 5.9 (1.8) | 14.9 | 136.1 (18.8) | 50.8 | 74 | 57 (20) | 7.74 (7.2 [1.5]) |
| Talavera19 | 561 | 55.3 (13.3) | 36.9 | 27.3 (3.8) | 22.3 | 1.2 (0.3) | 5.5 (1.0) | 15.5 | 5.2 (1.7) | 7.1 | 137.9 (19.4) | 47.4 | 92 | 66 (33) | 11.76 (9.2 [2.3]) |
| Albacete18 | 450 | 52.1 (14.5) | 67.1 | 27.5 (4.0) | 23.6 | — | 5.4 (1.0) | 13.6 | 5.7 (1.6) | 8.4 | 133.9 (19.3) | 47.1 | 67 | 38 (13) | 8.44 (10.8 [2.4]) |
| Murcia20 | 1073 | 45.0 (10.5) | 67.5 | 27.2 (3.6) | 21.0 | 1.5 (0.4) | 5.3 (1.1) | 13.3 | — | 3.4* | 132.5 (17.2) | 40.1 | 102 | 73 (23) | 6.80 (12.7 [2.3]) |
| Total women | 6387 | 58.1 (15.5) | 15.2 | 27.8 (5.1) | 29.6 | 1.5 (0.4) | 5.6 (1.1) | 20.9 | 5.6 (1.7) | 8.4 | 136.0 (22.5) | 50.8 | 875 | 576 (308) | 9.02 (9.4 [2.9]) |
| EPICARDIAN11,12 | 2015 | 74.3 (6.9) | 8.0 | 27.7 (5.0) | 29.4 | 1.3 (0.3) | 5.9 (1.2) | 29.9 | 5.9 (1.9) | 12.1 | 146.9 (20.6) | 74.3 | 638 | 412 (235) | 20.45 (8.4 [2.8]) |
| VIVA13,14 | 374 | 49.3 (9.1) | 16.1 | 27.1 (4.7) | 25.4 | 1.5 (0.3) | 5.7 (1.0) | 20.3 | 5.2 (1.2) | 3.5 | 124.4 (19.9) | 27.8 | 6 | 8 (0) | 2.14 (9.5 [1.0]) |
| REGICOR17 | 846 | 52.2 (12.6) | 18.7 | 26.6 (4.5) | 19.9 | 1.5 (0.4) | 5.8 (1.1) | 25.1 | 5.6 (1.5) | 7.2 | 129.7 (20.9) | 38.4 | 31 | 16 (9) | 1.89 (6.9 [1.0]) |
| CORSAIB15 | 833 | 53.3 (11.1) | 19.2 | 27.6 (5.3) | 29.1 | 1.5 (0.3) | 5.6 (1.0) | 19.4 | 5.5 (1.5) | 8.4 | 131.3 (22.2) | 43.3 | 29 | 30 (5) | 3.60 (7.5 [1.0]) |
| Talavera19 | 627 | 54.3 (13.3) | 12.8 | 29.4 (5.3) | 40.2 | 1.3 (0.3) | 5.6 (1.0) | 17.9 | 5.1 (1.7) | 7.3 | 135.7 (21.9) | 45.8 | 61 | 42 (22) | 6.70 (9.8 [1.7]) |
| Albacete18 | 534 | 53.9 (14.6) | 16.3 | 28.6 (5.3) | 35.8 | — | 5.3 (0.9) | 10.5 | 5.7 (1.9) | 10.9 | 137.7 (23.4) | 51.7 | 47 | 31 (17) | 5.81 (11.2 [2.0]) |
| Murcia20 | 1158 | 44.7 (10.0) | 22.6 | 28.1 (4.9) | 30.1 | 1.7 (0.5) | 5.0 (1.1) | 9.7 | — | 4.1* | 128.3 (19.9) | 33.9 | 63 | 37 (20) | 3.20 (13.1 [1.5]) |
| Total ERICE | 11800 | 57.5 (15.4) | 36.6 | 27.5 (4.6) | 25.5 | 1.4 (0.4) | 5.5 (1.1) | 19.6 | 5.6 (1.7) | 8.6 | 136.1 (21.2) | 49.8 | 1982 | 1214 (633) | 10.3 (9.1 [3.1]) |
BMI, body mass index; CV, cardiovascular; DM, diabetes mellitus; FPG, fasting plasma glucose; HDL-C, high-density lipoprotein cholesterol; SBP, systolic blood pressure; SD, standard deviation; HT, hypertension; TC, total cholesterol.
Hypertension: systolic blood pressure > 140 mmHg or diastolic blood pressure > 90 mmHg or antihypertensive treatment.
Diabetes mellitus: fasting plasma glucose > 7 mmol/L, random capillary glycaemia > 11 mmol/L or antidiabetic treatment.
Hypercholesterolemia: total cholesterol > 6.5 mmol/L or lipid-lowering treatment.
Obesity: body mass index > 30 kg/m2.
Unless otherwise indicated, data are expressed as mean (standard deviation).
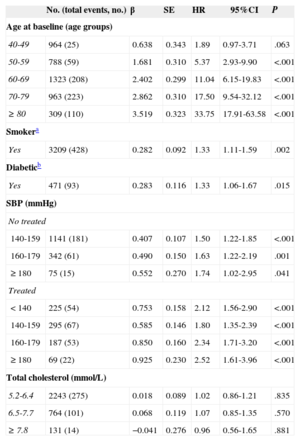
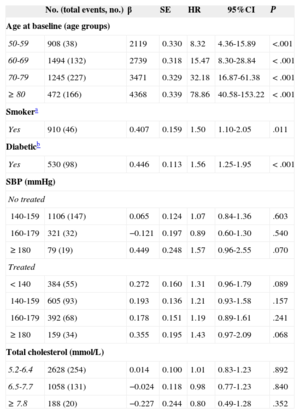
The multivariate adjusted hazard ratios (HR) of CVD for the different cardiovascular risk factors included in the final Cox model in men and women are shown in Tables 3 and 4. Antihypertensive drug treatment had a significant impact, greater in men than in women. Elevated serum cholesterol increased the risk of acute coronary event in men (HR=1.50; 95%CI, 1.02-2.19) and women (HR=3.64; 95%CI, 1.64-8.11) aged<70 years, but at older ages the risk did not increase. Elevated serum cholesterol did not significantly increase the risk of cerebrovascular disease.
Multivariate Cox Model for a First Fatal or Nonfatal Average 10-year Cardiovascular Event. Men
| No. (total events, no.) | β | SE | HR | 95%CI | P | |
|---|---|---|---|---|---|---|
| Age at baseline (age groups) | ||||||
| 40-49 | 964 (25) | 0.638 | 0.343 | 1.89 | 0.97-3.71 | .063 |
| 50-59 | 788 (59) | 1.681 | 0.310 | 5.37 | 2.93-9.90 | <.001 |
| 60-69 | 1323 (208) | 2.402 | 0.299 | 11.04 | 6.15-19.83 | <.001 |
| 70-79 | 963 (223) | 2.862 | 0.310 | 17.50 | 9.54-32.12 | <.001 |
| ≥ 80 | 309 (110) | 3.519 | 0.323 | 33.75 | 17.91-63.58 | <.001 |
| Smokera | ||||||
| Yes | 3209 (428) | 0.282 | 0.092 | 1.33 | 1.11-1.59 | .002 |
| Diabeticb | ||||||
| Yes | 471 (93) | 0.283 | 0.116 | 1.33 | 1.06-1.67 | .015 |
| SBP (mmHg) | ||||||
| No treated | ||||||
| 140-159 | 1141 (181) | 0.407 | 0.107 | 1.50 | 1.22-1.85 | <.001 |
| 160-179 | 342 (61) | 0.490 | 0.150 | 1.63 | 1.22-2.19 | .001 |
| ≥180 | 75 (15) | 0.552 | 0.270 | 1.74 | 1.02-2.95 | .041 |
| Treated | ||||||
| < 140 | 225 (54) | 0.753 | 0.158 | 2.12 | 1.56-2.90 | <.001 |
| 140-159 | 295 (67) | 0.585 | 0.146 | 1.80 | 1.35-2.39 | <.001 |
| 160-179 | 187 (53) | 0.850 | 0.160 | 2.34 | 1.71-3.20 | <.001 |
| ≥ 180 | 69 (22) | 0.925 | 0.230 | 2.52 | 1.61-3.96 | <.001 |
| Total cholesterol (mmol/L) | ||||||
| 5.2-6.4 | 2243 (275) | 0.018 | 0.089 | 1.02 | 0.86-1.21 | .835 |
| 6.5-7.7 | 764 (101) | 0.068 | 0.119 | 1.07 | 0.85-1.35 | .570 |
| ≥ 7.8 | 131 (14) | −0.041 | 0.276 | 0.96 | 0.56-1.65 | .881 |
95%CI, 95% confidence interval; HR, hazard ratio; SBP: systolic blood pressure; SE, standard error.
Category of reference: young (men 30-39 years old; women 30-49 years old), nonsmoker, nondiabetics, nontreated with antihypertensive drugs, systolic blood pressure<140mmHg, total cholesterol < 5.2 mmol/L.
Model was adjusted by the cohort effect.
Harrel C-statistic=0.792.
Multivariate Cox Model for a First Fatal or Nonfatal Average 10-year Cardiovascular Event. Women
| No. (total events, no.) | β | SE | HR | 95%CI | P | |
|---|---|---|---|---|---|---|
| Age at baseline (age groups) | ||||||
| 50-59 | 908 (38) | 2119 | 0.330 | 8.32 | 4.36-15.89 | <.001 |
| 60-69 | 1494 (132) | 2739 | 0.318 | 15.47 | 8.30-28.84 | < .001 |
| 70-79 | 1245 (227) | 3471 | 0.329 | 32.18 | 16.87-61.38 | < .001 |
| ≥ 80 | 472 (166) | 4368 | 0.339 | 78.86 | 40.58-153.22 | < .001 |
| Smokera | ||||||
| Yes | 910 (46) | 0.407 | 0.159 | 1.50 | 1.10-2.05 | .011 |
| Diabeticb | ||||||
| Yes | 530 (98) | 0.446 | 0.113 | 1.56 | 1.25-1.95 | < .001 |
| SBP (mmHg) | ||||||
| No treated | ||||||
| 140-159 | 1106 (147) | 0.065 | 0.124 | 1.07 | 0.84-1.36 | .603 |
| 160-179 | 321 (32) | −0.121 | 0.197 | 0.89 | 0.60-1.30 | .540 |
| ≥ 180 | 79 (19) | 0.449 | 0.248 | 1.57 | 0.96-2.55 | .070 |
| Treated | ||||||
| < 140 | 384 (55) | 0.272 | 0.160 | 1.31 | 0.96-1.79 | .089 |
| 140-159 | 605 (93) | 0.193 | 0.136 | 1.21 | 0.93-1.58 | .157 |
| 160-179 | 392 (68) | 0.178 | 0.151 | 1.19 | 0.89-1.61 | .241 |
| ≥ 180 | 159 (34) | 0.355 | 0.195 | 1.43 | 0.97-2.09 | .068 |
| Total cholesterol (mmol/L) | ||||||
| 5.2-6.4 | 2628 (254) | 0.014 | 0.100 | 1.01 | 0.83-1.23 | .892 |
| 6.5-7.7 | 1058 (131) | −0.024 | 0.118 | 0.98 | 0.77-1.23 | .840 |
| ≥ 7.8 | 188 (20) | −0.227 | 0.244 | 0.80 | 0.49-1.28 | .352 |
95%CI, 95% confidence interval; HR, hazard ratio; SBP: systolic blood pressure; SE, standard error.
Category of reference: young (men 30-39 years old; women 30-49 years old), nonsmoker, nondiabetics, nontreated with antihypertensive drugs systolic blood pressure<140mmHg, total cholesterol < 5.2 mmol/L.
Model was adjusted by the cohort effect.
Harrel C-statistic=0.819.
The entire model showed a good discriminative power (C-statistic=0.789 in men and C=0.816 in women). Score sheets were developed to predict CVD events in men and women from the β-coefficients of Cox proportional hazard models. Figures 1–4 show the 10-year risk of a fatal and nonfatal CVD event in men and women with and without antihypertensive treatment.


The ERICE-score is unique in being based on a large cohort of 11800 Spanish adults, covering a wide age range with uniform and harmonized baseline data. In contrast to previous scores such as the Framingham and EuroSCORE that were based on populations recruited before the 1990s, our estimates are based on more recent cohorts and offer different charts for individuals treated with antihypertensive drugs or not. The CVD incidence rates of this study stress the need of improving primary prevention measures, as more than half of the first CVD events resulted in death; the high case-fatality of coronary and stroke events is known also from previous studies.
Components of the Risk ScoreAge is the strongest predictor of CVD risk in both men and women. Despite the influence of age, favorable levels of all modifiable CVD risk factors assure a minimal CVD risk in a Mediterranean population aged <70 years.9
Our results show that a completely different pattern is observed between the two sexes with regard to modifiable cardiovascular risk factors. In men, high SBP is the strongest predictive CVD risk factor, followed by DM and smoking with similar impacts. In women, DM plays a crucial role, followed by smoking and very high SBP (>180mmHg). Antihypertensive drug treatment has a greater impact in men than in women. Contribution of high TC levels to the cardiovascular risk was small both in men and women. These results are in keeping with previous findings regarding the CVD risk in the Spanish population.27 Also, we confirm that it is important to derive the CVD prediction model in the same population where the risk score will be later administered.28
Comparison With Previous Risk EstimatesTo date, the CVD prediction charts used to predict a CVD event in Spain have relied on risk estimates based on American (REGICOR)5,29,30 or European (SCORE)7,31 populations, and the scores adapted for Spain have had important limitations as they came from small population samples, most of them based on occupational cohorts and geographically limited to the north east area of Spain.32–34 Another important limitation of previous estimates is that they are limited to CHD risk or CVD deaths. By calculating total CVD risk, we provide a better estimate of overall individual risk in a European region with low rates of CHD, such as Spain.
Moreover, previous estimates do not include DM at all or, as the Framingham algorithm, are based on a small number of DM people (4%, since diabetes at the time of the Framingham study's baseline data collection was not as common as more recently) and used its own definition of DM. ERICE-charts, following the recommendations of the Joint Task Force of the European Societies,1 include a representative number of people with DM and give separate risk charts for this risk factor.
Finally, the ERICE-charts uniquely include cells for individuals aged 70years to 79years and ≥80 years, since the cohort included a large proportion of people >75 years and accounted for the use of risk-factor-modifying drugs, which allows the resolution of a major gap in previous risk assessment tools.6 Nevertheless, estimating the 10-year mortality risk in people aged ≥ 80 years of limited use. In Europe, especially in the south, life expectancy is increasing markedly. Therefore, it is necessary to start to pay more attention to CVD risk in the very elderly. It has been shown that people aged ≥80 years will benefit from preventive interventions, such as antihypertensive drug treatment if hypertensive.35 Further analysis to explore 5-year risk estimation will be done in the near future, based on the elderly people included in this project. Other investigators also have started to develop risk scores in elderly cohorts.7
Limitations and StrengthsThe ERICE charts only consider the major CVD risk factors but, in practice, other factors (family history, high-density lipoprotein cholesterol, fibrinogen, physical exercise, waist circumference, etc.) can also modulate the CVD risk. People lost to follow-up were younger, and there were more smokers among female participants. No other significant differences in the distribution of risk factors were observed and thus the selection bias is minimal. High-density lipoprotein cholesterol measurement methods are different from one center to another, and this could have influenced the involvement of this factor in risk estimations. The Murcia cohort did not have data on blood glucose levels but information about drug treatment for DM was recorded. The predictive value of classical risk factors, such as hypercholesterolemia and systolic HT, weakens with age36,37, and absolute risk estimations in some cells, particularly in those groups of older adults with very high TC (>7.8mmol/L) and SBP, could be less accurate because of this fact and the lower number of individuals.
The study has several strengths. The sample size was large and recruited from different geographical areas of Spain (northern, central, and southern areas), and it covers a wide age range, including a large proportion of elderly people (>3000, 25.4% of the total sample) and also people with DM. Almost half of participants were under pharmacological risk factor management (antihypertensive or lipid lowering drugs) at baseline, representing the current situation of CVD risk factor treatment at the population level. The ERICE estimates the total CVD risk (CHD and stroke), and also includes DM as a risk factor along with age, smoking, SBP, and TC. The availability of information on cardiovascular risk factor treatment, particularly antihypertensive treatment, is another strength of this study, along with additional information useful for clinicians to adjust the estimated cardiovascular risk in those patients already under antihypertensive treatment.
The pooled ERICE cohort provides a new prospective analysis on the association between total CVD and several risk factors in Spain, a European country with a low incidence of CVD. The ERICE score allows the direct estimation of total CVD risk in Spain based on the risk estimation in the Spanish population, rather than being based on foreign scores calibrated for the low-risk European population. Such extrapolations may vary widely when a risk estimation formula is applied to a different population, and may not work properly.
Our results showed that the extent to which the effect of a specific risk factor, particularly TC, may need re-evaluation in the specific population to which it is going to be applied. It is expected that the internal validation of this risk score will be done in the near future. The external validation of the score in an independent Spanish cohort and the evaluation of its usefulness and impact compared with other existing scores, which deserved special attention in a recent issue of Revista Española de Cardiología,38,39 are the next steps to approach. Finally, while this article was under review another function of global cardiovascular risk was published that included the population aged 35 to 79 years.40
CONCLUSIONSAge was the strongest risk factor for CVD in both sexes, as was well known. In our study, high SBP was the strongest modifiable risk factor of CVD in men, followed by DM and smoking. In women, DM played a crucial role, followed by high SBP and smoking. The contribution of TC to the CVD risk was small in the Spanish population, and in both sexes when considering all age groups in this study. The ERICE offers a new CVD risk estimation system for the Spanish population derived, from the local and contemporary CVD risk factor assessment comprising several local cohort studies from different parts of the country. The ERICE score offers a direct estimation of the total CVD risk rather than specific outcomes such as CHD only, and highlights the importance of considering existing drug treatment for high cardiovascular risk factors, inclusion of elderly people and the diabetic status in the risk estimation. The ERICE score is a new, practical tool for clinicians in Spain to estimate the total CVD in their patients.
FUNDINGThis research was funded by the Fondo de Investigación Sanitaria, Instituto de Salud Carlos III, grants G03/065 and PI05/1464; and by RECAVA (Red Temática de Investigación Cooperativa en Enfermedades Cardiovasculares), grant RD06/0014/0015.
CONFLICTS OF INTERESTNone declared.
To Rosario Madero from Unidad de Bioestadística, IdiPAZ (Instituto de Investigación Sanitaria del Hospital Universitario La Paz), Hospital Universitario La Paz, Madrid and to Nuria Soriano from Centre d’Atenció Primària Sardenya, Barcelona for statistical assistance; to Margarita Alonso Arroyo from IdiPAZ, Madrid and Teresa R. Pérez Castro from Instituto Universitario de Ciencias de la Salud, Universidad de A Coruña for data management. To Ana Isabel Ortega for editorial assistance.
Supplementary material associated with this article can be found in the online version available at doi:10.1016/j.rec.2014.03.019.