The aim of this study was to determine the clinical characteristics of diabetes and associated cardiovascular risk factors in immigrants with diabetes in Spain.
MethodsA multicenter, observational, cross-sectional study including a cohort of 605 diabetic immigrants and 307 native diabetics was conducted in patients diagnosed with diabetes and treated in primary and specialized care in Spain. A consecutive sampling method was followed. We studied epidemiological, clinical and laboratory variables related to diabetes and the presence of classical risk factors.
ResultsThe immigrant diabetic patient was younger (50.4 [11.5] vs 62.7 [13] years) and had fewer years of diabetes progression (5.8 [6.4] vs 10.5 [8.3] years) (P<.001) compared with native diabetic patients. Immigrants from South America with diabetes were more obese. No statistically significant differences were found in abdominal obesity or the waist/height ratio. Glycemic control was worse in immigrants than in the native Spaniards group (glycosylated hemoglobin, 7.8 [2.2] vs 7.1 [1.5%]), especially among South Asians (8.1[2.5%]) (P<.001), in whom insulin use was lower (12.8% vs 30.7% in other immigrants) (P<.001). However, the prevalence of chronic complications of diabetes was lower among immigrants, particularly that of macrovascular complications (7.7% vs 24.4%) (P<.01).
ConclusionsIn our study the profile of immigrant diabetics in Spain is one of a young diabetic without complications, but with worse metabolic control. These findings provide an excellent opportunity to implement preventive measures.
Keywords
.
IntroductionThe prevalence of diabetes mellitus (DM) in Spain has steadily increased in recent decades1 and currently affects 13.8% of the adult population,2 thus constituting a serious health problem.3 The prevalence of this disease varies enormously in distinct areas of the world,4 which has been attributed to genetic and environmental factors.5
Patients with DM often have concomitant cardiovascular risk factors, such as hypertension, dyslipidemia or obesity. It has been established that the combined control of these cardiovascular risk factors reduces the incidence of the complications of DM and consequently the morbidity, mortality and costs associated with this disease.6–11
In the last decade, immigration has become one of the public health issues with the greatest impact in Spain. Currently, the immigrant population forms more than 10% of the total Spanish population.12 Providing health care to this population is a major challenge due to the cultural, socioeconomic, religious and linguistic issues involved. The phenomenon of immigration and the adaptation of ethnic minorities to the host culture can lead to an 8-fold increase in the prevalence of DM.5 In addition, studies have shown that diabetic immigrants from specific ethnic minorities may show different physiopathologies,13 have an increased association with some cardiovascular risk factors14 and be more susceptible to certain complications,13,15 either due to genetic predisposition, inadequate access to health care or differences in the quality of care.16–18
However, although there are local studies on specific aspects of DM,19,20 no national epidemiological survey has been conducted to provide data on DM in immigrants to Spain.
The aim of this study was to determine the clinical characteristics of DM and cardiovascular risk factors associated with immigrant diabetics in Spain.
MethodsA multicenter, observational, cross-sectional study was designed, which included a cohort of diabetic patients (immigrant or native) seen in primary and specialized care centers in Spain.
Study PopulationThe following inclusion criteria were applied: patients of both sexes; 18 years to 99 years of age; a diagnosis of any clinical form of DM; a blood test conducted in the last 6 months that included glucose, glycosylated hemoglobin (HbA1c), and creatinine values and lipid profile and informed consent to participate in the study.
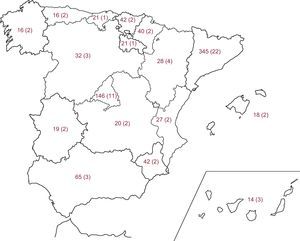
The sample size was determined according to the aim of the study. HbA1c level was considered to be the most relevant variable to detect differences among ethnic groups with DM. Assuming an alpha risk of 0.05 and a beta risk of 0.20 at a ratio of 2:1, a minimum of 590 immigrant diabetic patients and 295 native diabetic patients were required to detect a difference of ≥0.3 units in the HbA1c value (standard deviation of 1.5). This was increased by 20% in case of possible losses to follow-up. The final sample included 912 subjects (605 immigrants and 307 native Spaniards). The field researchers were primary care physicians who were members of the Network for the Study of Diabetes in Primary Care (redGDPS in Spanish) (n=61) and endocrinologists (n=5) working in areas with a large number of immigrants. All of the researchers voluntarily agreed to participate in the study. In total, the redGDPS has over 2000 members, most of whom are primary care physicians with an interest in DM. Each researcher was assigned to collect clinical information related to DM from 14 immigrant patients and 7 native patients. Once this figure was achieved, the doctors were free to include more patients. Consecutive patients were selected until the target number was reached in each group. No external audit was performed. Figure 1 shows the distribution of patients and researchers.
.")
Data were collected during a single visit to the doctor, based on the patient's clinical history and physical examination.
Study VariablesThe following data were collected from each patient: age, sex, country of origin, ethnic group, years of residence in Spain, clinical evidence of DM and its treatment, and anthropometric and clinical measurements, such as systolic and diastolic blood pressure. Data were recorded from the last blood test: blood glucose, HbA1c, lipid profile and renal function (creatinine and microalbuminuria). We also studied the presence and treatment of classical cardiovascular risk factors (hypertension, dyslipidemia and smoking).
Definition of the Main Variables- •
Immigrant. Defined as a person born in another country living in Spain. For the statistical analysis, 5 groups were defined: native Spaniards, Latin American, South Asian, North African and other ethnic group.
- •
Diabetes mellitus. A diagnosis of DM was given to patients who met the criteria of the American Diabetes Association (2004).21
- •
Hypertension. Defined according to the criterion of the Joint National Committee.22
- •
Dyslipidemia. A patient was diagnosed with dyslipidemia when low-density lipoprotein cholesterol (LDLc) levels were >100mg/dL or triglyceride levels were >150mg/dL or high-density lipoprotein levels were <50 mg/dL or the patient was receiving pharmacological treatment for dyslipidemia.23
- •
Obesity. A patient was diagnosed as obese when his or her body mass index (BMI) was ≥30. Abdominal obesity was defined as a waist circumference ≥102 cm for men and ≥88 cm for women.6
- •
Control of risk factors. A good level of control was established according to the criteria of the American Diabetes Association (2010).23 The following values were considered to indicate good control: hypertension, when blood pressure was <130/80 mmHg; dyslipidemia, when LDLc was <100 mg/dL, without a history of cardiovascular disease, and when LDLc was <70 mg/dL when cardiovascular disease was present; and hyperglycemia, when HbA1c was <7%.
- •
Macrovascular and microvascular complications. The medical records were studied to examine whether the patient had ischemic heart disease, stroke, peripheral arterial disease, retinopathy or diabetic nephropathy.
This study was conducted according to the recommendations of the Spanish Society of Epidemiology and the Council for International Organizations of Medical Sciences.24 The researchers obtained voluntary informed consent from the patients. The study was approved by the Clinical Research Ethics Committee of the IMIM-Hospital del Mar de Barcelona, Spain (Project number 2008/3176/I).
Statistical AnalysisThe statistical analysis was performed using SPSS for Windows. Quantitative variables were expressed as mean (standard deviation) and qualitative variables as frequencies and 95% confidence intervals. For the comparison of parameters, the appropriate hypothesis test was conducted in each case: analysis of variance (and Duncan test), Student t test or chi-square test and their nonparametric equivalents when needed, comparing the values obtained for each ethnic group with those of the native Spaniards group. A P-value of >0.5 was used as a cutoff for statistical significance. The analysis of metabolic control and the presence of macrovascular complications were adjusted for age by the direct method according to the population data provided by the Spanish National Institute of Statistics, since they significantly differed among the study groups.
ResultsThe final sample consisted of 912 patients: 307 native Spaniards and 605 immigrants. Of the immigrant group, 172 were from Latin America, 130 from South Asia, 204 from North Africa, and 99 from other countries (40 from East Europe, 24 from the sub-Saharan region, 23 from China, 8 from the rest of Europe, and 4 from the Philippines). Less than 5% of the total sample were lost to the study or refused to participate, without significant differences regarding age and sex compared with the rest of the sample.
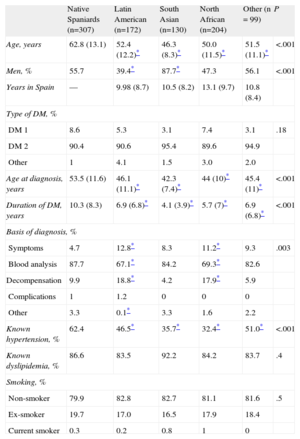
Table 1 shows the main demographic and clinical variables of the patients in the study. Regarding distribution by sex, men strongly predominated in the South Asian group (87.7%). The average age of the patients in the immigrant groups was significantly less than that of the native Spaniards patients (62.8 years). The average time of residence in Spain varied between 9.98 years (Latin American) and 13.1 years (North African). The immigrant patients were younger and had shorter DM duration. In total, 74.4% of Latin Americans, 90% of South Asians, 89.2% of North Africans, and 82.8% of other ethnic groups had been diagnosed with DM in Spain. Regarding risk factors, it is noteworthy that the immigrant group had a higher percentage of known hypertension (62.4%). No significant differences were found in the percentage of patients with known dyslipidemia or current smokers.
General Characteristics of the Patients in the Study.
| Native Spaniards (n=307) | Latin American (n=172) | South Asian (n=130) | North African (n=204) | Other (n = 99) | P | |
| Age, years | 62.8 (13.1) | 52.4 (12.2)* | 46.3 (8.3)* | 50.0 (11.5)* | 51.5 (11.1)* | <.001 |
| Men, % | 55.7 | 39.4* | 87.7* | 47.3 | 56.1 | <.001 |
| Years in Spain | — | 9.98 (8.7) | 10.5 (8.2) | 13.1 (9.7) | 10.8 (8.4) | |
| Type of DM, % | ||||||
| DM 1 | 8.6 | 5.3 | 3.1 | 7.4 | 3.1 | .18 |
| DM 2 | 90.4 | 90.6 | 95.4 | 89.6 | 94.9 | |
| Other | 1 | 4.1 | 1.5 | 3.0 | 2.0 | |
| Age at diagnosis, years | 53.5 (11.6) | 46.1 (11.1)* | 42.3 (7.4)* | 44 (10)* | 45.4 (11)* | <.001 |
| Duration of DM, years | 10.3 (8.3) | 6.9 (6.8)* | 4.1 (3.9)* | 5.7 (7)* | 6.9 (6.8)* | <.001 |
| Basis of diagnosis, % | ||||||
| Symptoms | 4.7 | 12.8* | 8.3 | 11.2* | 9.3 | .003 |
| Blood analysis | 87.7 | 67.1* | 84.2 | 69.3* | 82.6 | |
| Decompensation | 9.9 | 18.8* | 4.2 | 17.9* | 5.9 | |
| Complications | 1 | 1.2 | 0 | 0 | 0 | |
| Other | 3.3 | 0.1* | 3.3 | 1.6 | 2.2 | |
| Known hypertension, % | 62.4 | 46.5* | 35.7* | 32.4* | 51.0* | <.001 |
| Known dyslipidemia, % | 86.6 | 83.5 | 92.2 | 84.2 | 83.7 | .4 |
| Smoking, % | ||||||
| Non-smoker | 79.9 | 82.8 | 82.7 | 81.1 | 81.6 | .5 |
| Ex-smoker | 19.7 | 17.0 | 16.5 | 17.9 | 18.4 | |
| Current smoker | 0.3 | 0.2 | 0.8 | 1 | 0 | |
DM, diabetes mellitus.
Variables are expressed as mean (standard deviation). Percentages refer to the total number in each group.
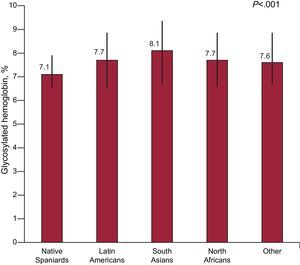
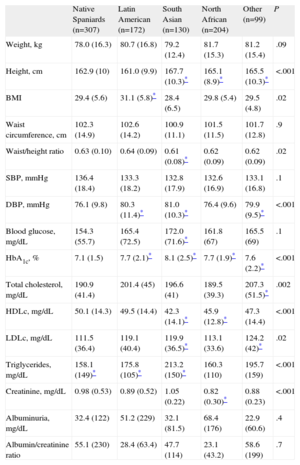
Table 2 shows the anthropometric and laboratory variables of metabolic control. Regarding obesity, the Latin American patients had the highest mean BMI value (31.1). No significant differences were found in weight or waist circumference measurements, although the waist/height ratio was lower among South Asians (0.61, P=.02). The degree of glycemic control, as assessed by HbA1c level, was significantly lower in the native Spaniards group than in the Latin American, South Asian, North African and other ethnic groups (7.1% vs 7.7%, 8.1%, 7.7%, and 7.6%, respectively), although it is noteworthy that the majority of mean values were below 8% (Fig. 2). Differences were also found in lipid profile, with the lowest cholesterol and triglyceride values in the native Spaniards and North African groups, the lowest high-density lipoprotein cholesterol values in the South Asian group, and the highest LDLc values in the other ethnic groups. Triglyceride levels were much higher in the South Asian group. Diastolic blood pressure followed a similar pattern to that of cholesterol and triglycerides, in that the lowest mean value was found in the native Spaniards and North African groups.
Metabolic Control of the Diabetic Population in Spain: Native Spaniards Compared with Immigrants.
| Native Spaniards (n=307) | Latin American (n=172) | South Asian (n=130) | North African (n=204) | Other (n=99) | P | |
| Weight, kg | 78.0 (16.3) | 80.7 (16.8) | 79.2 (12.4) | 81.7 (15.3) | 81.2 (15.4) | .09 |
| Height, cm | 162.9 (10) | 161.0 (9.9) | 167.7 (10.3)* | 165.1 (8.9)* | 165.5 (10.3)* | <.001 |
| BMI | 29.4 (5.6) | 31.1 (5.8)* | 28.4 (6.5) | 29.8 (5.4) | 29.5 (4.8) | .02 |
| Waist circumference, cm | 102.3 (14.9) | 102.6 (14.2) | 100.9 (11.1) | 101.5 (11.5) | 101.7 (12.8) | .9 |
| Waist/height ratio | 0.63 (0.10) | 0.64 (0.09) | 0.61 (0.08)* | 0.62 (0.09) | 0.62 (0.09) | .02 |
| SBP, mmHg | 136.4 (18.4) | 133.3 (18.2) | 132.8 (17.9) | 132.6 (16.9) | 133.1 (16.8) | .1 |
| DBP, mmHg | 76.1 (9.8) | 80.3 (11.4)* | 81.0 (10.3)* | 76.4 (9.6) | 79.9 (9.5)* | <.001 |
| Blood glucose, mg/dL | 154.3 (55.7) | 165.4 (72.5) | 172.0 (71.6)* | 161.8 (67) | 165.5 (69) | .1 |
| HbA1c, % | 7.1 (1.5) | 7.7 (2.1)* | 8.1 (2.5)* | 7.7 (1.9)* | 7.6 (2.2)* | <.001 |
| Total cholesterol, mg/dL | 190.9 (41.4) | 201.4 (45) | 196.6 (41) | 189.5 (39.3) | 207.3 (51.5)* | .002 |
| HDLc, mg/dL | 50.1 (14.3) | 49.5 (14.4) | 42.3 (14.1)* | 45.9 (12.8)* | 47.3 (14.4) | <.001 |
| LDLc, mg/dL | 111.5 (36.4) | 119.1 (40.4) | 119.9 (36.5)* | 113.1 (33.6) | 124.2 (42)* | .02 |
| Triglycerides, mg/dL | 158.1 (149)* | 175.8 (105)* | 213.2 (150)* | 160.3 (110) | 195.7 (159) | <.001 |
| Creatinine, mg/dL | 0.98 (0.53) | 0.89 (0.52) | 1.05 (0.22) | 0.82 (0.30)* | 0.88 (0.23) | <.001 |
| Albuminuria, mg/dL | 32.4 (122) | 51.2 (229) | 32.1 (81.5) | 68.4 (176) | 22.9 (60.6) | .4 |
| Albumin/creatinine ratio | 55.1 (230) | 28.4 (63.4) | 47.7 (114) | 23.1 (43.2) | 58.6 (199) | .7 |
BMI, body mass index; DBP, diastolic blood pressure; HbA1c, glycosylated hemoglobin; HDLc, high-density lipoprotein cholesterol; LDLc, low-density lipoprotein cholesterol; SBP, systolic blood pressure.
Variables are expressed as mean (standard deviation).

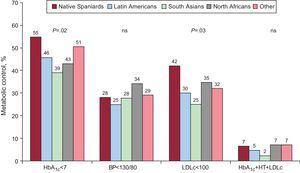
Figure 3 shows the percentages of patients with adequate control of the various factors assessed using the criteria of the American Diabetes Association (2010)23 and adjusted by age. There was a higher percentage of native Spaniards with adequate control of HbA1c and LDLc. When the degree of control of the 3 factors was analyzed as a group, no significant differences were found between native Spaniards and immigrants, although it was somewhat less in the South Asian group than in the native Spanish group (2.3% vs 6.5%, respectively).
. BP, blood pressure; HbA1c, glycosylated hemoglobin; HT, hypertension; LDLc, low-density lipoprotein cholesterol; ns, not significant.")
Metabolic control of diabetes mellitus adjusted by age according to the criteria of the American Diabetes Association (201023). BP, blood pressure; HbA1c, glycosylated hemoglobin; HT, hypertension; LDLc, low-density lipoprotein cholesterol; ns, not significant.
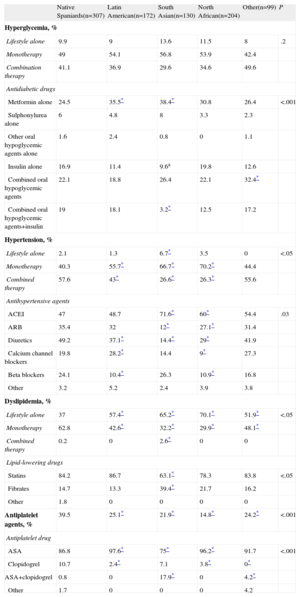
Table 3 shows the treatment of risk factors by ethnic group.
Diabetes Mellitus and the Treatment of Cardiovascular Risk Factors in Spain: Native Spaniards Compared With Immigrants.
| Native Spaniards(n=307) | Latin American(n=172) | South Asian(n=130) | North African(n=204) | Other(n=99) | P | |
| Hyperglycemia, % | ||||||
| Lifestyle alone | 9.9 | 9 | 13.6 | 11.5 | 8 | .2 |
| Monotherapy | 49 | 54.1 | 56.8 | 53.9 | 42.4 | |
| Combination therapy | 41.1 | 36.9 | 29.6 | 34.6 | 49.6 | |
| Antidiabetic drugs | ||||||
| Metformin alone | 24.5 | 35.5* | 38.4* | 30.8 | 26.4 | <.001 |
| Sulphonylurea alone | 6 | 4.8 | 8 | 3.3 | 2.3 | |
| Other oral hypoglycemic agents alone | 1.6 | 2.4 | 0.8 | 0 | 1.1 | |
| Insulin alone | 16.9 | 11.4 | 9.6a | 19.8 | 12.6 | |
| Combined oral hypoglycemic agents | 22.1 | 18.8 | 26.4 | 22.1 | 32.4* | |
| Combined oral hypoglycemic agents+insulin | 19 | 18.1 | 3.2* | 12.5 | 17.2 | |
| Hypertension, % | ||||||
| Lifestyle alone | 2.1 | 1.3 | 6.7* | 3.5 | 0 | <.05 |
| Monotherapy | 40.3 | 55.7* | 66.7* | 70.2* | 44.4 | |
| Combined therapy | 57.6 | 43* | 26.6* | 26.3* | 55.6 | |
| Antihypertensive agents | ||||||
| ACEI | 47 | 48.7 | 71.6* | 60* | 54.4 | .03 |
| ARB | 35.4 | 32 | 12* | 27.1* | 31.4 | |
| Diuretics | 49.2 | 37.1* | 14.4* | 29* | 41.9 | |
| Calcium channel blockers | 19.8 | 28.2* | 14.4 | 9* | 27.3 | |
| Beta blockers | 24.1 | 10.4* | 26.3 | 10.9* | 16.8 | |
| Other | 3.2 | 5.2 | 2.4 | 3.9 | 3.8 | |
| Dyslipidemia, % | ||||||
| Lifestyle alone | 37 | 57.4* | 65.2* | 70.1* | 51.9* | <.05 |
| Monotherapy | 62.8 | 42.6* | 32.2* | 29.9* | 48.1* | |
| Combined therapy | 0.2 | 0 | 2.6* | 0 | 0 | |
| Lipid-lowering drugs | ||||||
| Statins | 84.2 | 86.7 | 63.1* | 78.3 | 83.8 | <.05 |
| Fibrates | 14.7 | 13.3 | 39.4* | 21.7 | 16.2 | |
| Other | 1.8 | 0 | 0 | 0 | 0 | |
| Antiplatelet agents, % | 39.5 | 25.1* | 21.9* | 14.8* | 24.2* | <.001 |
| Antiplatelet drug | ||||||
| ASA | 86.8 | 97.6* | 75* | 96.2* | 91.7 | <.001 |
| Clopidogrel | 10.7 | 2.4* | 7.1 | 3.8* | 0* | |
| ASA+clopidogrel | 0.8 | 0 | 17.9* | 0 | 4.2* | |
| Other | 1.7 | 0 | 0 | 0 | 4.2 | |
ACEl, angiotensin-converting enzyme inhibitors; ARB, angiotensin-II receptor antagonists; ASA, acetylsalicylic acid.
Percentages refer to the total number in each group. A patient may have been taking more than 1 drug in the same therapeutic class.
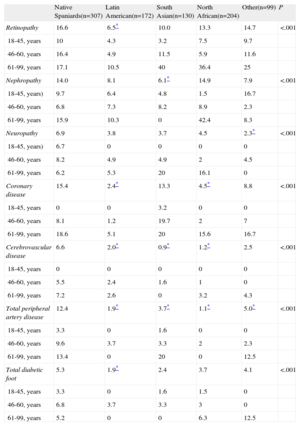
Finally, we studied the patients’ medical records for evidence of macrovascular and microvascular complications (Table 4). After adjusting for age, it was found that coronary disease was more prevalent in the native Spaniards (15.4%) and South Asian (13.3%) groups than in the other groups. The remaining complications were more common in the native Spaniards group than in the immigrant groups, even when adjusted for age: stroke (6.6%), peripheral arterial disease (12.4%) and heart failure (5.4%).
Prevalence of Chronic Complications of Diabetes Mellitus in Spain Adjusted by Age: Native Spaniards Compared With Immigrants.
| Native Spaniards(n=307) | Latin American(n=172) | South Asian(n=130) | North African(n=204) | Other(n=99) | P | |
| Retinopathy | 16.6 | 6.5* | 10.0 | 13.3 | 14.7 | <.001 |
| 18-45, years | 10 | 4.3 | 3.2 | 7.5 | 9.7 | |
| 46-60, years | 16.4 | 4.9 | 11.5 | 5.9 | 11.6 | |
| 61-99, years | 17.1 | 10.5 | 40 | 36.4 | 25 | |
| Nephropathy | 14.0 | 8.1 | 6.1* | 14.9 | 7.9 | <.001 |
| 18-45, years) | 9.7 | 6.4 | 4.8 | 1.5 | 16.7 | |
| 46-60, years | 6.8 | 7.3 | 8.2 | 8.9 | 2.3 | |
| 61-99, years | 15.9 | 10.3 | 0 | 42.4 | 8.3 | |
| Neuropathy | 6.9 | 3.8 | 3.7 | 4.5 | 2.3* | <.001 |
| 18-45, years) | 6.7 | 0 | 0 | 0 | 0 | |
| 46-60, years | 8.2 | 4.9 | 4.9 | 2 | 4.5 | |
| 61-99, years | 6.2 | 5.3 | 20 | 16.1 | 0 | |
| Coronary disease | 15.4 | 2.4* | 13.3 | 4.5* | 8.8 | <.001 |
| 18-45, years | 0 | 0 | 3.2 | 0 | 0 | |
| 46-60, years | 8.1 | 1.2 | 19.7 | 2 | 7 | |
| 61-99, years | 18.6 | 5.1 | 20 | 15.6 | 16.7 | |
| Cerebrovascular disease | 6.6 | 2.0* | 0.9* | 1.2* | 2.5 | <.001 |
| 18-45, years | 0 | 0 | 0 | 0 | 0 | |
| 46-60, years | 5.5 | 2.4 | 1.6 | 1 | 0 | |
| 61-99, years | 7.2 | 2.6 | 0 | 3.2 | 4.3 | |
| Total peripheral artery disease | 12.4 | 1.9* | 3.7* | 1.1* | 5.0* | <.001 |
| 18-45, years | 3.3 | 0 | 1.6 | 0 | 0 | |
| 46-60, years | 9.6 | 3.7 | 3.3 | 2 | 2.3 | |
| 61-99, years | 13.4 | 0 | 20 | 0 | 12.5 | |
| Total diabetic foot | 5.3 | 1.9* | 2.4 | 3.7 | 4.1 | <.001 |
| 18-45, years | 3.3 | 0 | 1.6 | 1.5 | 0 | |
| 46-60, years | 6.8 | 3.7 | 3.3 | 3 | 0 | |
| 61-99, years | 5.2 | 0 | 0 | 6.3 | 12.5 |
Values are shown as percentages of the total number in each group.
The aim of this study was to determine the clinical profile of DM in Spain by country of origin and ethnicity. Knowledge of DM among immigrants could help improve health care for these groups.
In the sample studied, the immigrant groups were younger than the native Spaniards group (by about 10 years), and men predominated (approximately 88%) in the South Asian group. Most members of the South Asian group were Muslim, and so the concept of health and prevention inherent to Islam has to be taken into account.25,26 This often hinders education on DM and preventative activities as they are understood in Spain.
Despite being younger, the immigrant groups, also had lower percentages of DM type 1 than the native Spaniards group. There were fewer older immigrants in the sample, since they do not usually migrate except to reunite with their families. This probably supports the concept of the “healthy immigrant”,27 since ill individuals tend not to migrate from their country of origin, given their reduced capacity to work. Thus, the individuals who emigrate are the healthiest and are fully able to work; poor living conditions in their destination country are the triggers of disease. In the case of DM, many authors have described the increased prevalence of DM in populations genetically predisposed to insulin resistance when they migrate and adopt unhealthy Western lifestyles.5
Further research is needed on certain characteristic phenotypes that barely differ among the immigrant groups and native Spaniards groups, with the exception of the greater mean BMI in the Latin American group. It has been commonly considered that South Asians have a greater waist circumference;28 however, this was not supported by our findings, not even when using the waist/height ratio to correct for some populations being shorter.
A notable finding was that the degree of metabolic control was acceptable in all the groups (mean values of HbA1c around 7%-8%). However, metabolic control was better in the native Spaniards group, probably because health professionals have less difficulty and more experience in dealing with this group of patients, as demonstrated by other Spanish studies that have comparable numbers of control subjects.29–31 This reaffirms the need to train health professionals to face new challenges, such as that described in the present case.
The pharmacologic treatment of the risk factors associated with DM differed slightly between the 2 groups, with a trend toward fewer drug combinations for the treatment of hypertension and dyslipidemia or as antiplatelet therapy among diabetic immigrants, which is consistent with the results obtained in other studies.32
Chronic complications of DM were also less common among the immigrant groups (with the possible exception of coronary artery disease in South Asian diabetics). Once again, we believe that younger age and the shorter duration of DM in children play an important role.
Finally, as described in this article, the social dimension of the country of origin influences certain features of DM. However, other aspects of inequality have not been explored in this study, such as socioeconomic status, and these should be included in future studies. In Europe, there are socioeconomic disparities in the incidence, prevalence, and mortality of DM type 2; the worst figures being found among those occupying a lower socioeconomic position.18
This study describes for the first time the clinical characteristics of DM in immigrants in Spain, comparing them with the native population using a national sample. The profile of the diabetic immigrant in Spain is one of a young and “healthy” diabetic patient, but with parameters of metabolic control that are slightly higher than those of the native population. The shorter duration of the disease probably explains why complications have not yet appeared. This provides an excellent opportunity to implement disease prevention programs.
Strengths and LimitationsThe strength of this study is that it is the first to analyze the clinical characteristics of DM in the immigrant population in Spain, which, up to now, has only been investigated in small local studies.
One of the main limitations of this study is that the sample was drawn from patients, rather than being based on the general population, and thus no data could be gathered on the prevalence of the disease. Although patient selection was randomized, the researchers voluntarily participated in the study (with no external audit), which may have led to bias because they were health professionals with an interest in the field of DM and immigration. However, we do not consider that this negatively affected the study's conclusions. Although the presence of complications, obtained from the data gathered from the clinical history, might have been underreported, this may have affected all the groups.
ConclusionsThis study of immigration and DM in Spain shows that there are differences in the clinical characteristics between immigrant diabetics and native Spaniards diabetics.
Clinical ImplicationsThe metabolic control of diabetes is generally worse in immigrants than in native Spaniards diabetics, but the immigrant group has fewer chronic complications of the disease, thus confirming the value of using preventive measures and early diagnosis in the immigration population.
FundingThis study was funded by a research grant provided by the Direcció de Salut Pública del Departament de Sanitat de la Generalitat de Catalunya, Spain, and the MSD laboratory.
The study was made possible by the infrastructure and support provided by the redGDPS.
Conflicts of interestNone declared.
José Juan Alemán, Clara Albaiges, Merçé Aliaga, Fernando Álvarez-Guisasola, Raquel Amoedo, Gloria Antón, Sara Artola, Carmen Asensio, M. Pilar Baillo, Mar Baranda, Joan Barrot, Lourdes Barutell, Mónica Belinchón, Josep Bell, Belen Benito, María Berengué, M. Dolores Caballero, Joan Cabré, Alfonso Calle-Pascual, Judit Calpe, Blanca Camallonga, Francisco Carramiñana, Ignasi Carrasco, Lourdes Carrillo, Carmen Castellà, Rafael Castillo, Angel Celada, Vicent Cerdà, Thaïs Clusa, Rafael Colás, José Manuel Comas, Rigoberto Corrales, Pilar Cosculluela, Engràcia Costa, Julia Cruz, Rosa Mar de Miguel, Montserrat de Villasante, Javier Díez Espino, Patxi Ezcurra, Anna Faba, Jose María Fernández, Mercé Fernández, M. Rosario Fernández, Manuel Ferreiro, Xantal Ferrer, Natalia Feuerbach, Teresa Figueres, M. Carmen Florensa, Lourdes Franco, Xavier Freixas, Carmen Fuentes, Susana García-Pleyan, Francisco García-Gallego, Javier García Soidan, Marisa Garde, Esteban Gilszlak, Laureano Gómez, M. Victoria Gómez, Juan Carlos Gonzalez, Susana Gonzalez, Juanjo Gorgojo, Santiago Gras, Miguel Ángel Gutiérrez, Sacramento Gutiérrez, Felix Heras, Josep M. Hernandez, Julio Hernández, Vicente Hernandez, Manuela Hidalgo, Mercedes Ibáñez, Rosario Iglesias, Cristina Ligorria, Olga Loriz, Raquel Martin, Isabel Martínez, Juan Martínez Candela, M. Jesús Martínez, Alba Martinez, Mireia Martínez, Silvia Martín-Urda, Raquel Martos, Manel Mata, Jesús Mayos, Javier Mediavilla, Josep Mercader, Teresa Micaló, José Manuel Millaruelo, Dalia Mora, Francisco Morales, Pedro Muñoz, M. Isabel Muñoz, Rosa Blanca Muñoz, Teresa Mur, Jorge Navarro, Noemi Navarro, Xavier Oliva, Carmen Olmos, Gloria Osuna, Luis Otegui, Jesús Pagés, Guillem Paluzie, Ana Parella, Maria Pastoret, Flor Patitucci, Juan Peña, Teresa Peñarrubia, Montserrat Peraferrer, José Carlos Pérez Villarroya, María Porta, Paloma Prats, Sara Prego, Imma Ramentol, Josep Lluís Reverter, Marta Ripoll, Ferran Rius, Daniel Roca, Isabel Rojas, Laura Rubio, Irene Ruiz Tamayo, Marta Sanavia, Carmen Sanchez, Javier Sangrós, Carlos Sanjuan, Guadalupe Sartor, Mateu Seguí, Mireia Serra, Rosario Serrano, Margarita Sotomayor, Fernando Tiñena, José Luis Torres, Emma Torres, Marta Trenchs, Leticia Troyano, Mercé Villaró, M. José Vives, Rosa Elena Yáñez and M. Mar Zamora