Keywords
INTRODUCTION
Publication of an annual report is one of the objectives of the Spanish Registry of Pacemakers (BNDM). This report presents the 2008 data on cardiac pacing with pacemakers in Spain, describes the most salient characteristics and the changes in recent years1-7, discusses how closely the pacing modes adhere to current clinical guidelines8,9, and facilitates hospital comparisons of their activity with the situation of pacing in Spain.
We maintained the same structure as previous reports published in the Revista Española de Cardiología. The BNDM has data available since 1994, but in some specific aspects, the period is shorter for technical reasons due to changes in the database software and the way in which the data were processed. Detailed information presented in multiple plots of the data referred to in previous years can be freely accessed at the web site of the Working Group on Cardiac Pacing (www. estimulacioncardiaca.org or www.marcapasossec. org).
An annual summary is also provided, providing general data on different aspects of the activity for the European Pacemaker registry.10 This registry has comparative data between countries and data on changes in countries that have been participating since 1994.11
METHODS
Report of the Spanish National Institute of Statistics
The national and regional population data for the various calculations for each year were taken from the most recent report published and updated by the Spanish National Institute of Statistics (INE) (www.ine.es).
European Pacemaker Patient Identification Card Information
The data and information collected are taken from the various sections of the European Pacemaker Patient Identification Card (EPPIcard),1 which should be filled out by the physician who implants the pacemaker and who should retain a copy to send to the BNDM. The EPPIcard is sent from the implicated hospitals or companies, in accordance with the current legislation on these implantable devices.2
The information on the EPPIcard can be sent in electronic format, just like the databases of the centers (in compliance with the security guidelines and measures demanded by the Law for Data Protection), with the choice left to the preference of those in charge of the registry in each center. With a view to facilitating this form of data transmission, and to ease the tedious process of data entry, the Working Group on Cardiac Pacing has its own database format,7 which is freely available. The aim is to harmonize and facilitate data collection and processing, although so far it has not had a significant impact on the performance of the registry.
The information sent to the registry is incorporated and cleaned by staff with extensive experience in the field of cardiac pacing. For processing and final analysis of data from the different fields of EPPIcard, dedicated software has been developed and is used in collaboration with the Information Technology Department of the Spanish Society for Cardiology.
Information From Different Companies
Although not all EPPIcards are sent in, the total number of pacemakers implanted in 1 year and their distribution according to autonomous region are obtained through the now commonplace cooperation of all companies that implant and distribute devices in Spain. These companies usually also provide this information to Eucomed (European Confederation of Medicals Suppliers Associations).
Sample Analyzed
In 2008, the BNDM received data on activity from 116 hospitals, which are included in the attached list, grouped by autonomous region (Table).


A total of 11 885 cards were processed, corresponding to implantations or replacement of pacemaker generators, while 373 from 1 center were discarded or not analyzed because they were not relevant to the registry. Despite the increase in the total number of cards, these still only account for 36.3% of the total number of generators, the same as the previous year.
Although it would obviously be preferable that this figure were 100%, the available sample is sufficient to provie us with knowledge of many different aspects of cardiac pacing in Spain.
RESULTS
Number of Pacemakers Implanted per Million Inhabitants
In 2008 a total of 32 154 conventional pacemaker generators and 542 cardiac pacing devices for cardiac resynchronization therapy without defibrillation (CRT-P) was implanted.
In 2008, the population census, according to information available from the INE, was 46.15 million inhabitants, with a population increase of practically 1 million persons per year.
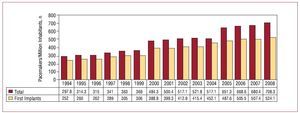
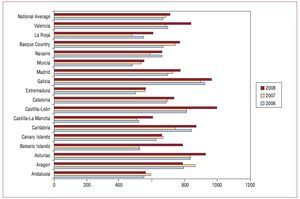
In addition to the expected increase in the number of generators in line with the increase in the population, there was also an increase in the number of generators used per million inhabitants to 708.3 (Figure 1). As in previous years, there was an uneven distribution of the number of units per million inhabitants in the autonomous regions (Figure 2), calculated according to the population distribution published in the most recent update of the INE for that year. In the 2 previous years,7 a similar distribution was found, with a significantly higher number in the northern regions of Spain such as Galicia, Castile-León, and Asturias, with more than 900 pacemaker generators per million inhabitants in 2008. These regions have an older population, as reflected in the higher average age of the patients for whom data were submitted to the BNDM and in the higher percentage of the population who were over 75 years of age.7 This provides a likely explanation for the differences observed.

Figure 1. Total number of pacemaker generators and first implants consumed per million inhabitants, changes between 1994 and 2008.

Figure 2. Pacemakers implanted per million inhabitants, national average, and distribution by autonomous community, 2006 to 2008.
Cardiac Resynchronization Devices
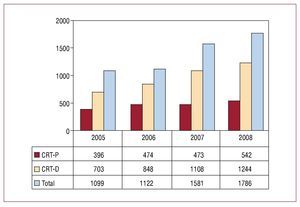
The group of biventricular pacing devices used for cardiac resynchronization therapy has increased progressively to 38.7 units per million inhabitants, including low-energy devices (CRT-P) with 11.7 units per million inhabitants. After a leveling-off in the number of implanted CRT-P units in 2006 and 2007,7 an increase was seen in 2008 (Figure 3), but this represented a small percentage increase in the total number of generators to 1.6% (from 1.5% in 2007). This increase was much lower than that of the units with defibrillation capability. These units were those that contribute most to the annual total 1244 in 2008 (848 in 2006).

Figure 3. Cardiac resynchronization devices implanted in the past 4 years. CRD-D indicates dual-chamber generator with defibrillation capability; CRD-P, dual-chamber device with pacing only.
From the information submitted to the registry, biventricular CRT-P units represent 1.5% of first implants and 1.6% of generator replacements (for mode optimization or because the battery ran out).
Age and Sex of the Population
Age
The mean age of the patients who were implanted with a pacemaker system in 2008 was 76.3 years, while those who underwent replacement were slightly older, at 76.6 years. A small but progressive annual increase in the mean age can still be appreciated. This possibly reflects a shift in the population pyramid towards older age.
In 2008, a constant difference was maintained, as in previous years, in the mean age with respect to sex; this was somewhat lower in men (75.8 years) than in women (77 years).
The greatest number of implants was performed in patients in their 70s, with 39.1%, followed by those in their 80s, with 36.2%, whereas the greatest number of replacements was done in patients in their 80s (39.9%) followed by those in their 70s (33.3%). Limited activity was undertaken in patients aged 100 years or more (0.1% of all procedures; replacements in 0.24% and first implants in 0.08%).
Sex
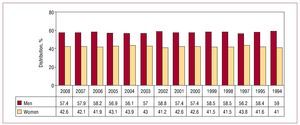
More implants and generator replacements were used in men. Of all procedures, men accounted for 56.9%: 57.4% of first implants (Figure 4) and 55.3% of replacements (even though there were more women in the general population: 22.84 million men vs 23.31 million women). According to the proportion of implants in men and women in the registry, the number of devices implanted per million inhabitants was 815.8 in men and 603.2 in women. In addition, this greater incidence was evident for all decades of life.7

Figure 4. Pacemaker implantations by sex, 1994 to 2008.
Type of Procedure: First Implant and Pacemaker Replacement
Seventy-four percent of patients were implanted with a pacemaker for the first time. Generator replacement accounted for 26% of the procedures undertaken; a slight but continuous increase was observed in replacements with respect to the total number of procedures.
Generator replacements that required new leads during the procedure accounted for 1.6% of all reported activity.
The most frequent reason for generator replacement was the battery running out at the end of its useful life (88.5%). Other reasons reported less often were infection (2.1%), erosion of the generator bag (1.6%), elective procedure (3.6%), change because the battery ran out early (1.1%), change of system to improve hemodynamic results (0.5%), pacemaker syndrome (0.6%), and major or minor pacemaker defects (0.1%).
Pacemaker Leads
Almost all leads used were bipolar (99.6%), both in the atrium and the ventricle (99.9%) in both chambers, with this pacing system being the general choice. The small proportion of unipolar leads (0.4%) were used mainly for coronary sinus pacing (for cardiac resynchronization therapy or because of problems accessing the right ventricle as might happen after tricuspid valve replacement or with congenital abnormalities); a smaller percentage corresponded to epicardial leads implanted during heart surgery while on other occasions unipolar leads were chosen for their smaller caliber in special situations (multiple electrodes, venous stenosis, etc).
The distribution of the placement of the unipolar leads was as follows: 67.5% in the coronary sinus, 7.5% at an epicardial site, 20% at a ventricular site, and 5% at an atrial site.
Fixation or Anchoring System
Passive fixation of the leads (using flexible tines to stabilize the position in the trabeculae in the endocardium) has always been the method of choice compared to the so-called active system (with a helix, usually extendable, that penetrates the myocardium), but a trend towards greater acceptance and application of actively fixated leads could be appreciated. This may be due to several reasons: a) stabilization of the lead in adverse situations (for example, with severe tricuspid valve regurgitation); b) the possibility of pacing from the most desirable site (greater choice in different situations, such as the His or para-Hisian region, the outlet tract, or the right ventricular septum, atrial septum, etc); c) the thresholds of the current leads and the complications are comparable for both systems; and d) their isodiametric characteristic, which facilitated explantation.
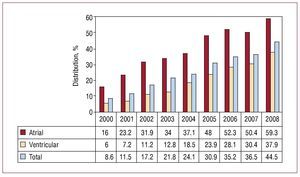
In 2008, the atrial position for active fixation accounted for almost 60% while 38% of the leads were implanted at both locations (Figure 5).

Figure 5. Active lead fixation: percentage of total and of implants in the atrial and ventricular chambers. Changes from 2000 to 2008.
Explantation of Electrode Leads
The reasons indicated for explantation of the pacing leads were mostly infection or skin ulceration (52.9%), followed by displacement and breakage of the lead conductor, each accounting for 15%, and defective insulation and exit block (3%).
The intervention for implantation of a new lead alone (due to changes in its electrical characteristics) accounted for 0.2% of all procedures done, with replacement of a lead at the same time as change of generator in 1.6% (to improve the pacing mode or because of damage the cable or detection of unacceptably high thresholds during the replacement procedure).
Symptoms
The clinical manifestations responsible for the indication of implantation of the pacemakers were the following, in descending order of frequency: syncope in 44.5% of the cases, dizziness in 26.5%, dyspnea or signs of heart failure in 15.5%, and bradycardia in 8.9%. Other signs or symptoms reported less often were tachycardia (1.1%), chest pain (0.7%), brain dysfunction (0.5%), and risk of sudden death after return to bradyarrhythmia (0.2%). In 1.9%, the implantation was in asymptomatic patients or for a prophylactic indication.
Etiology
Among the etiologic causes for pacemaker implantation, the most commonly reported was unknown (43.4% of cases), followed by suspected fibrosis of the conduction system (39.4%), although both might fit within the same group, as the latter is an etiology determined by ruling out other possibilities. Ischemic etiology was the next most common cause (6.7%), with the subgroup of postinfarction patients corresponding to 0.4% of the total. The group of iatrogenic-therapeutic etiology accounted for 2.3% (those secondary to atrioventricular [AV] node ablation, whether intentional or not, corresponded to 1.2%, percentages very similar to previous years6,7).
The cardiomyopathy group accounted for 2.6% (0.4% for hypertrophy, the lowest percentage in recent years, possibly due to the decrease in pacing in patients with obstructive hypertrophic cardiomyopathy). The set of neuromediated, malignant vasovagal, and carotid sinus syndrome etiologies did not account for more than 2% of the overall procedures.
Electrocardiographic Disorders
The most common electrocardiographic disorders for which a new implant was indicated were third-degree AV block in 33.8% of the patients; conduction disorders as a group accounted for 54% followed by different types of sinus node dysfunction in 20.9% (sinoatrial exit block, sinoatrial node arrest, sinus bradycardiatachycardia, chronotropic incompetence, etc), or 37.4% if we also included patients with atrial fibrillation and bradycardia, code E6 on the EPPIcard.
With regard to sex, in 2008 it was apparent that, although there are fewer men than women in the population, more implantations were done in men for all conduction disorders. This was true for both AV conduction disorders and for intraventricular conduction disorders (IVCDs). However, in sick sinus syndrome (SSS) it is almost the same in both sexes, as in other years studied5-7 (number of implants in men/women was 1.41 for AV block, 2.18 for IVCD, and 1.08 for SSS), which is a reflection of the more frequent degeneration of the conduction system in men compared to women.
IVCDs accounted for 5.9% of all electrocardiographic disorders. No significant increase was apparent compared to recent years, despite the potential increase in number of indications for cardiac resynchronization, and this figure has remained around 5% to 6% in all years recorded.
Details of the subgroups mentioned and the changes in recent years can be seen in the attached figures (Figures 6 and 7).

Figure 6. Distribution of pre-implant electrocardiographic disorders in 2008. AT indicates atrial tachycardia; AFib/ AF+brad, atrial fibrillation or atrial flutter with slow ventricular response; AV block, atrioventricular block; D, degree; IVCD, intraventricular conduction disorder; SSS, sick sinus syndrome; VT, ventricular tachycardia.

Figure 7. Pre-implant electrocardiographic disorders, changes from 1994 to 2008. AFib/AF+brad indicates atrial fibrillation or atrial flutter with slow ventricular response; AV block, atrioventricular block; IVCD, intraventricular conduction disorder; SSS, sick sinus syndrome.
Pacing Methods
General
Of the generators used (first implant and replacements), single-chamber pacing accounted for 40.2% of the devices and dual-chamber ones with 1 or 2 leads for 59.7%. Isolated atrial pacing accounted for only a small percentage (1.3%); certain differences were observed between the first implants (1%) and the devices used for replacements (1.8%). This trend towards lower current usage is probably due to shifts towards more sophisticated dual-chamber devices, with new mode-switching AAIR/DDDR algorithms or AV intervals that facilitate intrinsic AV conduction, with a more "physiological" pacing behavior than the old dual-chamber models.
The use of devices for single-chamber ventricular pacing (VVIR) was 38.9%, with a slight variation between first implant (39.4%) and replacement devices (37.7%). Thus, there remains a group of patients who are in sinus rhythm and who are paced in VVIR mode. In the electrocardiographic disorders, the percentage of patients with permanent atrial tachyarrhythmia is 20.4%. These are the only patients who would clearly be candidates for this type of pacing, which is presented in detail in the following sections.
In sequential pacing, in single-lead VDD mode (although still accounting for 15.3% of all units employed), there was a marked difference between first implant (13.6%) and replacements (20.1%), indicating a trend towards less usage of this mode.
DDD stimulation was the most widely used, both overall and when broken down by first-time or replacement implantation, accounting for 44.4% of all generators used in the year (45.8% for first-time implants and 40% for replacements).
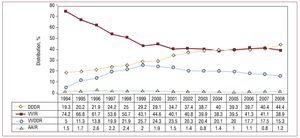
If we compare the modes of usage with previous years, there was a progressive increase in DDD units after a plateau reached between 2004 and 2007 and a slow decline in the number of VDD units,7 which, nevertheless, were implanted 4932 times in 2008 (Figure 8).

Figure 8.General change in pacing modes from 1994 to 2008.
Pacing was associated with one or more biosensors for frequency control in 89.5% of the cases.
AV Block Pacing
To study the quality of pacing in patients with AV block, the appropriateness of pacing and the trend towards pacing modes more recommended in the clinical guidelines,8,9 the analysis excluded the subgroup with code 8 on the EPPIcard, that is, patients with atrial tachyarrhythmia with AV block.
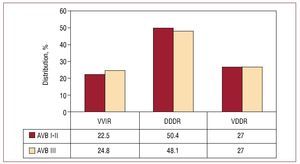
Atrial synchronized ventricular pacing was done in 75.9% of the cases, with 48.9% in DDDR mode and 27.1% in VDDR mode. Choice of pacing modes in 2008 was similar regardless of whether the analysis was by first- or second-degree AV block or third-degree AV block. The VDDR group accounted for 27% in both cases (Figure 9).

Figure 9. Pacing methods in atrioventricular blocks (AVB) grouped by first- and second-degree and third-degree blocks (2008).
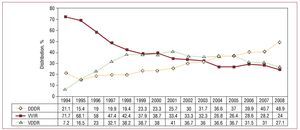
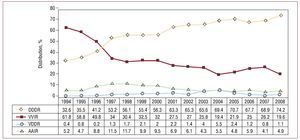
Of note in the data for annual changes was the significant increase of 8% in the DDD group at the expense of lower usage of the other 2 modes, VDD and VVI. On examination of the trends, a slow decrease in the VDDR pacing mode can be seen; conduction disorders were the main indication (Figure 10).

Figure 10. Pacing methods used in atrioventricular block, from 1994 to 2008, excluding the patients in permanent atrial fibrillation.
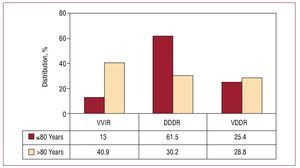
When we analyze the distribution of pacing modes in the 2 age groups usually defined (≤80 years and >80 years), there was a notable difference in the use of modes that maintain AV synchrony, with this mode preferred in 87% of those under 80 years of age compared to 60% in those older than 80. VDDR mode was the one with least influence of age (Figure 11) in these groups and the one with the smallest changes over the years analyzed.7

Figure 11. Pacing methods used in atrioventricular block, by age groups of 80 years old or younger and over 80, excluding the patients in permanent atrial fibrillation (2008).
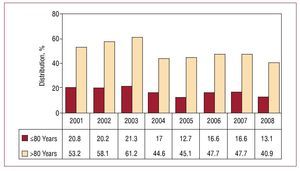
There was still a high percentage of VVIR pacing in patients with AV block in sinus rhythm, but there was a notable decrease in this mode of pacing compared to previous years, with the subsequent improvement in the choice of pacing mode. For the different types of AV block, VVIR mode accounted
for 24%. When choosing the pacing mode, age appeared as the determining factor (Figure 12). However, the degree of block had little influence on this choice, as it was only slightly less than in patients with less severe AV conduction disorders (first- and second-degree AV block, 22.5% vs third-degree AV block, 24.8%) (Figure 9).

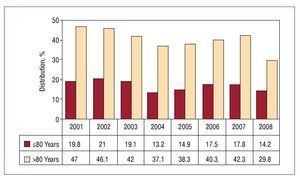
Figure 12Change in VVIR pacing mode in atrioventricular block, according to age groups (2001-2008).
Pacing in Patients With Sick Sinus Syndrome
As in the previous group, patients with AFib/AF and bradycardia (code E6 EPPIcard) were excluded and analyzed separately from the group of patients who remained in sinus rhythm to prevent mode switching from interfering in the results.
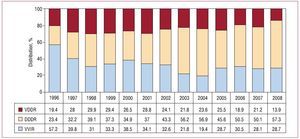
In patients with SSS, pacing was done mainly in DDDR mode (74.2%) and AAIR mode was only used in 4.9% (overall, in 79.1%). These pacing modes, with atrial sensing and pacing capability, are the ones recommended for SSS in the clinical guidelines.8,9 In 2008, greater usage of DDDR mode was achieved, probably due to the use of generators with new AAIR/DDDR mode-switching algorithms, which are particularly indicated in this group of patients (Figure 13).

Figure 13. Pacing methods used in sick sinus syndrome, from 1994 to 2008 years, excluding the patients in permanent atrial fibrillation.
This year, it is of note that the smallest percentage of VVIR pacing was reported somewhat less than 20%. The VDDR mode, which is not very appropriate in this type of patient unless clearly justified, was still present in a low percentage of patients (1.2%). This can be explained by technical problems with implantation (Figure 13).
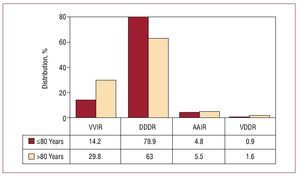
On analysis of influence of age on choice of mode by comparing 2 age groups (≤80 years and >80 years), a significant difference was seen in the use of DDDR mode: 79.9% in those aged under 80 years and 63% in those over 80 (for VVIR pacing, the percentages were 14.2% and 29.8%, respectively). AAIR mode
(although with similar and low percentages in both subgroups) was more widely used in the older age group (4.8% vs 5.5%) (Figure 14).

Figure 14. Pacing methods in sick sinus syndrome by age groups, 2008.
Although the percentage of patients who could benefit from atrial-based pacing remained constant in 2008, better adaptation of the modes was reported, even in older patients, thereby breaking the opposite trend of the last 2 years6,7 (Figure 15).

Figure 15.VVIR pacing method in sick sinus syndrome by age groups.
In the subgroup of patients with atrial tachyarrhythmia, atrial flutter or fibrillation, the most widely used pacing mode was VVIR (94.3%), as expected. DDD mode accounted for 4.9% and a VDD was used in a minimal number (0.7%) (probably in patients where there was an intention to revert to sinus rhythm).
Pacing in Intraventricular Conduction Disorders
In this group of electrocardiographic disorders, sequential or synchronous pacing remained at the same percentage as in 2007 (71.2%),7 and a notable shift towards VDDR and DDDR devices was seen. The most widely used pacing mode was DDDR, accounting for 57.3%, while VDDR accounted for 13.9% (Figure 16).

Figure 16. Pacing methods for intraventricular conduction disorders (2008) and change over the years for which data are available.
Single-chamber VVIR ventricular pacing has remained at a similar level over the past 4 years, with the current 28% being the same figure as in 2007 and 2005.
As in the previous sections, the VVIR pacing mode was more widely used in older patients; it was used in 45% of those over 80 years (the most widely used mode in this group), compared to 17% in patients under 80 years. The use of VDD mode was similar in both age groups (13.6% vs 14.3%, respectively), as in the previous years analyzed.
As with conventional generators, in IVCDs, the devices used for dual-chamber pacing CRT-P for treatment of heart failure in dilated cardiomyopathies showed notable differences: 11.8% in those aged 80 years or less and 1.9% in those over 80.
CONCLUSIONS
The number of pacemakers used per million inhabitants continued to increase and is now at 708.3 devices in 2008 (of which 524.1 corresponded to first implant), with marked regional differences due to the different ageing patterns of the population.
Replacement of pacemakers is an increasingly important part of the activity undertaken, accounting for 26% of the procedures in 2008.
In the adaptation of pacing mode to the different electrocardiographic disorders, age was a determining factor.
In 2008, sequential AV pacing was the most widespread indication of the conditions studied.
A gradual decrease in VDDR mode was seen, with 5000 units implanted per year.
The leads implanted were bipolar ones. The use of active fixation systems continues to increase, and are most often used for atrial sites.
The number of dual-chamber pacing devices, CRT-P, has increased, although this percentage change is not significant.
ACKNOWLEDGMENTS
We thank the registered nurses Pilar Gómez Pérez and Brígida Martínez Noriega, whose collaboration was essential for maintaining the quality of the registry. We also thank Gonzalo Justes Toha, information technology specialists at the SEC, for his valuable collaboration in setting up the computing application and analyzing the registry; all the health care professionals in the hospital centers who collaborated in sending in the European Pacemaker Patient Card, the source of the information analyzed; and the staff of the pacemaker manufacturers with implantation activity in Spain (Biotronik, Boston, Médico, Medtronic, Saint Jude, and Sorin Group) for their collaboration in sending in the cards and the general information on annual consumption of devices.
ABBREVIATIONS
AFib/AF: Atrial fibrillation/atrial flutter
AVB: Atrioventricular block
BNDM: Spanish Registry of Pacemakers
CRT-P: Cardiac resynchronization therapy (without ICD)
EPPIcard: European Pacemaker Patient Identification Cards
INE: Spanish National Institute of Statistics
IVCD: Intraventricular conduction disorder
SSS: Sick sinus syndrome
Correspondence: Dr. R. Coma Samartín. Arturo Soria, 184. 28043 Madrid. España.
E-mail: coma@vitanet.nu