Keywords
INTRODUCTION
Optical coherence tomography (OCT) has emerged in recent years as one of the most promising intracoronary diagnostic tools.1,2 This light based imaging technique is able to generate images of the coronary artery with a level of resolution (10 µm) never reached before in vivo. This has offered new insights into atherosclerotic plaque pathology as well as into acute and long-term vessel wall response to stent implantation.3-8
Up to now, the main challenge for a widespread clinical application of intracoronary OCT was a rather complex imaging procedure. Blood causes multiple light scattering and substantial signal attenuation, and needs to be cleared from the vessel during OCT image acquisition. The first generation commercially available time domain (TD) OCT systems employed proximal occlusion of the vessel with a low-pressure balloon (0.5 atm), similar to angioscopy, and simultaneous, distal flush delivery during pull-back of the OCT imaging probe.9 This protocol limited the coronary segment that could be imaged, and intrinsically created myocardial ischemia during imaging, restricting OCT to selected patient cohorts.10-13
The new generation OCT systems (other monikers for the same technology are Fourier domain [FD] OCT, optical frequency domain imaging [OFDI], spectral domain imaging or swept source OCT) were developed to overcome this limitation. Most distinctively, these second generation OCT systems do not require transient balloon occlusion. Unprecedented capacity for data acquisition and pull-back speeds (20 mm/s) allow for the visualization of long coronary segments within a few seconds while blood is temporally displaced by the injection of flush through the guiding catheter.14
While this concept is attractive, there has been no systematic research investigating the impact of such high pull-back speeds on the reproducibility of data obtained in the clinical setting. On theoretical grounds, the rapid acquisition reduces the motion of artifacts during the heart cycle, and thus, potentially, sources of error, whereas an increased pitch between consecutive, cross-sectional images could add sources of error. The FD-OCT frame rate is typically 100 frames per second, which at a pull-back speed of 20 mm per second, results in 5 frames per mm or a frame pitch of 200 micron. A typical TD-OCT frame rate is 20 frames per second, with a pull-back speed of 3 mm per second, resulting in 7 frames per mm or a pitch of 142 microns.
The objective of the present study was to assess the reproducibility of the new generation, intracoronary FD-OCT systems for plaque and stent assessment in vivo. We investigated therefore the reproducibility of morphologic features that have been described in the past to be of potential clinical relevance in patients undergoing percutaneous coronary intervention (PCI).
METHODS
Study Population
Non-consecutive patients scheduled for elective PCI were enrolled between May and December 2008. The study protocol was approved by the Ethics Committee of Erasmus Medical Center. All the patients gave written informed consent. Exclusion criteria for FD-OCT imaging were: a) TIMI 0 flow at target lesion site; b) lesion beyond acute bends or in a location within the coronary anatomy where the catheter cannot reach.
Technical Principles of New Generation Optical Coherence Tomography
OCT uses reflected light to create high-resolution cross-sectional images of the vessel. An interferometer splits the light source into 2 "arms" - a reference arm and a sample arm, which is directed into the tissue. The images are created based on the comparison of the back-reflected optical intensity from the 2 arms (interference signal).
The first clinically available OCT systems used TD technology, while new generation systems are based on FD technology.
Both TD-OCT and FD-OCT use low-coherent near-infrared light. A wavelength around 1300 nm is selected because it minimizes the energy absorption in the light beam caused by protein, water, haemoglobin and lipids. TD-OCT uses a broadband light source and the reference arm contains a moving mirror that allows scanning of each depth position in the image pixel by pixel. This mechanical scanning process limits the rate at which images can be acquired. FD-OCT uses a wavelength-swept laser as a light source and the reference mirror is fixed. This change in technology results in a better signal-to-noise ratio15 and faster sweeps, allowing a dramatically higher A-line rate, and hence a faster image acquisition and pull-back speed than TD-OCT.16,17
Fourier Domain-Optical Coherence Tomography Systems
Two different FD-OCT prototypes were used (LightLab Imaging, Inc, Westford, MA and Wellman Center for Photomedicine, MGH, Boston, MA). All systems use a wavelength-swept laser as a light source. Table 1 summarizes the specifications of the second generation systems compared to TDOCT (LightLab Imaging, Inc, Westford, MA). All FD-OCT imaging catheters had a short monorail design, with catheter profiles ranging from 2.4 Fr to 3.2 Fr, but all of them were compatible with 6F guiding catheters. FD-OCT imaging catheters contained a fiber-optic imaging core covered by and withdrawn within a translucent sheath. The optical imaging core rotated at approximately 100 revolutions per second and the pull-back speed ranged from 5 to 20 mm/s using a dedicated pull-back device. Data were processed in real time and digitally stored.

Optical Coherence Tomography Data Acquisition
We used a standard femoral approach in all patients. Weight adapted, unfractionated heparin was given to maintain an activated clotting time >300 s. After placement of the guiding catheter (6 F) into the coronary ostium, a standard PCI guide wire was advanced into the coronary artery in conventional manner. FD-OCT imaging was performed before stenting (cohort A) and after stent implantation (Cohort B). After administration of nitrates (0.2 mg NTG ic), the FD-OCT imaging catheter was advanced into the coronary artery in rapid exchange technique.
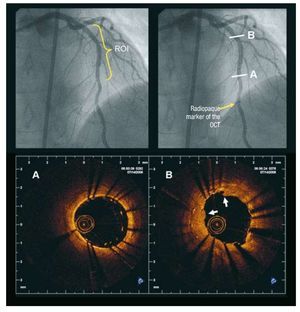
Radiopaque markers at the distal catheter tip and at the imaging core allowed positioning of the optical probe distal to the region of interest. (Figure 1). After FD-OCT catheter placement, blood was cleared by injection of iso-osmolar contrast (Iodixanol 370, VisipaqueTM, GE Health Care, Ireland) at 37º Celsius with an injection pump (Mark-V ProVis, Medrad, Inc. Indianola, PA, US; flow rate 3 mL/s) through the guiding catheter. The FD-OCT pull-back was started as soon as the artery was cleared from blood and stopped when the imaging core reached the guiding catheter.

Figure 1. Fourier Domain-optical coherence tomography image acquisition procedure. The angiogram on the left shows an LAD treated by repeat stenting for stent restenosis. The region of interest (ROI) for the OCT examination was the stented area. The image on the right shows the radiopaque marker of the OCT catheter positioned distal to the ROI. The 2 lower panels show 2 FD-OCT images obtained in the stented area (Lightlab Imaging Inc system). A: distal part of the newly implanted stent in which strut malapposition is visible. B: cross-section obtained in the region of the restenosis after the new stent implantation. Two layers of struts are visible and the neointimal tissue appears disrupted and protrudes into the lumen (white arrows). LAD indicates left anterior descending artery; OCT, optical coherence tomography; ROI, region of interest.
Assessment of Interstudy and Interobserver Reproducibility
Pull-backs in native coronaries as well as after stent implantation were analyzed as follows. To evaluate the interstudy reproducibility, a FD-OCT pull-back through the region of interest was repeated using the same catheter twice under identical conditions of pull-back speed, frame rate and flush rate. The catheter was not removed from the artery between the 2 acquisitions. These 2 pull-backs were then analyzed independently. To evaluate the interobserver variability, 2 experienced OCT analysts reviewed the first FD-OCT pull-backs independently. To evaluate intraobserver variability, one observer repeated the analysis of the same pull-back one week later.
Stent Assessment
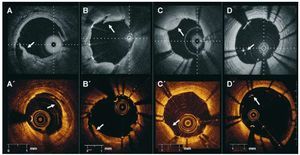
After stent implantation, study and observer agreement for the following parameters was evaluated according to the following definition18: a) edge dissection: disruption of the endoluminal vessel surface at the stent edges (5 mm prox and distal); b) tissue prolapse: protrusion of tissue between the stent struts without disruption of the continuity of the endoluminal vessel surface; c) intra-stent dissection: disruption of the vessel endoluminal vessel surface in the stent segment; and d) malapposition: presence of at least one strut separated from the vessel wall (Figure 2). Incidence of these phenomena was assessed on a per vessel basis.

Figure 2.Stent implantation assessment. Clinical examples of edge dissection (A, A´), intrastent dissection (B, B´), tissue prolapse (C,C´) and malapposition (D, D´) obtained with different Fourier Domain-OCT systems in different patients (upper panel Wellman Center for Photomedicine, MGH; lower panel Lightlab Imaging Inc).
Plaque Type Assessment
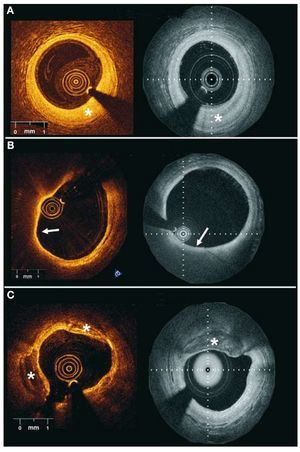
Native coronary segments were evaluated as follows: 60 corresponding atherosclerotic plaques were selected in both pull-backs, using landmarks such as side branches or stent edges. The 2 observers assessed these pre-selected plaques according to the following definitions: a) fibrous plaque: homogeneous, highly backscattering regions, b) fibrocalcific plaque: low scattering regions with sharply delineated borders; and c) lipid-rich plaque: diffusely bordered low scattering regions5 (Figure 3).

Figure 3.Examples of different plaque types obtained with 2 Fourier domain-optical coherence tomography systems in different patients. A: fibrous plaques (*) are visualized as homogeneous, high scattering regions. B: lipid rich plaques appear as low backscattering regions without sharp borders and usually covered by a fibrous cap (white arrow). C: fibrocalcific plaques (*) appear as low backscattering regions with sharp well delineated borders (left panel Lightlab Imaging Inc; right panel Wellman Center for Photomedicine, MGH).
Statistical Analysis
Continuous variables are expressed as mean (standard deviation) and categorical variables are expressed as percentages. The kappa coefficient (k) was used to test the inter-study, interobserver and intraobserver agreement for plaque characterization and stent assessment.
RESULTS
Patient Characteristics and Fourier Domain- Optical Coherence Tomography Imaging Success
Forty-five patients (49 vessels) were enrolled in the study. The average age was 63 (10) years and 80% were males. The incidence of cardiovascular risk factors was as follows: 23/45 (51%) hypertension, 12/45 (27%) diabetics, 29/45 (64%) dyslipidemia, and 13/45 (29%) current smoking. Nineteen patients (42%) had suffered a previous myocardial infarction, 7/45 (16%) had coronary artery bypass surgery and 22/45 (49%) had previous PCI. The indication for the elective PCI was stable angina in 31/45 (69%), unstable angina in 10/45 (22%) and acute myocardial infarction in 4/45 (9%).
The imaging probe could be positioned successfully in the coronary artery in all patients. Ninety-seven pull-backs showed excellent image quality. Artifacts that did not allow a proper image assessment were observed in 12 pull-backs and 2 pull-backs were not evaluable due to incomplete blood clearance. The procedural characteristics are summarized in Table 2. The implanted stent type was at the operator discretion. In 10 patients, FD-OCT was performed before and after stent implantation at the discretion of the operator. After treatment of the culprit lesion, a second vessel was selected for plaque assessment in 2 patients (4.5%) and for follow-up of a previously implanted stent in 9 patients (20%).

During FD-OCT imaging, transient chest pain and ECG changes were observed in 8% and 10% of the patients respectively. The ECG changes consisted of ST depression or T wave changes. ST elevation was not observed in any case. No coronary dissection, perforation spasm, embolization, arrhythmia, or other adverse event occurred.
Stent Assessment Reproducibility
OCT analysis after stent implantation was performed in 27 patients (28 vessels). Edge dissection was observed in 14 vessels (50%). Twenty-five (89%) showed evidence of tissue prolapse and 26 (93%) showed intrastent dissection. Malapposition of at least one strut was visible in 23 vessels (82%). The interstudy reproducibility (n=17 vessels) for the visualization of edge dissection, tissue prolapse, intrastent dissection and malapposition was excellent (k=1; P<.001). The kappa values for inter and intraobserver reproducibility are shown in Table 3.

Plaque Characterization Reproducibility
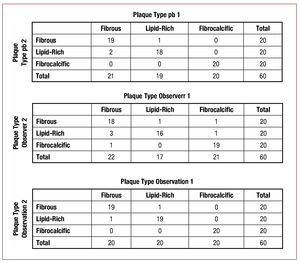
A total of 60 plaques were identified in both pull-backs. Figure 4 summarizes the classification results. There was agreement between the 2 pull-backs for plaque classification in 57 out of the 60 plaques (k=0.92; P<.001) (Figure 5). Interobserver variability showed agreement for 2 observers in the classification of 53 out of 60 plaques (k=0.82; P<.001). The intraobserver variability showed agreement in the classification of 58 out of 60 plaques (k=0.95; P<.001).

Figure 4.Interstudy, interobserver and intraobserver reproducibility for plaque characterization. Pb indicates pull-back.and late stent thrombosis are poorly understood. In this particular clinical scenario, detailed assessment of the vascular microstructure might be helpful to prevent potentially life threatening events, such as stent thrombosis, as it has been linked to incomplete healing, mechanical stent failure and incomplete coverage of lipid rich or necrotic core lesions.3,4,20-23 The relatively complex imaging procedure hampered the use of the first generation, TD-OCT in patients undergoing PCI. In the present study, we evaluated the new FD-OCT systems that simplify the acquisition procedure and can contribute to spread the clinical application of this imaging technology.

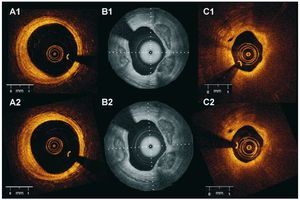
Figure 5. Inter-study reproducibility for plaque characterization. The figure shows corresponding images of the same plaques obtained in 2 different pull-backs in the artery. A1 and A2: fibrous plaque. B1 and B2: fibrocalcific plaque C1 and C2: lipid-rich plaque (A and C Lightlab Imaging Inc; B Wellman Center for Photomedicine, MGH).
DISCUSSIONTo our knowledge, this is the first study assessing the interstudy, interobserver and intraobserver reproducibility of FD-OCT systems for stent assessment and plaque characterization in vivo.
The main findings are: the new generation, FDOCT technology with high-speed pull-back a) has excellent inter-study reproducibility in vivo; b) allows for reproducible plaque classification; and c) allows assessment of periprocedural vessel trauma associated with coronary stent implantation with low interobserver, intraobserver and interstudy variability.
The present study also confirms that the new OCT systems allow visualization longer coronary segments (average, 54.4 [12.5] mm) in less time (average, 3.5 [1.4] sec) and with less flush volume as compared to previously reported data for TD-OCT.10 This is in agreement with a recently published study by Takarada et al comparing TD-OCT and FD-OCT in patients treated with stents.19
OCT has rapidly evolved to an attractive intracoronary imaging tool for the interventional cardiologists, as it offers the potential to address clinically relevant issues that may improve routine stent implantation and consequently long-term outcome. Its high in-vivo resolution allows for an accurate assessment of the mechanical stent vessel wall interaction, including strut apposition and periprocedural dissections.3,18 In the drug-eluting stent era, reasons for failure, including restenosis
The data presented in the article corresponds to the first cases performed in our center with the FDOCT systems and also reflects the learning curve of the operators. Optimization of the acquisition technique can reduce the number of cases with incomplete blood clearance. A recent study showed that FD-OCT allows a clear visualization of 99.4% of the segments imaged (as compared with 80.8% with TD-OCT).19
Stent Assessment Reproducibility
OCT has proven useful for the evaluation of the acute effects of stent implantation on the vessel wall.18 In the present study, a high proportion of the patients showed evidence of tissue prolapse between the stent struts or intra-stent dissections, likewise edge dissections were visible in half of the cases. Even more pronounced, malapposition of at least one individual strut was observed in the majority of the cases. The inter- and intraobserver reproducibility of TD-OCT for stent assessment after implantation was evaluated by Kubo et al. They showed an acceptable intraobserver concordance for inadequate stent apposition (k=0.90), tissue protrusion (k=0.92), stent edge dissection (k=0.96), and residual ruptured plaque (k=0.92). Relatively lower interobserver concordance for inadequate stent apposition (k=0.75), tissue protrusion (k=0.86), stent edge dissection (k=0.89), and residual ruptured plaque (k=0.86) was found.24 In our data, the inter-study reproducibility for the identification of edge dissection, tissue prolapse, intrastent dissection and malapposition was excellent. The inter- and intraobserver reproducibility showed a certain degree of variability, especially for malapposition assessment. In the present study, malapposition was evaluated by visual assessment. This qualitative analysis can be affected by the artifact of the shadow produced by the struts. Furthermore, in drug-eluting stents, the presence of polymer must be taken into account when evaluating malapposition and a correction for the strut thickness of each individual stent type should be applied. The use of a quantitative method to define malapposition could help to improve the inter- and intraobserver reproducibility.25,26
The assessment of stent malapposition is of clinical relevance as there is IVUS data suggesting a possible relationship between this phenomenon and stent thrombosis.27 Previous studies have suggested increased malapposition at overlap areas and in closed cell designs.25 This could represent a potential link to stent fracture and restenosis.
A previous OCT study by our group reported that after stent implantation tissue prolapse was visible in 97.5%, intra-stent dissection in 86.3% and edge dissection in 25% of the cases. Furthermore, 63.8% of the patients showed at least one malapposed strut. This study showed also that those findings were not associated with clinical events during the hospitalization.18 However, the long-term implications are not known and should be the objective of future studies. Second-generation OCT has made this information much more accessible due to a simplified acquisition procedure. This greatly facilitates studies to understand the clinical relevance of these findings in large patient populations, especially with quantitative assessment methods for malapposition.
Plaque Characterization Reproducibility
The present study demonstrates also an excellent interstudy reproducibility for plaque characterization. Fifty-seven out of the 60 plaques were classified congruently in both pull-backs. There were only 3 cases of misclassification between fibrous and lipid-rich plaques. The observed inter and intraobserver variability for plaque characterization is in line with reported with TDOCT in-vitro data (k=0.88 and 0.91 for inter- and intraobserver, respectively).5 In vivo, Jang et al reported acceptable intraobserver concordance for lipid-rich plaque (k=0.86) and calcification (k=0.88), with a higher interobserver variability (lipid-rich plaque k=0.47, calcification k=0.57).28 In contrast to earlier reported data, that have highlighted the risk of misclassification between lipid pools and calcium deposits,29 in our series the most frequent disagreement between observers concerned the classification of fibrous and lipid-rich plaques. This might be related with the presence of artifacts derived from the catheter position or its optical efficiency during rotation. These artifacts can create false low scattering regions that can be misinterpreted as lipid-rich plaques. Quantitative plaque characterization methods under development could help to overcome the limitations of observer-dependent, visual evaluation.30 Three-dimensional reconstructions of human coronary stented arteries with plaque characterization and macrophages detection derived from optical frequency domain imaging have been reported.14 This opens new possibilities for the in vivo evaluation of coronary atherosclerosis and the effect of coronary stenting.
The assessment of plaque characteristics in the catheterization laboratory can be helpful to guide PCI (eg, to recognize the lower distensibility of heavily calcified lesions) and has potential value for the detection of plaques with high risk of rupture. Compared to histology, OCT has proven to have high sensitivity and specificity to detect some of the features associated with rupture-prone lesions such as necrotic core, presence of macrophages and thin fibrous cap.5,6,8,31-34
Limitations
The present study is observational and has a limited sample size. To assess the interstudy reproducibility the pull-back was repeated twice under identical conditions. We acknowledge that the change in the acquisition conditions might affect the inter-study reproducibility. Even when we tried to include a variety of atherosclerotic plaques with different morphology and composition, the preselection of the plaques might have influenced the reproducibility. We acknowledge that some of the findings defined as tissue prolapse may correspond to thrombus, as the differentiation between those 2 entities after stent implantation can be difficult.
CONCLUSIONS
The second generation OCT technology (FD-OCT) with high speed data acquisition shows good inter-study, interobserver and intraobserver reproducibility for plaque characterization and stent implantation assessment in patients undergoing PCI.
ACKNOwLEDGMENTS
This study was supported in part by Ligthlab Imaging Inc and the Wellman Center of Photomedicine. We would like to thank Robert Beurskens for invaluable technical assistance with the imaging systems.
ABBREVIATIONS
FD: Fourier domain
OCT: optical coherence tomography
PCI: percutaneous coronary intervention
TD: time domain
SEE ARTICLE ON PAGES 885-7
This study was partially financed by Ligthlab Imaging, Inc., and Wellman Center of Photomedicine.
Correspondence: E. Regar, MD, PhD,
Thoraxcenter, Bd 585,
's-Gravendijkwal 230. 3015-CE Rotterdam. The Netherlands
E-mail: e.regar@erasmusmc.nl
Received December 11, 2009.
Accepted for publication February 19, 2010.