In other words, the signification of One antagonistic action necessarily includes the signification of the Other… Jean-Paul Sartre, 1960.
Right and left ventricular (RV/LV) diastolic filling involves rapidly changing flow in a chamber with geometry undergoing temporal changes in size and shape; the right ventricle is the most challenging to model analytically, looking triangular when viewed from the front, and having irregular crescent-shaped transverse cross-sections.1 Accordingly, diastolic fluid dynamics in health and disease are fraught with difficulties.2 All the same, ventricular diastolic filling abnormalities and diastolic dysfunction are important components of heart failure, recognized in the current International Classification of Diseases (ICD-10, codes I50.30-33). It is now widely appreciated that the clinical significance of diastolic dysfunction is far-reaching.3
However, the fact that RV/LV filling is dependent on a large number of factors and interactions renders its clinical assessment and evaluation difficult. In this brief article, I will focus on clinically important cardiodynamic concepts concerning interactions of underlying fluid dynamic mechanisms with intracardiac filling patterns.1,4–7 These interactions are responsible for the smallness of measurable transvalvular atrioventricular and intraventricular filling pressure gradients.
Intraventricular ejection pressure gradient: intrinsic component of the total systolic right ventricular/left ventricular loadOver the past two decades, substantial work has been accomplished in simulating ventricular ejection flows in health and disease using both geometric approximations, such as ellipsoidal and cylindrical chamber models, and realistic dynamic geometries based on individual patient or experimental animal digital imaging data.2 These groundbreaking computational fluid dynamic simulations complemented clinical cardiac catheterization studies, which demonstrated the existence of large transvalvular and intraventricular ejection pressure gradients and revealed their causative mechanisms. These mechanisms generally2,8,9 entail convective (the velocity changes with the changing position of fluid particles in the flow) and local (the velocity changes with time at any given point in the flow) accelerations and decelerations of intraventricular flow. Under special conditions/states,9 viscous (frictional) losses can become prominent as well.
Based on this work, I proposed that the intraventricular ejection pressure gradient constitutes the intrinsic component of the total systolic ventricular load, which acts in-series with the extrinsic component that embodies the aortic root ejection pressure waveform.9 Subsequent work at the Hospital Universitario Gregorio Marañón in Madrid has shown that, under ordinary circumstances entailing only minor viscous effects, ejection intraventricular pressure gradients can be measured by processing color M-mode Doppler data.10,11
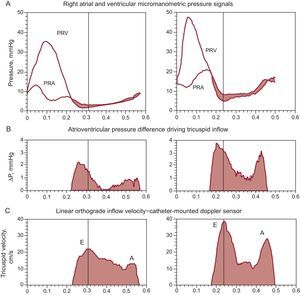
Intraventricular pressure gradients during diastoleIn 1979, pioneering studies at Duke University12 demonstrated, in chronically instrumented conscious dogs, a 2mmHg to 5mmHg micromanometric left intraventricular early filling pressure gradient. Further animal and clinical RV/LV measurements have confirmed under diverse conditions in absence of valvular stenosis the existence of variable in magnitude atrioventricular and intraventricular diastolic pressure gradients.1,2,4–7,13–15Figures 1 and 2 show representative time-courses of atrioventricular diastolic pressure gradients, obtained using custom multisensor catheters (Millar Instruments; Houston, TX) positioned under fluoroscopic guidance such that the upstream micromanometer was just at the plane of the atrioventricular valve anulus (tricuspid and mitral in Figs. 1 and 2, respectively) and the downstream one 5cm distally, at the catheter-tip, near the apex; a Doppler velocimeter was 3cm proximal to the tip-micromanometer.2 Comprehensive investigations of time-varying tricuspid transvalvular pressure differences showed them2,5 to possess dynamic characteristics, including timing features relative to the pulsatile inflow velocity, similar to those reported by Isaaz16 for the mitral transvalvular pressure drop.
 after surgically created tricuspid regurgitation and 1 week later (right). Note the pressure levels and the atrial “cannon v-wave.” At peak tricuspid inflow velocity (vertical hairlines), the transvalvular pressure difference, ΔP, has already declined markedly from its peak value. E and A denote the E- and A-waves of diastolic inflow. PRA, right atrial pressure; PRV, right ventricular pressure. Adapted, slightly modified, from Pasipoularides et al.5")
A: Right-sided transvalvular atrioventricular pressures. B: Atrioventricular transvalvular pressure difference. C: Tricuspid inflow velocity. These measurements were obtained on an experimental dog by multisensor right-heart catheter, approximately 0.5 h (left) after surgically created tricuspid regurgitation and 1 week later (right). Note the pressure levels and the atrial “cannon v-wave.” At peak tricuspid inflow velocity (vertical hairlines), the transvalvular pressure difference, ΔP, has already declined markedly from its peak value. E and A denote the E- and A-waves of diastolic inflow. PRA, right atrial pressure; PRV, right ventricular pressure. Adapted, slightly modified, from Pasipoularides et al.5

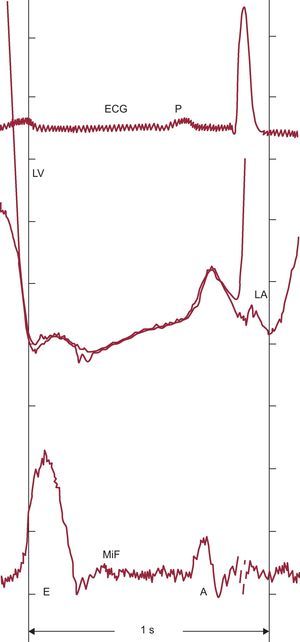
Resting transmitral pressure-flow relationships obtained by multisensor left-heart catheter throughout diastolic filling in a supine patient evaluated for chest pain and found to have normal ventricular function. Mitral inflow acceleration is associated with a favorable atrioventricular pressure gradient and deceleration with an adverse gradient. Mitral inflow begins with a small component related to the unloading of the mitral valve apparatus as left ventricular pressure decreases during isovolumic relaxation. E and A, E- and A-waves of diastolic inflow; ECG, electrocardiogram; LA, left atrial pressure; LV, left ventricular pressure; MiF, mitral inflow velocity. Adapted, slightly modified, with permission of PMPH-USA from Pasipoularides.2
Generally, catheterization measurements are limited to global quantities (cf. “LV pressure”), or to values at a small number of points in space and time. It is impossible to obtain through multisensor (micromanometric/velocimetric) catheters high-density spatiotemporal diastolic pressure and velocity distributions. To obtain such high-density data, the functional imaging method for the investigation of intracardiac blood flows was developed by our group at the Cardiac Surgical Research Laboratory at Duke University and the Duke/NSF Center for Emerging Cardiovascular Technologies.
The functional imaging method allows the movement—contraction or expansion—of the inner (endocardial) ventricular surface to drive the flow during ejection or filling, and lends itself well to patient-specific simulations and evaluations of intracardiac flows. Validation and clinical application of the method is facilitated by the remarkable advances in noninvasive cardiac imaging modalities.1,2,17–19 Digital imaging allows clinical acquisition of high-quality images that describe dynamic cardiac anatomy and function; these images provide operational high-resolution spatiotemporal geometric data for flow simulations in individual patients or experimental animals. The functional imaging method combines geometric modeling of the cardiac chambers throughout the cardiac cycle with computational flow analysis. The intraventricular flow-field is computed during successive phases of the cardiac cycle by incorporating the dynamic wall geometry into the flow-governing Navier-Stokes equations.2
Instantaneous RV intraventricular diastolic pressure gradients are smaller2,5,15 than their LV counterparts and are not generally amenable to reliable direct measurements even by micromanometric catheter. Functional imaging1,2,4–6 has revealed information on important diastolic RV dynamic flow behavior that was previously inaccessible. By allowing analytical apportionment of the total instantaneous intraventricular gradient into its components, it has provided deep insights into diastolic fluid dynamics with important clinical implications in the normal and failing (dilated) RV/LV chamber. It is instructive to analyze next the instantaneous distributions of pressure along the diastolic chamber flow-axis. Additional information on the interplay of convective with local acceleration effects in the strongly time-dependent and spatially nonuniform RV/LV intraventricular diastolic flow fields, and on their complicated stability characteristics, can be found in publications that are being surveyed here.1,2,4–6,20
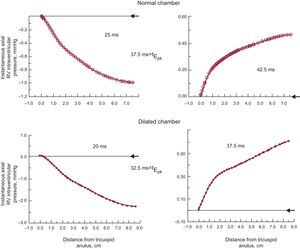
Local and convective acceleration components of the diastolic pressure gradientDiscrete points along the RV chamber's axis exhibit different patterns of pressure values at any given time during filling, as is shown in Figure 3; conceptually comparable dynamics apply for the filling LV chamber as well. To put the data in Figure 3 in proper perspective consider that, according to Braunwald's Heart disease, 6th ed. (p. 1690), the diagnosis of tricuspid stenosis requires an atrioventricular mean gradient (by fluid-filled catheter) of only 2mmHg, and that a mean gradient of 5mmHg is associated with overt systemic venous congestion.
 chamber, before (left panels) and shortly after (right panels) the time (tEpk) of the peak of the E-wave. At tEpk, the pressure distribution is transformed from a favorable (pressure decreasing distally) to an adverse (pressure increasing distally) axial pressure gradient. Arrowheads at the right margin of each panel indicate the zero pressure level at the tricuspid anulus. Note the different pressure scales in the individual plots.")
The axial apportionment of the instantaneous total pressure gradient between tricuspid anulus and apex is shown in a normal and a dilated right ventricular (RV) chamber, before (left panels) and shortly after (right panels) the time (tEpk) of the peak of the E-wave. At tEpk, the pressure distribution is transformed from a favorable (pressure decreasing distally) to an adverse (pressure increasing distally) axial pressure gradient. Arrowheads at the right margin of each panel indicate the zero pressure level at the tricuspid anulus. Note the different pressure scales in the individual plots.
Acceleration is a measure of the rate of change in velocity. If the velocity vector in a flow field changes with both location and time, then the total instantaneous acceleration of fluid particles can be due to changes in velocity with respect to both space and time. The corresponding components are the convective and the local acceleration, respectively. With the exception of the time of peak volumetric inflow when local acceleration vanishes, both local and convective components make their individual contributions to the total measured pressure gradient in the course of the E- and A-waves and throughout diastole.
Because positive acceleration (rising velocity) is associated with a drop in pressure in the flow direction, the local acceleration (δv/δt) component entails a pressure decrease from the inflow orifice to the apex during the upstroke of the E-wave. Simultaneously, however, the flow velocity (v) decreases from the inflow orifice to the expanding chamber walls (convective deceleration), because the flow cross-section expands. The total (measured) pressure gradient is therefore the algebraic sum of a pressure decrease contributed by the local acceleration (proportional to δv/δt) and the pressure rise contributed by the convective deceleration (proportional to v2).
Turning to Figure 3, at the instants 25ms after onset of the E-wave upstroke in the normal and 20ms in the dilated chamber (left panels), the local acceleration effect predominates completely since v and a-fortiori v2 levels are still low; this leads to the monotonic decrease in pressure from the inflow anulus to the apex, ie, an accelerating pressure gradient reflected in the E-wave upstroke. At 5ms after the peak of the E-wave, tEpk, both in the normal and the dilated chamber (right panels), the pressure distribution is transformed from a favorable (accelerating) to an adverse for apically directed inflow (ie, a decelerating) axial pressure gradient. Conceptually similar dynamics apply during the A-wave.2,5
Why are measured intraventricular filling pressure gradients small?Before our functional imaging studies1,2,4–6 from which the data shown in Figure 3 were extracted, the convective intraventricular pressure rise, demonstrated in Figure 3, during the early downstroke of the E-wave had never been previously demonstrated or commented upon. It has crucial implications for diastolic cardiac hemodynamics. Since during the E-wave upstroke the total measured pressure gradient of intraventricular flow is the algebraic sum of the pressure decrease contributed by local acceleration and the pressure rise contributed by convective deceleration, the 2 components are mutually opposed to each other, ie, antagonistic. This partially offsetting action5 is what underlies the peculiar smallness of the micromanometric early diastolic intraventricular gradients, which contrasts with the prominence of the micromanometric early intraventricular ejection gradient.
The convective pressure-rise between inflow orifice and the inner surface of the chamber involves the well-known Bernoulli equation. In principle, it has the same causative mechanism as the now familiar pressure recovery in valvular aortic stenosis, downstream of the vena contracta, as the jet expands in the ascending aorta.8,9,21,22 The downstream pressure can recover very markedly in conjunction with the decrease in the linear velocity and hence the kinetic energy of the flow, as required by the Bernoulli principle. As has been noted in the international literature,21,22 pressure loss recovery itself was a previously unreported catheterization finding at the time that I gave the first micromanometric/analytical evidence that it can occur in the ascending aorta of patients with aortic stenosis.9
At tEpk, the local acceleration component vanishes and the total pressure gradient is convective and adverse; forward flow is transiently maintained shortly thereafter under its previously built-up momentum. In the ensuing initial E-wave downstroke, the strongly unfavorable pressure gradient (Fig. 3, right panels) is the sum of adverse pressure increases along the flow path from both local and convective flow decelerations. Shortly after the initiation of the downstroke of the E-wave, the overall adverse pressure gradient causes flow separation and inception of recirculation with a vortex ring surrounding the central inflowing stream.2,4,5 This thwarts the convective pressure rise, because the swirling vortex shunts the kinetic energy of the inflowing stream into the kinetic energy of vortical swirl; the latter energy is ultimately dissipated as heat.2,4,5,20 Similar dynamics apply for the A-wave. Thus, diastolic RV/LV intraventricular pressure gradients measured at cardiac catheterization are small.2
Contrariwise, during systolic ejection, through the upstroke of the velocity waveform the convective and local acceleration effects act in the same sense, actually reinforcing each other.2,9 These contrasting interactions of the two main components of the diastolic and systolic total pressure gradient as measured by micromanometric catheters underscore the much more prominent total intraventricular gradient during the upstroke of the ejection waveform than the upstroke of the filling E-wave, especially under hyperdynamic conditions, such as during exercise when both convective (proportional to v2) and local acceleration (proportional to δv/δt) components of the measured gradients are augmented.2
ConclusionsMicromanometric/velocimetric multisensor cardiac catheterization studies in patients and experimental animals have shown measurable but small diastolic RV/LV intraventricular filling pressure gradients. This brief survey clarifies the reasons underlying their apparent smallness. During the E-wave upstroke, the total measured pressure gradient of intraventricular flow is the algebraic sum of two mutually opposed components acting along the flow direction: a pressure decrease contributed by local acceleration (the rate of increase in velocity with time at a given point in the flow) and a pressure rise contributed by convective deceleration (the rate of decrease of the velocity due to the change of position of fluid particles in the flow). The convective pressure-rise between inflow orifice and the inner surface of the chamber has the same causative mechanism as the familiar pressure loss recovery in valvular aortic stenosis, downstream of the vena contracta, as the jet expands in the ascending aorta. At peak inflow rate, the total pressure gradient is convective and adverse; forward flow is transiently maintained shortly thereafter under its previously built-up momentum. In the E-wave downstroke, both local and convective decelerations act concordantly, contributing to a strongly adverse pressure gradient in the flow direction; this induces oncoming flow separation from the expanding RV/LV walls and inception of recirculation (a ring-vortex). This thwarts the convective Bernoulli pressure-rise because the filling vortex shunts inflow kinetic energy into vortical swirl energy, which is ultimately dissipated as heat. Similar dynamics apply for the A-wave. Consequently, intraventricular diastolic RV/LV micromanometric gradients measured at cardiac catheterization are small.
FundingResearch support, for work from my Laboratory surveyed here, was provided by the National Heart, Lung, and Blood Institute, Grant R01 NIH 50446; National Science Foundation, Grant CDR 8622201; and North Carolina Supercomputing Center/Cray Research.
Conflicts of interestNone declared.