
Cardiovascular risk screening requires accurate risk functions. The relative validity of the Framingham-based REGICOR adapted function is analyzed and the population distribution of cardiovascular 10-year cardiovascular events is described by risk group.
MethodsA population cohort of 3856 participants recruited between 1995 and 2000, aged 35 to 74years from Girona without symptoms of cardiovascular diseases, was followed between 2006 and 2009. Standardized laboratory and blood pressure measurements, questionnaires, and case definitions were used. The follow-up combined cross-linkage of our databases with our regional mortality registry, reexamination, and telephone contact with participants. Coronary disease endpoints alone were considered.
ResultsA total of 27 487 person-years were obtained (mean follow-up 7.1years), and the follow-up was achieved in 97% of participants (120 coronary disease events). Validity was good: the regression coefficients estimated with the cohort data did not differ from those obtained in the original Framingham function. Function calibration was good: the observed incidence of cardiovascular events in the decile groups of risk did not differ from the function prediction (P=.127 in women, and P=.054 in men). The C statistic (discrimination) was 0.82 (95% confidence interval, 0.76-0.88) in women, and 0.78 (95% confidence interval, 0.73-0.83) in men. More than 50% of cardiovascular events occurred in participants whose 10-year risk was 5% to 14.9%.
ConclusionsThe studied function accurately predicts coronary disease events at 10years. Risk stratification could be simplified in 4 groups: low (<5%), moderate (5%-9.9%), high (10%-14.9%) and very high (≥15%).
Keywords
The most cost-effective way of controlling the burgeoning health care burden and the mortality associated with cardiovascular (CV) diseases resides in reducing their incidence.1, 2 However, the best way of achieving this goal is not clear.3, 4, 5 Prevention of CV diseases can be divided into 2 basic approaches. On the one hand, there are population-based health interventions in which healthy lifestyles such as physical activity, balanced diet, and not smoking are promoted,6 while on the other there is opportunistic screening during consultations. This screening is performed using CV risk functions that assess and quantify the 10-year risk of suffering CV disease. These are multifactorial functions that provide a score based on sex, age, and traditional CV risk factors.7 They have the advantage of being simple and easy to understand, both for physicians and patients.8 To ensure that these functions can be applied to populations with different CV risks, they have had to be adapted to the different epidemiological characteristics of each country.9, 10, 11 The REGICOR (Registre Gironí del Cor) function, which is an adaptation of the Framingham function to the incidence of ischemic heart disease and prevalence of local risk factors,11, 12 was validated in a Spanish sample followed up for 5years.13
The cut-points for defining groups of low, moderate, or high risk have practical implications when it comes to deciding on pharmacological interventions. The risk structure depends on potential benefits expressed in terms of preventable events according to the risk distribution in the population and is usually defined by consensus among experts. In the original Framingham function, the traditional risk ranges were considered as follows:<5% as low risk, 5%-9.9% moderate risk, 10%-19.9% moderate risk, 20%-39.9% high risk, and ≥40% very high risk. In Spain, the recommendation was to use a cut-point of 10% for 10-year risk when using the adapted REGICOR function to guide decisions of when to initiate pharmacological treatment of dyslipidemia.14, 15, 16
It is important to refine the risk functions as far as possible to identify more accurately the population at risk of CV risk.17
The objectives of the present study were to study the population distribution of 10-year CV risk and to analyze the validity, calibration, and discrimination of the Framingham-based REGICOR function for coronary events.
Methods Design and ParticipantsFrom a cohort of 4782 individuals (1748 recruited in 1994 and 3034 in 2000) aged between 25 and 74years in the province of Girona, Spain, follow-up of the 3782 who met the eligibility criteria was carried out between 2006 and 2009. The following individuals were excluded from the present analysis: individuals who refused to participate, those who already had symptomatic heart disease on inclusion, and those under 35years of age.
Participants were chosen by 2-phase random sampling. In the first phase, populations were selected; in the second, the same number of men and women for each population, stratified by 10-year age groups, were selected from the most recent census (1991 and 2001, respectively). The rate of participation was above 71% in both studies.18
MeasurementsBriefly, the measures of the participants that concern the present study were performed using standard procedures.18, 19 The investigators administered a questionnaire adapted to patients with a history of diabetes mellitus, hypertension, dyslipidemia, and their treatments. Blood pressure was measured after 5min resting with a mercury sphygmomanometer in 1995 individuals and automatic aneroid sphygmomanometer in 2000. These devices were regularly calibrated and the best of 2 measurements, taken 10min apart, was used.
A blood sample was taken for all participants after 10h to 14h fasting. This was used to measure total cholesterol, glucose, and triglycerides by enzymatic methods, and high-density lipoprotein cholesterol (HDL-C) by a direct method (Roche Diagnostics, Basel, Switzerland).18 The concentration of low-density lipoprotein cholesterol was estimated using the Friedewald formula when the triglyceride levels were less than 300mg/dL.
For reporting purposes, the following definitions were used: a) hypertension, participants previously diagnosed or treated or who had systolic blood pressure ≥140mmHg or diastolic blood pressure ≥90mmHg; b) diabetes mellitus, participants previously diagnosed or treated or who had fasting blood glucose levels ≥126mg/dL; c) smoking habit, smokers of 1 or more cigarettes per day and ex-smokers who had smoked for at least 1 year; and d) hypercholesterolemia, participants with total cholesterol ≥240mg/dL or those previously diagnosed or treated.
Follow-up and Events of InterestFollow-up of the cohort included a structured telephone interview of the participants to determine whether they had suffered any CV disease since they were included in the study. Chest angina or fatal or nonfatal myocardial infarction were the events of interest considered.
When vital status was not known, the participant database was checked against the Death Registry of Catalonia and the Mortality Log of the Health Ministry to identify individuals who died and the underlying cause of death recorded on the medical examiner's report. Diagnoses were collected from autopsies if performed, and the medical records of the hospitals were reviewed for deaths attributable to CV causes.
To validate nonfatal events, the medical records of those who had suffered stroke, myocardial infarction, or chest angina were investigated.
After examining the information collected in each case, a data review committee classified the events according to a standard methodology. Angina was defined when any of the following criteria was met: ST changes in the electrocardiogram associated with chest pain that resolved when the chest pain resolved, coronary angiography with >50% occlusion, positive exercise test, or any other test for myocardial ischemia with a positive finding. For diagnosis of myocardial infarction, the criteria of the World Health Organization and the new definitions of myocardial infarction were followed.19 Patients with stroke were those with hemorrhagic stroke as the primary hospital diagnosis, whether ischemic or not: the data review committee took into account symptoms and the results of computed tomography. Subarachnoid bleeding and transient ischemic disease were excluded.
Ethical AspectsParticipants signed an informed consent on enrollment. This consent included, among other things, permission for subsequent follow-up. The local ethics committee approved the studies and participants were informed of the results of the tests. National and international guidelines on the conduct of clinical trials and Spanish legislation concerning data privacy were followed.
Statistical AnalysisA descriptive analysis was performed of the continuous variables, which were expressed as mean (standard deviation) or median (interquartile range) if they did not follow a normal distribution. Categorical variables were presented as percentages.
A multiple imputation method (10 imputations) was used to estimate missing data points in variables needed to calculate the CV risk of 379 participants (9.7%).20 Only 8 patients were excluded because of variability exceeding percentile 97.5 in the estimates obtained.
The exploratory analyses performed on the distribution of coronary events according to the original Framingham coronary risk groups and then applied to the recalibrated REGICOR function indicated that the risk classification best adapted to clinical needs was to consider four risk categories at 10years, in accordance with the Framingham-based REGICOR function: < 5%, 5%-9.9%, 10%-14.9%, and ≥ 15%.
The relative validity of the function was analyzed by comparing coefficients of the original Framingham functions of each variable for each sex with those estimated by Cox proportional risks models and fitting to the data from our cohort (best Cox), using the z score test.9, 21 For reasons of statistical power, the models were fitted using total cholesterol and HDL-C as continuous variables.
To determine the calibration (precision of the estimate of absolute risk in comparison with the actual incidence rates) of the function adapted to the observed event rates, a calibration test was used for each sex. The version created by D’Agostino and Nam of the Hosmer and Lemeshow goodness-of-fit test was used, based on a χ2 test for 10 risk groups (deciles) according to the function.10, 21 The discrimination, or capacity of the adapted model to separate the participants who presented an event from those who did not, was analyzed by the C statistic by sex. This statistic includes an implicit combined evaluation of sensitivity and specificity of the model, which can be represented by receiver operating characteristics. Values of around 0.5 indicate that the model does not discriminate any better than chance, whereas values greater than 0.7 indicate an appropriate discrimination.
Kaplan-Meier survival curves were used to calculate the cumulative rate of incidence of coronary events.
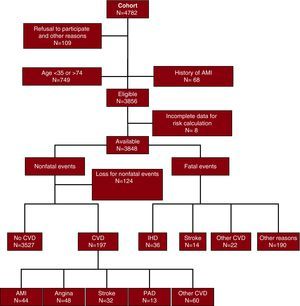
ResultsOf the 4782 participants recruited in 1995 and 2000, 934 were excluded for a variety of different reasons (Figure 1). The follow-up rate of 3848 participants without CV disease finally included was 100% for death and 96.8% for nonfatal events. The 3724 participants who were able to complete follow-up accumulated 27 487 person-years of follow-up, with a mean follow-up of 7.1 (2.8) years.

Figure 1. Participants and flow diagram for inclusion of participants, and onset of first fatal and nonfatal events during follow-up (only the first event is reported in nonfatal cases when there was more than 1 event during follow-up; events were ranked as follows: myocardial infarction > angina > stroke > peripheral artery disease > other cardiovascular conditions). AMI, acute myocardial infarction; CVD, cardiovascular disease; IHD, ischemic heart disease; PAD, peripheral artery disease.
The baseline characteristics of the 3724 participants in the cohort with complete follow-up are presented in Table 1. The proportion of the population aged 35 to 50years with total cholesterol <180mg/dL, blood pressure <120/<80mmHg, who had never smoked and were not diabetic was approximately 5.8%. The proportion of participants with total cholesterol <240mg/dL, blood pressure <140/<90mmHg, who had never smoked and who were not diabetic was 37.1%.
Table 1. Characteristics of the 3724 Participants in Girona Who Completed Follow-up in the Cohort Study of Patients Recruited Between 1995 and 2000 Patients in the REGICOR (Registre Gironí del Cor) Study
| Women | Men | P | |
| Patients | 1934 | 1790 | |
| Age, years | 54.1 (11.0) | 54 (11.3) | .74 |
| Smoking habit, % | 268 (14.0) | 548 (31.2) | <.001 |
| Systolic blood pressure, mmHg | 129.5 (21.8) | 136.1 (19.0) | <.001 |
| Diastolic blood pressure, mmHg | 77.4 (10.3) | 81.6 (9.9) | <.001 |
| Blood pressure, % | 843 (45.4) | 887 (51.7) | <.001 |
| Pharmacological treatment of hypertension a , % | 316 (37.5) | 202 (22.8) | <.001 |
| Blood glucose level (mg/dL) | 101.3 (24.2) | 108.3 (28.7) | <.001 |
| Diabetes mellitus, % | 241 (12.9) | 296 (17.2) | <.001 |
| Pharmacological treatment of diabetes b , % | 72 (30.5) | 86 (29.2) | .734 |
| Total cholesterol, mg/dL | 228 (43.5) | 224.2 (41.2) | .008 |
| HDL cholesterol, mg/dL | 55.7 (13.5) | 46.7 (11.6) | <.001 |
| LDL cholesterol, mg/dL | 153.1 (39.5) | 153.3 (37.1) | .883 |
| Hypercholesterolemia (> 240 mg/dL or treated), % | 724 (39.8) | 614 (36.4) | .039 |
| Lipid-lowering therapy, % | 130 (6.8) | 113 (6.3) | .606 |
HDL, high-density lipoproteins; LDL, low-density lipoproteins.
Data are expressed as mean (standard deviation) or n (%).
a With respect to all hypertensive patients.
b With respect to all patients with diabetes.
Table 2 shows, by sex, the distribution of participants and the proportion of CV events in 4 coronary risk groups in the 10-year follow-up of the 3724 participants with complete follow-up. Of note is that most of the CV events accrued in the populations whose 10-year CV risk was between 5% and 15%: 61.4% in men and 45.9% in women. Moreover, 46.8% of the events occurred in the <5% risk group. The detailed distribution of events is shown in Figure 1.
Table 2. Ten-year Incidence Rate by Kaplan-Meier Method, Number of Participants in the Girona Cohort Aged 35 to 74 Years and Proportion of Cardiovascular Events in the 4 Cardiovascular Risk Groups in the 3724 Participants With Complete Follow-up, by Sex
| 10-year cardiovascular risk, % | < 5 | 5-9.9 | 10-14.9 | ≥ 15 | Total |
| Women | |||||
| Population | 1508 | 349 | 57 | 20 | 1934 |
| Population in the group, % | 78 | 18 | 2.9 | 1.0 | 100 |
| Mean Predicted Risk in the group, % | 2.1 | 6.7 | 11.9 | 17.4 | 3.4 |
| 10-year incidence IHD, % | 2.0 | 8.4 | 7.6 | 23.1 | 3.6 |
| 10-year incidence of CV events, % | 0.9 | 0.3 | 3.6 | 5.0 | 0.9 |
| Incidence of IHD or CV events, % | 2.9 | 8.7 | 11.2 | 27.4 | 4.5 |
| Number of IHD in 10 years | 16 (35.6) | 20 (44.4) | 6 (13.3) | 3 (6.7) | 45 (100) |
| Number of CV events in 10 years | 14 (77.8) | 1 (5.6) | 2 (11.1) | 1 (5.6) | 18 (100) |
| Number of IHD or CV events in 10 years | 29 (46.8) | 21 (33.9) | 8 (12.9) | 4 (6.5) | 62 (100) |
| Men | |||||
| Population | 941 | 550 | 183 | 116 | 1790 |
| Population in the group, % | 52.6 | 30.7 | 10.2 | 6.5 | 100 |
| Mean predicted risk in the group, % | 2.8 | 7.1 | 12.0 | 19.9 | 6.2 |
| 10-year incidence IHD, % | 2.4 | 5.5 | 15.8 | 14.8 | 5.6 |
| 10-year incidence of CV events, % | 1.0 | 4.1 | 6.7 | 10.5 | 3.1 |
| Incidence of IHD or CV events, % | 3.4 | 8.6 | 20.5 | 24.4 | 8.2 |
| Number of IHD in 10 years | 15 (20.0) | 24 (32.0) | 22 (29.3) | 14 (18.7) | 75 (100) |
| Number of CV events in 10 years | 5 (16.7) | 13 (43.3) | 6 (20) | 6 (20) | 30 (100) |
| Number of IHD or CV events in 10 years | 20 (19.8) | 35 (34.7) | 27 (26.7) | 19 (18.8) | 101 (100) |
CV, cardiovascular; IHD, ischemic heart disease.
Table 3 shows the regression coefficients of the variables of the original Framingham function and those obtained in the best Cox model of the function adjusted to the follow-up data of the REGICOR cohort, including exclusively coronary events. In no case was there a significant difference between the 2 coefficients. These results were maintained even after adjustment for lipid-lowering therapy and antihypertensive therapy.
Table 3. Comparison of the Original Coefficients for the Variables of the Framingham Equation With Those Obtained in a Cox Proportional Hazards Model Fitted to the Data From the Girona Cohort by Sex
| Women | Men | |||||||||
| Original Framingham | REGICOR best Cox | z-score | Original Framingham | REGICOR best Cox | z-score | |||||
| Coefficient | SE | Coefficient | SE | P | Coefficient | SE | Coefficient | SE | P | |
| Age | 0.338 | 0.074 | 0.217 | 0.23 | .617 | 0.049 | 0.005 | 0.071 | 0.014 | .133 |
| Age2 | –0.003 | 0.001 | –0.001 | 0.002 | .422 | — | — | |||
| Total cholesterol, 1 mg | 0.005 | 0.002 | 0.005 | 0.004 | .944 | 0.007 | 0.001 | 0.013 | 0.003 | .073 |
| HDL cholesterol, 1 mg | –0.027 | 0.005 | –0.045 | 0.014 | .216 | –0.027 | 0.005 | –0.054 | 0.013 | .051 |
| Blood pressure classification | ||||||||||
| SBP<120 and DBP<80 | –0.52 | 0.256 | –1.213 | 0.835 | .427 | –0.009 | 0.194 | –0.581 | 0.605 | .368 |
| SBP 120 to ≤ 129 or SDP 80 to ≤ 84 | — | — | — | — | ||||||
| SBP 130 to ≤ 139 or SDP 85 to ≤ 89 | –0.049 | 0.231 | 0.06 | 0.545 | .854 | 0.275 | 0.171 | –0.011 | 0.459 | .559 |
| SBP 140 to ≤ 159 or SDP 90 to ≤ 99 | 0.269 | 0.205 | –0.545 | 0.536 | .156 | 0.524 | 0.159 | 0.243 | 0.405 | .518 |
| SBP ≥ 160 or DBP ≥ 100 | 0.485 | 0.218 | 0.466 | 0.516 | .973 | 0.631 | 0.173 | 0.392 | 0.437 | .61 |
| Diabetes mellitus | 0.617 | 0.212 | 0.36 | 0.354 | .533 | 0.417 | 0.177 | 0.085 | 0.288 | .326 |
| Current smokers | 0.283 | 0.142 | 0.843 | 0.663 | .408 | 0.53 | 0.104 | 0.594 | 0.258 | .817 |
DBP, diastolic blood pressure; HDL, high-density lipoproteins; SBP, systolic blood pressure; SE, standard error.
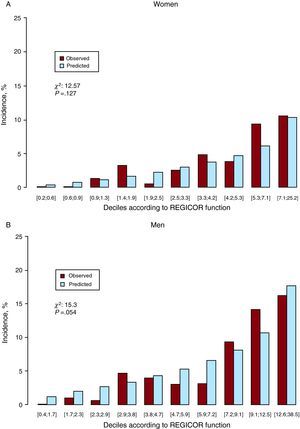
Figure 2 shows the distribution of coronary events observed in the cohort for the deciles of risk predicted by the Framingham-based REGICOR function. The rate of adverse events observed within each decile of risk did not differ significantly from that predicted by the risk function (calibration): adapted Hosmer test, P=.127 for women and P=.054 for men.

Figure 2. Calibration of the Framingham-based REGICOR risk function for the prediction of coronary events at 10years: predicted and observed events by risk deciles.
The C statistic for the sex-adapted Framingham function was 0.82 (95% confidence interval [CI], 0.76-0.88) in women and 0.78 (95% CI, 0.73-0.83) in men.
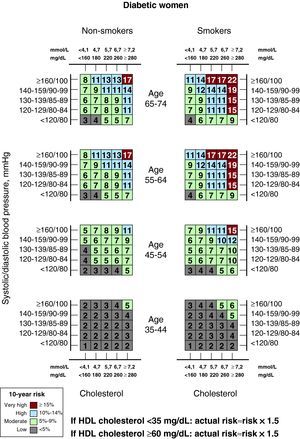
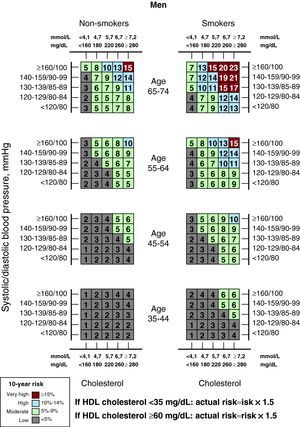
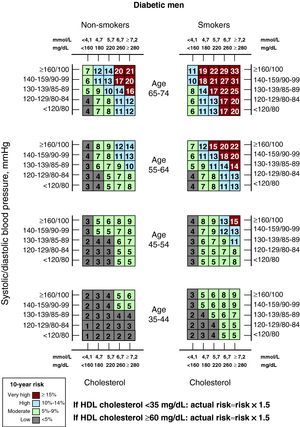
DiscussionThe results of the present study confirm the relative validity of the Framingham-based REGICOR coronary risk function, and indicate that 56% of the CV events (60% of coronary events and 46% of cerebrovascular events) occur in individuals with a 10-year risk of between 5% and 15%. These findings confirm those of the VERIFICA study in the cohort followed for 5years.13 We propose to simplify the levels of risk derived from the REGICOR function into 4 strata: <5%, which would indicate low risk; 5%–9.9%, which would indicate moderate risk; 10%–14.9%, which would indicate high risk; and ≥15%, which would indicate very high risk (Figure 3). This new stratification distributes the population according to the risk function and the distribution observed for events: it is aimed to avoid the artificial existence of subgroups of risk with few individuals and even fewer cases (such as >20% at 10years).There were more events in the groups with moderate and high risk, even though the incidence rate was not very high.

Figure 3. Framingham-based REGICOR risk function, simplified into 4 risk groups based on the risk cut-points at 10years proposed by experts from several autonomous regions and in the concentration of events. HDL, high-density lipoproteins.

Figure 3. Framingham-based REGICOR risk function, simplified into 4 risk groups based on the risk cut-points at 10years proposed by experts from several autonomous regions and in the concentration of events. HDL, high-density lipoproteins.

Figure 3. Framingham-based REGICOR risk function, simplified into 4 risk groups based on the risk cut-points at 10years proposed by experts from several autonomous regions and in the concentration of events. HDL, high-density lipoproteins.

Figure 3. Framingham-based REGICOR risk function, simplified into 4 risk groups based on the risk cut-points at 10years proposed by experts from several autonomous regions and in the concentration of events. HDL, high-density lipoproteins.
The population who turned 50years of age with total cholesterol <180mg/dL, blood pressure <120/<80mmHg, without ever having smoked or having diabetes, had a very low probability of experiencing CV disease. However, fewer than 4% of the population aged 50years in the United States is in this situation.22 In our study, we found that the population with these characteristics aged between 35 and 50years was no greater than 6%. This finding indicates that there is still room for preventative actions, even relaxing the criteria somewhat (total cholesterol <240mg/dL and blood pressure <140/<90mmHg), which increased the percentage to approximately 37%.
Table of Modifiable RisksRisk functions are the preferred system for screening for CV risk, and include sex, age, total cholesterol and HDL-C, blood pressure, smoking habit, and diabetes mellitus. Only the Framingham-based REGICOR function for CV risk is validated for use in the Spanish population.13 The original Framingham function overestimated the real risk in the Spanish population by a factor of 2.5.11 A limitation of this type of function is that it does not give an indication of CV risk beyond 10years given possible changes in risk factors over time23; in addition, the upper age limit for their use is 74years.
The Framingham function and its derivatives are designed to predict coronary events. Even though we have a record of cerebrovascular events, it is impossible to make any inferences about the possible prediction of such events, as they are more incident in older patients than in our cohort. Some of the coefficients of some variables estimated with the Cox model with data from our cohort differed somewhat from the original ones (though none of the differences were significant). This could be attributed to different management of risk factors 60years ago, when the original coefficients for the current one were taken into consideration, and to the small number of coronary events in our cohort, especially among women. It is also likely that this low number of events is the reason why the prediction for deciles 4 and 9 in Figure 2, in which the calibration of the function is assessed, is less accurate than for the other deciles.
The Framingham-based REGICOR function for coronary risk is probably applicable in most autonomous regions of Spain, in view of the relatively low variability in the prevalence of CV risk factors between regions. However, it may be that the Canary Islands, Extremadura, and Andalusia, with markedly higher prevalence of several risk factors, require recalibrations and validations.24
Ideally, most coronary events at 10years should be concentrated in the high-risk popuation,25 defined by a level of 10-year risk generally agreed by expert consensus.26 However, more than 50% of the events are concentrated in approximately 30% of the population aged 35 to 74years with a risk between 5% and 15%. The reasons for this phenomenon are complex, and include a noteworthy individual variability in susceptibility to the atherogenic effects of each risk factor, which in turn is related to genetic and environmental factors, and the interaction of these two. This fact generates inevitable uncertainty about the true individual risk. It is possible that a better stratification of the risk levels responsible for most uncertainty (in the case of the REGICOR function, 5%-9.9% and 10%-14.9%) could be obtained by incorporating additional clinical information. Certain biomarkers such as triglycerides, C-reactive protein, genetic characteristics, and several factors that are currently not included in the risk factors for CV disease, such as family history of CV disease, obesity, dorsalis pedis pulse, ankle-brachial index, carotid intima-media thickness, or proteinuria could refine the prediction.17, 27, 28 Future studies should determine whether these biomarkers and additional factors can improve the prediction of CV risk, although in patients with greatest uncertainty (risk of 5%-15%), it could be justifiable from a clinical point of view to reclassify to a higher risk category, or even to a lower risk category if no subclinical atherosclerosis is detected. Simplification of the function into 4 levels of risk could also assist in decision making, perfecting the recommendations, and refining the risk stratification (Figure 2).
There is little room for improvement in the discrimination of the risk functions, as it is very difficult to significantly improve the area under curve,28 and so it might not be appropriate to evaluate the capacity for improving prediction. Therefore the net reclassification improvement has been proposed as an alternative to other instruments.29
While the necessary information for each new factor is generated, the presence of one or more of the nontraditional factors considered above could, from the clinical point of view, be useful as elements to support decision making about the aggressiveness of the intervention to be performed in subjects classified as moderate or intermediate risk (in the case of the adapted REGICOR function, those with a 10-year risk of between 5% and 9.9%). In the event that a pathological result is obtained, the individual would be considered as at high or very high risk.
Identification of the Vulnerable IndividualMost major coronary events are caused by rupture of an atheromatous plaque, regardless of its size and the degree of stenosis that it produces.30, 31 The role of noninvasive imaging tests and other biomarkers is still subject to debate, although it is likely that they will become important when a specific risk subgroup is identified in which the effort required becomes worthwhile.25
Study Characteristics and LimitationsOur study is characterized by being representative of the general population of a region in the northwest of Spain, and having a high long-term follow-up rate. Among the noteworthy limitations is the relatively low number of coronary events, in line with the incidence rate in Spain, and more specifically in the region of Girona.32 It is also possible that the present availability of treatments for hypertension and dyslipidemia is not properly reflected in Framingham-based functions. However, the prediction is not noticeably affected in this case, as adjustment for these treatments does not alter the results.
ConclusionsThe Framingham-based REGOCIR CV risk function provides a good prediction of the incidence of the coronary events for which it was designed.
The distribution of the population according to 10-year risk and the number of coronary events indicates that the risk stratification can be simplified into 4 groups: <5%, low; 5%-9.9%, moderate; 10%-14.9%, high; and ≥15%, very high.
FundingThis study was financed in part by the Instituto de Salud Carlos III- RETIC 06/0009-FEDER (HERACLES network), FIS-FEDER (PI081327) and the Miguel y Servet (CP06 00100) and Río-Hortega (CM08 00141) contract, Instituto de Salud Carlos III, Madrid, Spain.
Conflicts of interestNone declared.
Acknowledgments
The authors wish to thank Ruth Martí, Susana Tello, Marta Cabañero, Yolanda Ferrer, Sandra Farré, and Esmeralda Gómez for data management and administrative support during the study. The complete list of REGICOR investigators is available from www.regicor.org/regicor_inv. We would also like to acknowledge the collaboration of the Registre de Mortalitat de Catalunya del Servei d’Informació i Estudis, Departament de Salut, Generalitat de Catalunya (Anna Puigdefàbregas, Gloria Ribas, and Rosa Gispert).
Received 13 August 2010
Accepted 13 December 2010
Corresponding author: Grupo de Epidemiología y Genética Cardiovascular, Instituto Municipal de Investigación Médica, Dr. Aiguader 88, 08003 Barcelona, Spain. jmarrugat@imim.es