The purpose of the present study was to assess the relationship of central and peripheral blood pressure to left ventricular mass.
MethodsCross-sectional study that included 392 never treated hypertensive individuals. Measurement of office, 24-h ambulatory, and central blood pressure (obtained using applanation tonometry) and determination of left ventricular mass by echocardiography were performed in all patients.
ResultsIn a multiple regression analysis, with adjustment for age, gender and metabolic syndrome, 24-h blood pressure was more closely related to ventricular mass than the respective office and central blood pressures. Systolic blood pressures always exhibited a higher correlation than diastolic blood pressures in all 3 determinations. The correlation between left ventricular mass index and 24-h systolic blood pressure was higher than that of office (P<.002) or central systolic blood pressures (P<.002). Changes in 24-h systolic blood pressure caused the greatest variations in left ventricular mass index (P<.001).
ConclusionsIn our population of untreated middle-aged hypertensive patients, left ventricular mass index is more closely related to 24-h ambulatory blood pressure than to office or central blood pressure. Central blood pressure does not enable us to better identify patients with left ventricular hypertrophy.
Keywords
An increase in blood pressure (BP) is one of the major factors in the initial vascular injury and in the subsequent cardiovascular complications1, 2 that develop in association with arteriosclerosis. However, the question as to which of the parameters of BP measured in the clinical setting are most closely related to vascular injury and its clinical complications is a debate that has persisted over the years and has implicated successively systolic blood pressure (SBP), diastolic blood pressure (DBP), pulse pressure, and the respective determinations obtained over 24h (24hBP).
The measurement of the BP in aorta, or central blood pressure (CBP), is the main factor in hemodynamic loading, which affects myocardial muscle, and it is reasonable to consider that it is related to the major clinical cardiovascular complications that occur in the great arteries, data confirmed by a number of studies.3, 4 The development of noninvasive techniques that enable the indirect reading of CBP has given rise to a strong interest both in its determination and in the utility its measurement may have in the study of hypertension.
The initial evaluation of hypertensive patients should include the systematic search for subclinical lesions associated with vascular injury in target organs, as it enables a better stratification of the cardiovascular risk of each patient.1, 2 Left ventricular hypertrophy (LVH) measured by echocardiography is a parameter of vascular injury that also indicates an added risk.5, 6, 7
The objective of the present study is to analyze the relationship of different methods for the measurement and assessment of BP (office, 24hBP, and CBP) to the existence of LVH and to attempt to identify the utility of each of them in predicting the risk of developing LVH.
Methods StudyWe performed a cross-sectional, observational study in patients referred from a primary care center to the hypertension and vascular risk unit of a hospital internal medicine service with a recent diagnosis of arterial hypertension.
PatientsWe included all the hypertensive patients examined consecutively between 1 October 2006 and 31 May 2011 who met the following requirements: a) age over 18 years; b) no previous treatment with antihypertensive agents, and c) office BP of 140mmHg or higher or office DBP of 90mmHg or higher in 3 consecutive measurements over a 1-month follow-up period or 24-h SBP values of 130mmHg or higher or 24-h DBP of 80mmHg or higher in ambulatory BP monitoring over the same period.
The study exclusion criteria were: a) any form of secondary hypertension; b) neoplastic disease or hepatic or renal failure (glomerular filtration rate less than 60mL/min/1.73 m2 or clinical proteinuria); c) heart failure (New York Heart Association [NYHA] functional classes III and IV); d) history of ischemic heart disease, cerebrovascular disease, or peripheral arterial disease; e) diagnosed diabetes mellitus, and f) history of chronic arrhythmias such as chronic atrial fibrillation. Patients with incomplete data or insufficient quality in the echocardiographic study, ambulatory BP monitoring, or determination of the CBP by tonometry were also excluded.
Clinical Examination and MethodsIn the initial visit, in addition to the standard clinical examination, the weight (kg), height (cm), and waist circumference (cm) were determined, and the body mass index calculated, for all the patients.
The office BP was measured using a mercury sphygmomanometer with the patient seated after 5min of rest, in accordance with the British Hypertension Society.8 The SBP and DBP were identified by Korotkoff phase I and V sounds. The BP was determined in both arms and all the subsequent measurements were made in the arm in which the highest values had been obtained.
Ambulatori Blood Pressure MonitoringTo determine the 24hBP, an oscillometric monitor was employed (Spacelabs 902207; Redmond, Washington, United States) over the course of a workday. Prior to initiating monitoring, we confirmed that the BP measurements of the monitor differed from those obtained with the mercury sphygmomanometer by less than 3mmHg. Readings were made every 20min from 6:00 to 0:00 and every 30min from 0:00 to 6:00. The hourly and 24-h mean values were calculated for all the readings. SBP measurements of 260mmHg and higher or 70mmHg and lower and DBP measurement of 150mmHg and higher or 40mmHg and lower were automatically disregarded.
Measurement of the Central Arterial Blood PressureThis was obtained in the office after a 15-min rest period during which the patient remained in the supine position. The test was performed in the same arm that had been employed for the determinations of the office BP and following the consensus recommendations of the European Society of Hypertension.9 The pulse wave velocities were measured in radial artery using the applanation tonometry technique, with a Millar STP 301 and 304 pressure transducer connected to a SphygmoCor Vx system (AtCor Medical; Sydney, Australia). To calibrate the system prior to the performance of tonometry, the office BP measurements obtained with the mercury sphygmomanometer were used. The computer system employed obtained the CBP values utilizing a previously validated algorithm.10 Heart rate was corrected to 75 bpm. Data with a measurement quality index lower than 85% were disregarded. The pulse wave velocity (m/s) was determined, according to a previously described technique,11 with the same device used to determine CBP. The physicians who performed the measurements had previously been accredited for the use of this technique in accordance with the Quality Control Procedures for Vascular Ultrasound Measurements of the InGenious HyperCare Network of Mechanomics of Hypertension-Related Diseases (http://www.hypercare.eu).
EchocardiogramTwo-dimensional M mode echocardiography was carried out with the patient in the lateral decubitus position. The measurements were obtained in accordance with the recommendations of the American Society of Echocardiography. Left ventricular mass was calculated according to the method of Devereaux et al.12 Left ventricular mass index (LVMI) was obtained by dividing left ventricular mass (g) by the body surface (m2). The reading of the ventricular mass was blinded as the examiner who performed the measurements did not have access to the clinical data of the patients. The cutoff values to define the presence of LVH were 125g/m2 for men and 110g/m2 for women, in accordance with the European Society of Hypertension.1
Other DeterminationsAll the patients underwent an analysis to assess the major laboratory parameters. The estimated glomerular filtration rate was calculated using the abbreviated Modification of Diet in Renal Disease formula.13 The urinary albumin and creatinine concentrations were determined in 2 early morning urine samples. Urinary albumin excretion was expressed as the albumin-to-creatinine ratio. The cutoff values to determine the presence of microalbuminuria were 22mg/g in men and 31mg/g in women.
The metabolic syndrome was diagnosed in those patients who met the criteria of the National Cholesterol Education Program - Adult Treatment Panel III.14 The diagnosis of diabetes mellitus was based on the criteria of the American Diabetes Association.15
The epidemiological, clinical, and analytical data were computerized and the legal requirements concerning confidentiality were respected. The study was carried out in accordance with the guidelines for good clinical practice and was approved and monitored by the hospital research committee. All the participants gave their consent at the beginning of the study.
Statistical AnalysisThe continuous variables are expressed as the mean (standard deviation) when they have a normal distribution and, otherwise, as the median [interquartile range]. The categorical variables are expressed as percentages. The normal distribution of the variables was assessed using the Kolmogorov-Smirnov test. For the intergroup comparison, Student's t test was employed for the variables having a normal distribution and the Mann-Whitney U test for all others. The comparison of proportions was carried out with the chi-square test. To analyze the degree of linear correlation between continuous variables, the Pearson correlation coefficient was utilized. Logarithmic transformation was applied to the LVMI values. To compare the various correlation coefficients of the different blood pressure values and the LVMI, the Z statistic was employed.16 In the multiple comparisons, the Bonferroni correction was applied at the significance level. Multiple linear regression models were used to predict the variation in the LVMI according to the different BP values. Logistic regression models were employed to estimate the risk of developing LVH. All the statistical analyses were performed using the SPSS software package for Windows. A P value less than .05 was considered to indicate statistical significance.
Results Patient CharacteristicsOf a total of 1622 individuals who came to the hypertension and vascular risk unit during the study period, 472 who met the inclusion criteria were initially evaluated. Of these, 24 were excluded because of suspected secondary hypertension or changes in renal function, 15 due to diabetes mellitus, and 1 because of a history of ischemic heart disease. Forty subjects were excluded because the measurements obtained from echocardiography, ambulatory monitoring, or arterial tonometry for the calculation of CBP were suboptimal or incomplete, or had not been performed. (The general characteristics of this group were similar to those of the final study group; data not shown).
Finally, the study group consisted of a total of 392 individuals (178 women), with a mean age of 49 (12) years, the major characteristics of which are shown in Table 1. The office SBP was 147 (17) mmHg and the office DBP, 88 (11) mmHg; in the ambulatory monitoring, the 24-h SBP was 135 (12) mmHg, and the 24-h DBP, 85 (9) mmHg; the central SBP value was 137 (18) mmHg, and the central DBP, 88 (10) mmHg. In all, 120 participants (31%) met the echocardiographic criteria for LVH; they included 49 women (27% of all the women) and 71 men (33% of the men).
Table 1. General Characteristics of the Sample (n=392)
| Age, years | 49±12 |
| Women | 178 (45) |
| BMI | 29±5 |
| Waist circumference, cm | 97±46 |
| Smokers | 109 (28) |
| Metabolic syndrome | 132 (34) |
| SBP, mmHg | 147±17 |
| DBP, mmHg | 88±11 |
| PP, mmHg | 59±15 |
| 24-h SBP, mmHg | 135±12 |
| 24-h DBP, mmHg | 85±9 |
| 24-h PP, mmHg | 50±10 |
| CSBP, mmHg | 137±18 |
| CDBP, mmHg | 88±10 |
| CPP, mmHg | 48±15 |
| Blood glucose, mg/dL | 96 [90-104] |
| Urate, mg/dL | 5.2 [4-6] |
| GFR, mL/min/1.73 m 2 | 93.5 [82-108] |
| Total cholesterol, mg/dL | 203±38 |
| HDL-C, mg/dL | 53 [43-64] |
| LDL-C, mg/dL | 123±35 |
| Triglycerides, mg/dL | 109 [78-151] |
| Microalbuminuria | 46 (12) |
| Arterial stiffness (PWV>12 m/s) | 33 (8.4) |
| LVH | 120 (31) |
| Women with LVMI≥110 g/m2 | 49 (27) |
| Men with LVMI≥125 g/m2 | 71 (33) |
BMI, body mass index; CDBP, central diastolic blood pressure; CPP, central pulse pressure; CSBP, central systolic blood pressure; DBP, diastolic blood pressure; GFR, glomerular filtration rate; HDL-C, high-density lipoprotein cholesterol; LDL-C, low-density lipoprotein cholesterol; LVH, left ventricular hypertrophy; LVMI, left ventricular mass index; PP, pulse pressure (SBP−DBP); PWV, pulse wave velocity; SBP, systolic blood pressure.
The data are expressed as no. (%), mean±standard deviation, or median [interquartile range].
For their comparison, the subjects were divided into groups depending on whether or not they had echocardiographic LVH (Table 2). The patients with LVH were older (P=.005) and were more likely to have metabolic syndrome (P=.015), as well as higher blood glucose levels (P=.004). The BP values were higher in the patients with LVH, with a difference of 5mmHg in office SBP (95% confidence interval [95%CI], 1mmHg to 9mmHg; P=.007), of 2mmHg in DBP (95%CI, 0.03mmHg to 5mmHg; P=.047), of 7mmHg in 24-h SBP (95%CI, 5mmHg to 10mmHg; P<.001), of 4mmHg in 24-h DBP (95%CI, 2mmHg to 6mmHg; P<.001), and of 7mmHg in central SBP (95%CI, 4mmHg to 12mmHg, P<.001), whereas the difference in central DBP was not statistically significant. Differences were observed in the prevalence of arterial stiffness that were close to statistical significance; likewise, when the mean pulse wave velocities were compared, they were 0.64 m/s higher (95%CI, 0.2 m/s to 1.1 m/s; P=.004) in the group with LVH (9.1 m/s vs 8.5 m/s).
Table 2. Characteristics of the Patients According to the Presence or Absence of Left Ventricular Hypertrophy
| Characteristics | LVH (n=120) | No LVH (n=272) | Difference in the means (95%CI) | P |
| Age, years | 52±12 | 48±13 | 4 (1-7) | .005 a |
| Women | 49 (41) | 129 (48) | .2 b | |
| BMI | 30±5 | 29±5 | 1 (0.1-2) | .049 a |
| Waist circumference, cm | 97±14 | 97±55 | 0.1 (−10 to 10) | .09 a |
| Smokers | 35 (29) | 74 (27) | .7 b | |
| Metabolic syndrome | 51 (42) | 81 (30) | .015 b | |
| SBP, mmHg | 151±18 | 145±16 | 5 (1-9) | .007 a |
| DBP, mmHg | 90±12 | 87±10 | 2 (0.1-5) | .047 a |
| PP, mmHg | 61±16 | 58±15 | 3 (−0.4 to 6) | .08 a |
| 24-h SBP, mmHg | 140±14 | 132±10 | 7 (5-10) | .001 a |
| 24-h DBP, mmHg | 88±11 | 84±8 | 4 (2-6) | .001 a |
| 24-h PP, mmHg | 52±11 | 49±9 | 4 (1-6) | .002 a |
| CSBP, mmHg | 142±19 | 134±17 | 7 (4-12) | .001 a |
| CDBP, mmHg | 90±12 | 88±9 | 2 (−0.2 to 5) | .07 a |
| CPP, mmHg | 52±14 | 47±14 | 5 (2-8) | .001 a |
| Blood glucose, mg/dL | 99 [92-106] | 95 [89-102] | .004 c | |
| Urate, mg/dL | 5.3 [4.2-6.2] | 5.1 [4.2-6.3] | .6 c | |
| GFR, mL/min/1.73 m2 | 94 [82-110] | 94 [83-108] | .7 c | |
| Total cholesterol, mg/dL | 201±37 | 204±39 | −3 (−11 to 5) | .5 a |
| HDL-C, mg/dL | 50 [43-64] | 54 [43-64] | .5 c | |
| LDL-C, mg/dL | 123±33 | 123±35 | 0.55 (−7 to 8) | .88 a |
| Triglycerides, mg/dL | 106 [73-158] | 110 [80-149] | .5 c | |
| Microalbuminuria | 18 (16) | 28 (10) | .16 b | |
| Arterial stiffness (PWV>12 m/s) | 15 (12) | 18 (7) | .058 b | |
| LVMI, g/m2 | 137±20 | 98±16 | 40 (36-44) | .001 a |
95%CI, 95% confidence interval; BMI, body mass index; CDBP, central diastolic blood pressure; CPP, central pulse pressure; CSBP, central systolic blood pressure; DBP, diastolic blood pressure; GFR, glomerular filtration rate; HDL-C, high-density lipoprotein cholesterol; LDL-C, low-density lipoprotein cholesterol; LVH, left ventricular hypertrophy; LVMI, left ventricular mass index; PP, pulse pressure (SBP−DBP); PWV, pulse wave velocity; SBP, systolic blood pressure.
The data are expressed as n (%), mean±standard deviation, or median [interquartile range].
a Student's t test.
b Chi-square test.
c Mann-Whitney U test.
Univariate analysis (Table 3) of the correlation between the selected variables and the LVMI logarithm, performed in all the patients, showed a direct, statistically significant association with age, body mass index, blood glucose, urate (inversely associated with high-density lipoprotein cholesterol levels), and pulse wave velocity, as well as with office SBP and pulse pressure, with 24-h SBP, 24-h DBP, and 24-h pulse pressure, and with central SBP and pulse pressure. The comparison of the correlation values of the different pressures, taken two by two, with the LVMI revealed that those corresponding to the 24-h SBP were higher than the rest (Table 4).
Table 3. Univariate Correlation Between the Logarithm of the Left Ventricular Mass Index and Certain Clinical Variables
| Variable | r * | P |
| Age | 0.18 | .001 |
| BMI | 0.14 | .005 |
| Blood glucose | 0.23 | .001 |
| Urate | 0.36 | .001 |
| HDL-C | −0.25 | .001 |
| PWV | 0.13 | .008 |
| SBP | 0.21 | .001 |
| DBP | 0.09 | .070 |
| PP | 0.17 | .001 |
| 24-h SBP | 0.36 | .001 |
| 24-h DBP | 0.27 | .001 |
| 24-h PP | 0.20 | .001 |
| CSBP | 0.19 | .001 |
| CDBP | 0.07 | .100 |
| CPP | 0.18 | .001 |
BMI, body mass index; CDBP, central diastolic blood pressure; CPP, central pulse pressure; CSBP, central systolic blood pressure; DBP, diastolic blood pressure; HDL-C, high-density lipoprotein cholesterol; PP, pulse pressure (SBP−DBP); PWV, pulse wave velocity; SBP, systolic blood pressure.
* Pearson correlation coefficient.
Table 4. Comparison of Correlation Coefficients of Blood Pressure Values With the Logarithm of the Left Ventricular Mass Index a
| Comparison of r b | P using Z test |
| 24-h SBP vs SBP | .002 |
| 24-h SBP vs CSBP | .002 |
| SBP vs CSBP | ns |
| 24-h PP vs PP | ns |
| 24-h PP vs CPP | ns |
| PP vs CPP | ns |
| SBP vs PP | ns |
| 24-h SBP vs 24-h PP | ns |
| CSBP vs CPP | ns |
CPP, central pulse pressure; CSBP, central systolic blood pressure; ns, not statistically significant; PP, pulse pressure; SBP, systolic blood pressure.
a Comparison of correlations using Steiger's Z statistic.
b Pearson correlation coefficient.
In all the multiple linear regression models applied (Table 5) to predict the LVMI on the basis of the different BP values, a statistically significant relationship was observed after adjusting for age, sex, metabolic syndrome, and arterial stiffness. The presence of arterial stiffness was not found to have a statistically significant relationship for the prediction of the LVMI in the linear regression models.
Table 5. Linear Regression Models (Dependent Variable: Logarithm of the Left Ventricular Mass Index) With the Different Blood Pressure Measures (Age, Sex, Metabolic Syndrome, and Arterial Stiffness are Included in Every Case)
| Models | R2 | B | 95%CI | P |
| SBP | 0.25 | 0.001 | 0-0.001 | .001 |
| DBP | 0.25 | 0.001 | 0-0.002 | .020 |
| PP | 0.23 | 0.001 | 0-0.001 | .054 |
| 24-h SBP | 0.29 | 0.002 | 0.001-0.003 | .001 |
| 24-h DBP | 0.28 | 0.002 | 0.001-0.003 | .001 |
| 24-h PP | 0.24 | 0.001 | 0-0.002 | .014 |
| CSBP | 0.26 | 0.001 | 0-0.001 | .001 |
| CDBP | 0.24 | 0.001 | 0-0.002 | .040 |
| CPP | 0.24 | 0.001 | 0-0.002 | .004 |
95%CI, 95% confidence interval; B, unstandardized b coefficient; CDBP, central diastolic blood pressure; CPP, central pulse pressure; CSBP, central systolic blood pressure; DBP, diastolic blood pressure; PP, pulse pressure (SBP−DBP); R2, coefficient of determination; SBP, systolic blood pressure.
All of the 24hBP values (SBP, DBP, and pulse) showed better correlations than the respective office BPs and CBP. Variation in 24-h SBP values was the factor that produced the greatest increase in the LVMI; for the mean 24-h SBP values, an increase of 10mmHg corresponded to an increase of 5.3g/m2 (95%CI, 3.5g/m2- to 7.1g/m2) in the LVMI (P<.001) (Table 6).
Table 6. Variation in Left Ventricular Mass Index in Accordance With Systolic Blood Pressure After Adjustment for Age, Sex, Metabolic Syndrome, and Arterial Stiffness
| Multiplying factor applied to LVMI for every 10-mmHg increase in SBP (95%CI) | P | R2 for the model | |
| SBP | 1.02 (1.00-1.02) | .001 | 0.24 |
| 24-h SBP | 1.05 (1.02-1.07) | .001 | 0.28 |
| CSBP | 1.02 (1.00-1.02) | .001 | 0.24 |
95%CI, 95% confidence interval; CSBP, central systolic blood pressure; LVMI, left ventricular mass index; R2, coefficient of determination; SBP, systolic blood pressure.
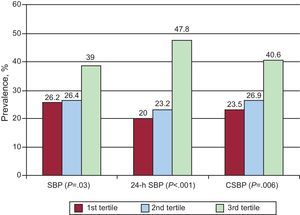
The prevalence of LVH in association with each of the SBP measures (office, 24hBP, and CBP) divided into tertiles was also analyzed. We observed a marked increase in the prevalence of LVH in the highest tertile not only of office SBP (P=.03), but in those of 24-h SBP (P=.001) and of central SBP (P=.006) as well (Figure). Logistic regression analysis was performed to estimate the risk of LVH according to the tertiles of SBP compared above. Thus, we observed that the patients in the highest tertile of 24-h SBP and central SBP were more likely to develop LVH than the patients in the lowest tertile and, particularly so, that of 24-h SBP, expressed as multivariate odds ratio (mOR)=3.2 (95%CI, 1.8-5.7; P<.001), vs mOR=1.8 (95%CI, 1.1-3-2; P=.04) in the case of central SBP, with the values for office SBP not reaching statistical significance (Table 7).

Figure. Prevalence of left ventricular hypertrophy in the groups according to tertiles of the values for systolic blood pressure (office, 24-h ambulatory, and central). Analysis of the differences between groups using the chi-square test. CSBP, central systolic blood pressure; SBP, systolic blood pressure.
Table 7. Multiple Logistic Regression Analysis. Dependent Variable: Left Ventricular Hypertrophy (Age, Sex, Metabolic Syndrome, and Arterial Stiffness Are Included in Every Case)
| Groups by tertiles | LVH, % | mOR | 95%CI | P |
| SBP | ||||
| First tertile | 26.2 | 1 | ||
| Second tertile | 26.4 | 0.9 | 0.5-1.6 | .8 |
| Third tertile | 39 | 1.4 | 0.8-2.4 | .2 |
| 24-h SBP | ||||
| First tertile | 20 | 1 | ||
| Second tertile | 23.2 | 1.08 | 0.6-1.9 | .9 |
| Third tertile | 47.8 | 3.2 | 1.8-5.7 | .001 |
| CSBP | ||||
| First tertile | 23.5 | 1 | ||
| Second tertile | 26.9 | 1.1 | 0.6-1.9 | .9 |
| Third tertile | 40.6 | 1.8 | 1.1-3.2 | .04 |
95%CI, 95% confidence interval; CSBP, central systolic blood pressure; LVH, left ventricular hypertrophy; mOR, multivariate odds ratio; SBP, systolic blood pressure.
Logistic regression was also used to analyze the risk of developing LVH with certain specific BP values. After correcting for age, sex, and metabolic syndrome, we obtained the following results: 24-h SBP≥140mmHg, mOR=2.7 (95%CI, 1.6-4.2; P<.001); office SBP≥150mmHg, mOR=1.3 (95%CI, 0.8-2.1; P=.2; and office SBP≥140mmHg, mOR=1.5 (95%CI, 0.97-2.4; P=.07).
DiscussionThe results of the present study indicate that, in hypertensive patients with no previous antihypertensive drug therapy, CBP values do not show a higher correlation with left ventricular mass measured by echocardiography than office BP. However, the 24hBP obtained in monitoring did have a closer correlation with the LVMI, and better identified patients with LVH than did office BP and CBP. In the 3 methods employed to assess the blood pressure (office, central, and 24-h), the SBP was more closely related to the LVMI than DBP and pulse pressure.
Office BP does not always reflect the true CBP value, which, from the pathophysiological point of view, is probably more closely related to the vascular injury caused by hypertension (many of its complications occur in arteries of the central circulatory system, such as the coronary or carotid arteries). The DBP and mean pressure remain nearly constant from the aortic arch to the peripheral arteries (tonic component), but the SBP and pulse pressure (dynamic component) increase and are amplified over the distance they must cover to reach the peripheral arteries. This amplification is influenced by a number of factors (age, sex, height, antihypertensive therapy, etc.) that modify the vascular risk. The development of simple techniques for its measurement in the clinical setting explains the growing interest in the study of CBP in hypertension.
A number of previous studies have related CBP values with LVH and organ damage.17, 18, 19 The Strong Heart Study17 involved 2585 participants from a heterogeneous population (32% hypertensive subjects, 60% of them with drug therapy). Central SBP (r=0.396) was somewhat more closely related to LVMI than office SBP (r=0.374) and, in both cases, the correlation of the SPB values was higher than that of the peripheral and central pulse pressures. In a study in Taiwan with 1272 subjects (34% untreated hypertensive individuals), central SBP was also more closely related to LVMI (r=0.410) than office SBP (r=0.370) and, again, systolic pressures were better predictors than other determinations of peripheral BP and CBP.18 Neisius et al., in a cohort of 535 middle-aged subjects (62% hypertensive individuals), a high percentage (84%) of whom were receiving antihypertensive therapy, observed that central pulse pressure was more closely related to the cardiovascular phenotypes associated with the organ damage analyzed, including the LVMI, than the peripheral pulse pressure. However, when adjusted for relevant cofactors, the central and peripheral pulse pressures had similar predictive values.20 None of these studies included the simultaneous measurement of 24hBP. Our series of hypertensive subjects with no previous treatment and with a more recent clinical onset is more homogeneous, a circumstance that probably explains these differences.
The prognostic value of CBP, compared to office BP, for the development of cardiovascular complications is a question subject to considerable controversy. In the longitudinal follow-up studies of the Strong Heart Study,17 as in the Taiwan study,18 the CBP values were better indicators of cardiovascular mortality than the office BP measurements. Nevertheless, we should point out that, in other studies, in particular the Framingham Heart Study21 and the Second Australian National Blood Pressure Study,22 the opposite occurred, and the CBP values were not independent predictors of cardiovascular complications when compared with office BP. An important study that pointed out the potential use of CBP measurement was the CAFE study, involving 2073 patients randomly treated with amlodipine or atenolol (plus other antihypertensive drugs if necessary). After 4 years of follow-up, the patients had a similar office BP, but those treated with amlodipine had lower CBP values than those treated with atenolol, and this circumstance was related to fewer cardiovascular complications at the end of the study, a finding that has suggested the utility of CBP as a therapeutic objective in antihypertensive therapy.23
Another measure of peripheral BP, ambulatory 24hBP monitoring, has been shown in previous studies to be better correlated with organ damage than office BP.24 Moreover, 24hBP is an independent predictor of cardiovascular risk, and has been found to be superior to office BP as a predictor of cardiovascular mortality in follow-up studies.25, 26 As a result, its use is common in clinical practice.
We have failed to find in the current literature a sufficiently extensive study with a large enough sample population that compares the different BP measurements (office, 24hBP, and CBP) in terms of their relationship to left ventricular mass and the presence of LVH.
In the present study, the 24hBP values showed the strongest association with the LVMI, clearly closer than office BP and CBP. Given that, to date, in our setting, ambulatory monitoring is much more widely employed than CBP measurement, these findings are important and relevant to the routine clinical management of our patients.
In our study, the prevalence of LVH was 31% (27% in women and 33% in men), values that are encompassed within the usual range reported in different series studied.
Thus, when analyzing the risk of LVH, in our study, we observed that the patients with the highest SBP (in the highest tertile in any of the measures) had a greater risk of LVH.
The patients with 24hBP values of 150mmHg or more had a 3-fold higher risk of LVH. However, equivalent office SBP and central SBP values did not significantly predict the risk of LVH, a finding that is of practical interest in the clinical evaluation.
LimitationsWe must point out the limitations of this study. It is a cross-sectional study, and the subject sample was very carefully selected, with young mean age and a recent diagnosis of hypertension, and without diabetes or previous drug therapy. Thus, the results can not be extrapolated to the hypertensive population as a whole, especially to patients with a long history of severe hypertension and greater arterial stiffness, in whom the situation may be different.
ConclusionsIn short, in our series of patients with recently diagnosed hypertension, clinical assessment was able to correlate LVMI values with BP measurements. From the findings reported here, we can conclude that, in the stratification of hypertensive patients in terms of cardiovascular risk, ambulatory BP monitoring is the most effective method for predicting the presence of LVH, and that the determination of CBP in these patients does not contribute to improving their stratification in terms of the office BP.
Conflicts of interestNone declared.
Received 20 March 2012
Accepted 11 May 2012
Corresponding author: Unidad de Hipertensión y Riesgo Vascular, Servicio de Medicina Interna, Hospital de Sagunto, Ramón y Cajal s/n, 46520 Sagunto, Valencia, Spain. pascual_jma@gva.es