In the absence of right ventricular hypertrophy or bundle-branch block, a prominent R wave in V1 or V2 is considered to reflect a lateral myocardial infarction. We investigated the differences in infarct location, size and transmural extent between patients with prominent R wave in V1 and those with prominent R wave in V2.
MethodsWe studied 50 patients with a previous first infarction involving left ventricular inferior and/or lateral wall at contrast-enhanced magnetic resonance.
ResultsA prominent R wave in V1 was present in 8 patients (16%), in V2 in 23 (46%). At magnetic resonance, the infarction involved the inferior wall in 11 patients (22%), the lateral wall in 6 (12%), and both walls in 33 patients (66%). The sensitivity of a prominent R wave in V1 in detecting a lateral infarction was low (17.9%), while the specificity was high (90.9%). The sensitivity and specificity of a prominent R wave in V2 were 46.2% and 54.5%, respectively. In patients with a prominent R wave in V1, infarct size and lateral and transmural extent were greater than in patients without this pattern (P<.005, <.001, and <.05, respectively); conversely, infarct size and transmural extent in the inferior wall and in its basal-posterior segment were not significantly different. In patients with a prominent R wave in V2, infarct size, lateral and transmural extent were not different from patients without this pattern.
ConclusionsOnly a prominent R wave in V1 is a specific sign of large and transmural lateral infarction.
Keywords
For more than 45 years a tall and broad R wave in right precordial leads, in the absence of right ventricular hypertrophy or bundle branch block, has been considered the landmark of posterior myocardial infarction (MI).1 This criterion is still adopted in current guidelines,2 and is based on the assumption that the infarction vector of the posterior wall (the basal portion of left ventricular [LV] inferior wall) faces leads V1 and V2 and produces a prominent R wave. According to this theory, a tall and broad R wave in right precordial leads is equivalent to a posterior Q-wave.
More recently, a prominent R wave in right precordial leads has been correlated with infarct location in contrast-enhanced cardiac magnetic resonance imaging (MRI).3, 4, 5, 6 These studies have shown that the infarction vector of the basal segment of the inferior wall faces leads V3 and V4 and does not generate a prominent R wave in V1. On the contrary, the infarction vector in the case of the lateral wall infarction faces V1 and often generates a prominent R wave in this lead. To investigate the relationship between the different electrocardiographic patterns of necrosis and MI location, size, and transmural extent, we found that a tall and broad R wave in V1 or V2 is a more powerful predictor of lateral MI size than lateral Q waves.7 However, it is still unclear whether a prominent R wave in V is equivalent to a prominent R wave in V2 in detecting a lateral MI.
With these considerations in mind, we undertook this study to investigate the differences in MI location, size, and transmural extent between patients with prominent R wave in V1, and those with prominent R wave in V2.
Methods PatientsWe studied a group of patients with a previous first Q-wave MI documented by clinical records, using contrast-enhanced MRI and electrocardiogram (ECG). We excluded patients with MI within the last 30 days, patients with multiple MIs or patients with contraindications to the MRI. We also excluded patients with inadequate image quality of the MRI scan or with any condition that could have altered QRS shape and pattern, such as Wolff-Parkinson-White syndrome, left anterior or posterior hemiblock or bundle-branch block, severe LV hypertrophy, severe chronic obstructive pulmonary disease, or hypertrophic or dilated cardiomyopathy. Finally, we excluded patients with evidence of MI involving the anterior, anteroseptal, or apical segments.
Of the 10 828 patients admitted in our Cardiovascular Division between July 2001 and June 2009, we prospectively studied 193 patients with previous Q-wave MI by contrast-enhanced MRI.
From this population, we retrospectively collected a group of patients with previous first Q-wave MI involving the inferior and/or the lateral wall of the left ventricle. Specifically, of the entire group of 193 patients, 29 were excluded because of multiple MIs, 27 because of associated conditions that could have altered QRS shape, and 1 patient because of inadequate image quality. Of the remaining 136 patients, 86 were excluded because the MI involved the anterior, anteroseptal, or apical segments at MRI, or because an inferior and/or lateral MI at MRI was even minimally extended to the anterior, anteroseptal, or apical segments. Thus, the study population included 50 patients with areas of delayed contrast enhancement involving one or more of the following segments: basal inferoseptal, basal inferior, basal inferolateral, basal anterolateral, mid inferoseptal, mid inferior, mid inferolateral, mid anterolateral, apical inferior, or apical lateral.8 The study conforms to the ethical guidelines of the declaration of Helsinki; the institute's committee on human research approved its protocol. All patients signed their informed consent before enrollment in the study. The patient characteristics are shown in Table.
Characteristics of Patients
| Number | 50 |
| Age, years | 65 (11) |
| Male, % | 90 |
| Family history of CAD, % | 37 |
| Diabetes mellitus, % | 39 |
| Hypercholesterolemia, % | 53 |
| Hypertriglyceridemia, % | 12 |
| Arterial hypertension, % | 56 |
| Smoking habit, % | 53 |
| Obesity, % | 30 |
| No. of stenosed vessels | 2 (0.9) |
| LVEDV, mL/m2 | 96 (30) |
| LVESV, mL/m2 | 54 (27) |
| LVEF, % | 47 (13) |
| LV mass, g/m2 | 81 (22.5) |
| DCE Extent, % of entire LV | 8 (4.4) |
| Segments DCE transmural extent 1%-25% | 1.5 (1.5) |
| Segments DCE transmural extent 26%-50% | 1.6 (1.6) |
| Segments DCE transmural extent 51%-75% | 1 (1.2) |
| Segments DCE transmural extent 76%-100% | 0.6 (1.1) |
CAD, coronary artery disease; DCE, delayed contrast enhancement; LV, left ventricular; LVEDV, left ventricular end-diastolic volume; LVEF, left ventricular ejection fraction; LVESV, left ventricular end-systolic volume.
The protocol consisted of cine MRI to evaluate global LV function and contrast-enhanced MRI to determine location, size, and transmural extent of MI. The MRI was performed using a 1.5T whole-body scanner (GE Medical Systems, Milwaukee, WI). A four-element cardiac phased-array receiver surface coil was used for signal reception. We used a breath-hold, segmented-gradient, fast-imaging echo employing a steady-state acquisition ECG-triggered sequence to evaluate global LV function by standard parameters. In each patient a total of 9 to 12 short-axis views (depending on the LV volume) and 2 long-axis views (one vertical and one horizontal) were acquired, with a minimum of 30 cine frames for each slice. From 10 to 15min after bolus injection of gadolinium-diethylenetriamine pentaacetic acid (Gadovist, Schering, Berlin, Germany; 0.2 mmol/kg), images were acquired at end-diastole in the same views. A fast-gradient echo inversion recovery sequence was used. The inversion time was optimized until the disappearance of the signal from the viable myocardium.
Magnetic Resonance Imaging Data AnalysisThe LV endocardial borders were manually drawn on LV short-axis images corresponding to end-diastolic and end-systolic phases to calculate LV volumes and the ejection fraction. The LV myocardium was divided according to a 17-segment model.8 To assess location, size, and transmural extent of the MI, in each image the boundaries of contrast-enhanced areas were automatically traced (using a signal intensity cut-off of >5 SD over the average of normal remote myocardium), and manually corrected when needed. The reproducibility of this method has been previously validated.9
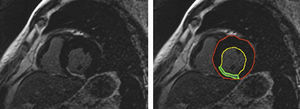
To measure the extent of the MI, in each image the myocardium was automatically divided into equiangular sectors starting from the anterior septal insertion. Each sector was subdivided into 100 radiants, and the extent of contrast enhancement in each radiant was measured automatically (Figure 1). Three to four contiguous slices were averaged to obtain the extent of the MI in each segment. The transmural extent of the MI in each segment was scored according to a 4-point scale, where 1 corresponds to≤25% of LV myocardial thickness, 2 is between 26% and 50%, 3 between 51% and 75%, and 4 corresponds to an extent>75% of LV thickness. The infarct size was calculated as the sum of the scores of all 10 segments of the inferior and lateral walls. Infarct extent in the inferior or lateral wall was calculated as the sum of the scores in the 5 inferior or 5 lateral segments. Infarct transmural extent was calculated as the mean score in the segments with contrast enhanced myocardium.

Figure 1. Contrast-enhanced, short-axis image of the heart. The lines in the right panel correspond to left ventricular endocardial (yellow) and epicardial boundaries (red), and to the edges of contrast- enhanced area (green).
ElectrocardiogramA 12-lead ECG was recorded at a speed of 25mm/s and a voltage of 10mm/mV. Two cardiologists, unaware of the MRI data, analyzed the ECG tracings off-line. In the case of disagreement regarding the ECG interpretation, a consensus was reached by reading the tracing together. The criteria for identification of the ECG patterns of necrosis were defined before the analysis. Q waves were considered pathological if they were >0.04s in duration.10, 11 The R wave in V1 or V2 was considered prominent if the R/S ratio was>1 and the R wave duration was>0.04s.3, 10, 11 The patients were categorized on the basis of a prominent R wave in V1 or a prominent R wave in V2.
Statistical AnalysisQuantitative data are expressed as mean±1 SD, qualitative data as percentage. The ability of the different ECG patterns of necrosis to detect MI location was evaluated as sensitivity and specificity, according to their definition. The difference between MI size, horizontal extent, and transmural extent in patients with the different ECG patterns of necrosis was tested by the analysis of variance. All statistical tests were 2-tailed; a P-value<.05 was considered significant. Statistical analysis was performed with the JMP 9 software (SAS Institute Inc.).
ResultsThe 12-lead ECG showed a prominent R wave in V1 in 8 patients (16%); all these patients also had a prominent R wave in V2. The ECG showed a prominent R wave in V2 but not in V1 in 15 patients (30%). Thus, 23 patients (46%) showed a prominent R wave in V2. Inferior Q waves of necrosis were present in 27 patients (54%). These Q waves were associated with a prominent R wave in V1 in 5/8 patients, with a prominent R wave only in V2 in 10/15 patients, and were not associated with a prominent R wave in 12 patients. At cardiac MRI, the infarction scar was located only in the inferior wall in 11 patients (22%), only in the lateral wall in 6 patients (12%), and in both inferior and lateral walls in 33 patients (66%).
Prominent R Wave in V1 or V2 and Location of Myocardial InfarctionOf the 8 patients with a prominent R wave in V1, 7 showed areas of delayed contrast enhancement in the lateral wall; specifically, the infarction scar was located only in the lateral wall in 2 patients, and in both inferior and lateral walls in 5. In the remaining patient with a prominent R wave in V1, a small subendocardial area of delayed contrast enhancement was located in the mid-inferior segment. Of the 42 patients without prominent R wave in V1, 32 showed areas of necrosis in the lateral wall, and 10 did not. Thus, the sensitivity of a prominent R wave in V1 in detecting a lateral MI was low (17.9%), while the specificity was high (90.9%). The positive and negative predictive values were 87.5% and 23.8%, respectively.
Of the 23 patients with prominent R wave in V2, 18 showed lateral infarction scars, and 5 did not. Of the 27 patients without this pattern, 21 showed evidence of lateral necrosis at MRI, and 6 did not. Thus, the sensitivity and the specificity of a prominent R wave in V2 in detecting lateral infarctions were 46.2% and 54.5%, respectively.
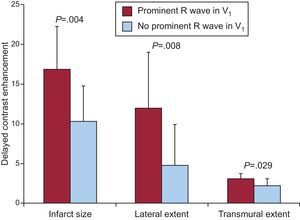
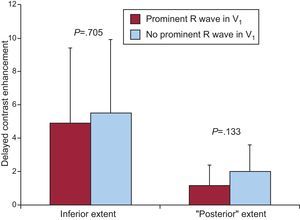
Prominent R Wave in V1, Infarct Size, and Transmural ExtentIn patients who presented a prominent R wave in V1, the overall size of the infarction at contrast-enhanced MRI, the extent of the MI in the lateral wall, and infarct transmural extent were higher than in patients without this electrocardiographic pattern (Figure 2). Conversely, infarct size in the inferior wall and in its basal segment (formerly called posterior) were not significantly different between patients with and without a prominent R wave in V1 (Figure 3).

Figure 2. Myocardial infarct size, lateral and transmural extent in patients with and without a prominent R wave in V1 (in red and blue).

Figure 3. Myocardial extent in LV inferior wall and in its inferobasal segment in patients with and without a prominent R wave in V1 (in red and blue, respectively).
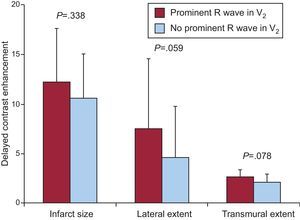
Prominent R Wave in V2, Infarct Size, and Transmural ExtentIn patients with prominent R wave in V2, the overall infarct size and its lateral and transmural extent were not significantly different from those of patients without such a pattern (Figure 4), nor were the size of the MI in the inferior wall (P=.348) or in its inferobasal segment (P=.187).

Figure 4. Myocardial infarct size, lateral and transmural extent in patients with and without a prominent R wave in V2 (alone or associated with a prominent R wave in V1) (in red and blue).
In the 20 patients with inferior Q waves, infarct size in the lateral wall was not significantly different (P=.419) from that of patients without Q waves, while MI extent in the inferior wall was significantly higher (P=.017).
DiscussionThis study shows that a prominent R wave in V1 and in V2 are markers of a lateral MI. However, a prominent R wave in V1 is a specific marker but not very sensitive, while a prominent R wave in V2 is a more sensitive but less specific marker. In practical terms, a prominent R wave in V1−in the absence of right ventricular hypertrophy or bundle branch block−is a diagnostic sign of a lateral infarction, while a prominent R wave in V2 may lead to misdiagnosis. Although these conclusions can be envisaged by previous studies, this is the first investigation that compares the different meanings of a prominent R wave in V1 and V2.
The relationship between an R wave in V1 and V2 and infarct location has been investigated in several studies. In a previous study we evaluated patients with Q-wave MI or equivalents.7 Thus, we selected patients based on electrocardiographic evidence of necrosis, while in this study we selected patients based on the MRI evidence of infarction. Furthermore, we previously included all possible infarct locations, while in the present study we selected only patients with inferior, lateral, or inferolateral MI. This study is also different from the previous ones performed by Bayes de Luna et al.,3, 4, 5, 6 where the MRI data were categorized in a binary way (as presence or absence of a previous MI) while we have included a quantitative data analysis on infarct size and transmural extent.
According to the results of various studies, including the present one, the commonly utilized nomenclature of MI location2 should be reconsidered. Specifically, a prominent R wave in right precordial leads should be considered a sign of lateral MI, not of posterior MI. This is not a matter of semantics, since the LV lateral wall is generally perfused by the left circumflex coronary artery, often by the obtuse marginal branch, while LV inferobasal wall is usually perfused by the right coronary artery. This consideration should be taken into account when patients undergo coronary arteriography and myocardial revascularization. Finally, although this was not the end-point of the study, our results confirm that the Q-waves of necrosis in the inferior leads not only have no relationship with lateral MI, but correspond to a scar located in the inferior LV wall.
This study revealed the innovative information that a prominent R wave in V1 carries quantitative information on MI size and transmural extent. In fact, a prominent R wave was associated with a larger infarct size, while in the absence of this sigh the infarction was smaller and more confined to the subendocardial layers. In a study of 100 patients with previous MI, Moon et al. found the Q waves to be indicative of a large infarct; in addition, a strong relationship was found between classification as a Q-wave MI and quintiles of transmural extent of MI measured by contrast-enhanced MRI.12 In another study, although several parameters were predictors of Q waves at univariate analysis, multivariate analysis showed that quantified scar tissue extent was the single best predictor of Q waves on the ECG.13 In line with the above evidence, the results of the present study allow us to conclude that a large lateral MI, which generates a big infarction vector, is needed to produce a prominent R wave in V1. Accordingly, the “false-negative” results of the patients with lateral infarction without prominent R waves could be explained by the fact that their infarction was smaller and limited to the subendocardial layers, in other words not large enough to generate a prominent infarction vector.
In previous studies3, 4, 5, 6 a prominent R wave in V1 had a specificity of 100% in detecting a lateral infarction. In our study one patient with prominent R wave in V1 did not show a lateral infarction, leading to a specificity of 90.9%. However, the duration of the R wave in V1 in our patient was<0.04s, while by definition a prominent R wave has to be wide, with a duration >0.04s.3, 10, 11 Furthermore, although an acute coronary syndrome was excluded, the T waves were negative (max. 0.25mV) from V1 to V3. If this patient was excluded from the study, our specificity would have been 100% as well.
This study is affected by several limitations. Because of the extreme variability in coronary anatomy among individual patients,14 the considerations made regarding the coronary arteries supplying the different LV walls are only true in median terms. In previous studies, various authors have investigated several parameters that describe a prominent R wave, as the R/S ratio or R wave duration; these parameters were not analyzed in the present study. Furthermore, the sample size in this study is limited, and should be expanded in larger cooperative studies. Although very specific, a prominent R wave in V1 was not a very sensitive sign of lateral infarction, thus limiting its utilization for diagnostic purposes. Finally, it should be kept in mind that the relationships between a prominent R wave in V1 or V2 and infarction scars found in patients with previous MI cannot be extrapolated to the acute phase of the disease or to ST segment shifts.
ConclusionsA pathologic R wave in V1 is a specific marker of lateral infarction, and unmasks a large infarction scar, transmurally well extended. A prominent R wave in V2 is a more sensitive but less specific marker of lateral MI, and can induce a reasonable suspicion.
FundingThis study was supported by institutional grants of the National Research Council (CNR), Italy.
Conflicts of interestNone declared.
Received 6 March 2012
Accepted 28 May 2012
Corresponding author: CNR, Istituto di Fisiologia Clinica, Via Moruzzi 1, 56124 Pisa, Italy. drovai@ifc.cnr.it