The prognostic value of high-sensitivity troponin T after percutaneous coronary intervention in patients with stable coronary artery disease is unclear. We investigated this clinically relevant question in 3463 consecutive patients undergoing percutaneous coronary intervention.
MethodsThis study included patients with stable coronary artery disease and baseline high-sensitivity troponin T below the 99th percentile upper reference limit (0.014μg/L). High-sensitivity troponin T was measured before and at 6, 12 and 24hours after the procedure. The primary outcome was all-cause mortality.
ResultsPatients were divided into a group with peak postprocedural troponin T≤99th percentile (n=742), a group with peak postprocedural troponin T>99th to 5×99th percentile (n=1928), and a group with peak postprocedural troponin T>5×99th percentile upper reference limit (n=793). Advanced age, smaller body mass index, baseline troponin level, complex lesions, bifurcation lesions and stented length were independently associated with elevated troponin T levels after the procedure. The median follow-up was 15.5 months. There were 56 deaths: 5 deaths (1.7%) among patients with peak postprocedural troponin T≤99th percentile, 35 deaths (4.5%) among patients with peak postprocedural troponin T>99th to 5×99th percentile and 16 deaths (4.3%) among patients with peak postprocedural troponin T>5×99th percentile upper reference limit (hazard ratio=1.50; 95% confidence interval, 1.01-2.25; P=.047). After adjustment, peak postprocedural troponin T level was not independently associated with mortality after percutaneous coronary intervention (P=.094).
ConclusionsIn patients with stable coronary artery disease and without elevated baseline high-sensitivity troponin T, elevated high-sensitivity troponin T level after percutaneous coronary intervention was not associated with postprocedural mortality.
Keywords
Elevation of cardiac troponin (Tn) T or I levels following percutaneous coronary intervention (PCI) is frequent and is considered to indicate procedure-related myocardial injury; nevertheless, its clinical significance remains uncertain.1 With the introduction of high-sensitivity troponin (hs-Tn) assays, which are able to detect even minuscule concentrations of this biomarker,2–4 the uncertainty of the clinical value of Tn increments following PCI increased even further.5–7 In the “Third universal definition of myocardial infarction”,8 PCI-related myocardial infarction was defined as an elevation of cardiac hs-Tn T or I>5×99th percentile upper reference limit (URL) in patients with normal baseline values (≤ 99th percentile URL) in the presence of symptoms suggestive of myocardial ischemia or new ischemic electrocardiographic changes or angiographic findings consistent with a procedural complication or new loss of viable myocardium or new regional wall motion abnormality demonstrated by imaging tests. However, the document stated that the selection of the hs-Tn cutoff for the definition of PCI-related myocardial infarction was arbitrary rather than based on evidence. In current-day PCI, PCI-related acute complications such as Q-wave myocardial infarction, no-reflow or ST-segment or T wave abnormalities, which may support the definition of PCI-related myocardial infarction alongside the postprocedural hs-Tn, are either rare9–11 or have no clear prognostic relevance.12 Importantly, the prognostic value of>5×99th percentile URL cutoff of hs-Tn in patients with stable coronary artery disease (CAD) after PCI and normal preprocedural values of the biomarker has not been investigated. We undertook this study with 2 aims: first, we investigated the prognostic value of peak post-PCI hs-TnT level and the 5×99th percentile URL cutoff in patients with stable CAD and baseline hs-TnT level within the reference range (≤ 99th percentile URL), and, second, we assessed the correlates of increased levels of hs-TnT levels after PCI in these patients.
METHODSPatientsThe source sample comprised 8774 consecutive patients with CAD who were treated with PCI in 2 university hospitals between October 2009 and January 2015. Patients with a clinical diagnosis of stable CAD, angiography-confirmed significant CAD and baseline hs-TnT level≤99th percentile URL (0.014μg/L) were eligible for this study. We excluded patients with acute coronary syndromes, impaired renal function (serum creatinine level ≥ 2mg/dl) or acute infections, and known malignancies with life expectancy < 1 year. Thus, the study included 3463 patients fulfilling these criteria. By design, the study represents a retrospective analysis. The study was carried out in accordance with the Declaration of Helsinki.
Study DefinitionsStable CAD was diagnosed if the patient had chest pain that had not changed in character, intensity, threshold, or frequency during the last 2 months and if coronary stenosis of ≥ 50% of the lumen in at least one of the major coronary arteries was documented in diagnostic coronary angiography. Cardiovascular risk factors (hypertension, diabetes, hypercholesterolemia, and smoking) were defined according to accepted criteria. The quantitative coronary angiography analysis was performed in the core angiographic laboratory using an automated edge detection system by personnel unaware of the patients’ clinical or follow-up data. Baseline and postprocedural epicardial blood flow was assessed according to the Thrombolysis in Myocardial Infarction (TIMI) grading criteria. Global left ventricular ejection fraction (LVEF) was calculated using the area-length method. Patients’ weight and height were measured (during hospital stay) and were used to calculate the body mass index. Renal function was estimated by calculating the creatinine clearance according to the Cockcroft-Gault equation.
Biochemical MeasurementsBlood samples were collected into tubes containing lithium-heparin as anticoagulant immediately before and at 6, 12 and 24hours after the PCI procedure. Within 30minutes, the blood was centrifuged at room temperature and the plasma supernatant was immediately separated and analyzed. The plasma concentration of hs-TnT was measured in a Cobas e 411 immunoanalyzer based on electrochemiluminescence technology (Roche Diagnostics). The limit of blank—the concentration below which analyse-free samples are found with a probability of 95%—is≤0.003μg/L. The functional sensitivity—the lowest analysis concentration that can be reproducibly measured with a coefficient of variation≤10%—is≤0.013μg/L. The 99th URL is defined at 0.014μg/L. Creatinine was measured using a kinetic colorimetric assay based on the compensated Jaffe method. Other biochemical parameters were measured using standard laboratory methods. Laboratory personnel involved in laboratory measurements were unaware of the patients’ clinical or angiographic outcome.
Outcome Measurements and Follow-upBaseline and peak postprocedural hs-TnT values were used for analysis. A 12-lead electrocardiogram was performed before and 24hours after the procedure. If there was postprocedural chest discomfort or pain, additional electrocardiograms were recorded. Abnormal Q waves were defined according to the Task Force for the Universal Definition of Myocardial Infarction.8 The primary outcome was all-cause mortality. The follow-up protocol included telephone interviews at 1, 6 and 12 months after the PCI procedure and yearly up to 3 years thereafter. Data on mortality were obtained from hospital charts, death certificates, telephone contact with relatives of the patient or referring physicians, insurance companies or registration of address office. Follow-up information and adjudication of events was performed by medical personnel unaware of the patients’ clinical or hs-TnT data.
Statistical AnalysisData are presented as the median (25th to 75th percentiles), mean±standard deviation, counts and proportions (%) or Kaplan-Meier estimates (%). The 1-sample Kolmogorov-Smirnov test was used to assess the distribution of continuous data. Continuous data were compared with the Kruskal-Wallis rank-sum test or ANOVA, depending on the distribution pattern. Categorical data were compared with the chi-square test. Survival analysis was performed with the Kaplan-Meier method and differences in survival were assessed by calculating the hazard ratio with 95% confidence interval in the Cox proportional hazard model. A generalized estimating equation regression model (which accounts for the clustering of data for each patient) was used to assess factors independently associated with increased levels of hs-TnT after PCI. All variables in Tables 1 and 2 were entered into the model. The generalized estimating equation model with logistic regression link was also used to assess the factors associated with mortality. All variables that were significantly associated with mortality in univariable Cox proportional hazards model were entered into the model. Receiver operating characteristic (ROC) curve analysis was used to assess the discriminatory power of post-PCI hs-TnT levels regarding prediction of mortality and to calculate the optimal hs-TnT cutoff value for the prediction of mortality whilst maximizing sensitivity and specificity through minimizing the square root of (1 – sensitivity)2 + (1 – specificity)2. The sensitivity and specificity of the>5×99th percentile URL of post-PCI hs-TnT cutoff regarding prediction of mortality were also calculated. The statistical analysis was performed with the R 2.15.1 statistical package (The R foundation for Statistical Computing; Vienna, Austria). A 2-sided P < .05 was considered to indicate statistical significance.
Demographic, Clinical, and Angiographic Data
| Characteristic | High-sensitivity troponin T | P value | ||
|---|---|---|---|---|
| ≤ 99th percentile URL (n=742 patients) | > 99th to 5×99th percentile URL (n=1928 patients) | > 5×99th percentile URL (n=793 patients) | ||
| Age, y | 66.1 [58.3- 72.2] | 69.2 [61.5- 74.3] | 69.5 [61.9-74.5] | <.001 |
| Women | 197 (26.5) | 432 (22.4) | 187 (23.6) | .077 |
| BMI | 27.6 [25.2-30.2] | 27.4 [25.0-30.2] | 26.8 [24.5-29.4] | <.001 |
| Diabetes | 238 (32.1) | 535 (27.7) | 177 (22.3) | <.001 |
| Requiring insulin | 64 (8.6) | 133 (6.9) | 47 (5.9) | .110 |
| Arterial hypertension | 527 (71.0) | 1469 (76.2) | 620 (78.2) | .003 |
| Current smoker | 129 (17.4) | 266 (13.8) | 122 (15.4) | .061 |
| Hypercholesterolemia | 581 (78.3) | 1571 (81.5) | 647 (81.6) | .143 |
| Prior myocardial infarction | 248 (33.4) | 594 (30.8) | 225 (28.4) | .101 |
| Prior coronary artery bypass surgery | 82 (11.1) | 217 (11.3) | 100 (12.6) | .544 |
| Creatinine clearance, ml/min | 87.1 [70.8-107.4] | 83.4 [65.6-104.6] | 79.1 [62.6-98.6] | <.001 |
| Baseline hs-TnT, μg/L | 0.0092±0.0011 | 0.0099±0.0014 | 0.0098±0.0020 | <.001 |
| Peak hs-TnT, μg/L | 0.010 [0.010-0.010] | 0.030 [0.020-0.040] | 0.150 [0.100-0.270] | <.001 |
| Number of narrowed arteries | <.001 | |||
| One-vessel disease | 144 (19.4) | 343 (17.8) | 91 (11.5) | |
| Two-vessel disease | 218 (29.4) | 507 (26.3) | 191 (24.1) | |
| Three-vessel disease | 380 (51.2) | 1078 (55.9) | 511 (64.4) | |
| Multivessel disease | 598 (80.6) | 1585 (82.2) | 702 (88.5) | <.001 |
| Multilesion intervention | 203 (27.4) | 792 (41.1) | 499 (62.9) | <.001 |
| LVEF, %a | 60.0 [52.0-62.0] | 60.0 [52.0-62.0] | 59.0 [51.0-62.0] | .401 |
BMI, body mass index; hs-TnT, high sensitivity troponin T; LVEF, left ventricular ejection fraction; URL, upper reference limit.
Data are median [interquartile range], mean±standard deviation or number of patients No. (%).
Procedural Data (Lesion-based Analysis)
| Characteristic | High-sensitivity troponin T | P value | ||
|---|---|---|---|---|
| ≤ 99th percentile URL (n=989 lesions) | > 99th to 5×99th percentile URL (n=3029 lesions) | > 5×99th percentile URL (n=1636 lesions) | ||
| Vessel affected | .001 | |||
| Left main coronary artery | 36 (3.6) | 119 (3.9) | 73 (4.5) | |
| LAD coronary artery | 426 (43.1) | 1276 (42.1) | 710 (43.4) | |
| Left circumflex artery | 193 (19.5) | 710 (23.5) | 411 (25.1) | |
| Right coronary artery | 314 (31.7) | 881 (29.1) | 419 (25.6) | |
| Bypass graft | 20 (2.1) | 43 (1.4) | 23 (1.4) | |
| Complex lesions | 629 (63.6) | 2141 (70.7) | 1281 (78.3) | <.001 |
| Ostial lesion | 237 (24.0) | 777 (25.1) | 452 (27.7) | .100 |
| Bifurcational lesion | 286 (29.0) | 1016 (33.7) | 633 (38.8) | <.001 |
| Restenotic lesion | 124 (12.5) | 322 (10.6) | 123 (7.5) | <.001 |
| Preprocedural TIMI flow gradea | .515 | |||
| 0 | 36 (3.6) | 104 (3.4) | 62 (3.8) | |
| 1 | 24 (2.4) | 54 (1.8) | 40 (2.4) | |
| 2 | 47 (4.8) | 178 (5.9) | 96 (5.9) | |
| 3 | 882 (89.2) | 2688 (88.9) | 1438 (87.9) | |
| Balloon diameter, mm | 3.00 [2.75-3.50] | 3.00 [2.89-3.50] | 3.00 [3.00-3.50] | .007 |
| Maximal balloon pressure, atm | 14.0 [12.0-16.0] | 15.0 [12.0-17.0] | 15.0 [12.8-17.0] | <.001 |
| Total stented length, mm | 23.0 [18.0-28.0] | 23.0 [18.0-30.0] | 26.0 [18.0-36.0] | <.001 |
| Postprocedural TIMI flow gradeb | <.510 | |||
| 0 | 1 (0.1) | 4 (0.1) | 4 (0.2) | |
| 1 | 1 (0.1) | 1 (0.03) | 2 (0.1) | |
| 2 | 17 (1.7) | 48 (1.6) | 37 (2.3) | |
| 3 | 970 (98.1) | 2971 (98.3) | 1592 (97.4) | |
LAD, left anterior descending; TIMI, Thrombolysis in Myocardial Infarction; URL, upper reference limit.
Data are expressed as No. (%) or median [interquartile range].
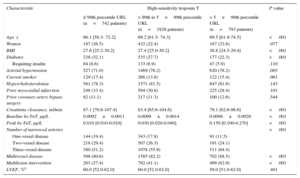
This study included 3463 patients with angiography-confirmed stable CAD and baseline hs-TnT level≤99th percentile URL. Using the 99th and 5×99th percentile URL cutoffs of peak post-PCI hs-TnT, patients were divided into 3 groups: a group with hs-TnT≤99th percentile URL (n=742 patients; 21.4%), a group with hs-TnT between>99th percentile URL and 5×99th percentile URL (n=1928 patients; 55.7%), and a group with hs-TnT > 5×99th percentile URL (n=793 patients; 22.9%). The patients’ baseline characteristics are shown in Table 1. With the exception of proportions of women, diabetic patients on insulin therapy, current smokers, those with hypercholesterolemia, prior myocardial infarction or a history of coronary artery bypass surgery and LVEF, all other characteristics differed significantly among the groups.
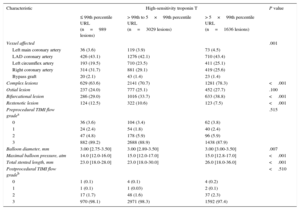
Procedural data are shown in Table 2. Overall, 5654 lesions were treated and analyzed. Except for the proportion of ostial lesions and baseline and postprocedural TIMI flow grade, all other characteristics differed significantly between the groups. Overall, a post-PCI TIMI flow grade 3 was observed in 98% of the lesions. Drug-eluting stents were implanted in 5335 lesions (94.4%): 920 lesions (93.0%), in patients with peak post-PCI hs-TnT≤99th percentile URL, 2858 lesions (94.4%) in patients with peak post-PCI hs-TnT between>99th percentile URL and 5×99th percentile URL, and 1557 lesions (95.2%) in patients with peak post-PCI hs-TnT>5×99th percentile URL. The main cardiovascular drugs prescribed at discharge in groups with baseline hs-TnT≤99th,>99th to 5×99th and hs-TnT>5×99th percentile URL were: statins in 687 patients (92.7%), 1812 patients (94.0%) and 740 patients (93.7%), respectively (P=.456); beta-blockers in 652 patients (88.0%), 1701 patients (88.3%) and 685 patients (86.8%), respectively (P=.532), and angiotensin-converting enzyme inhibitors in 498 patients (67.0%), 1298 patients (67.3%) and 547 patients (69.1%), respectively (P=.623).
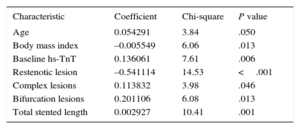
Variables Associated With Post-percutaneous Coronary Intervention High-sensitivity Troponin T LevelsThe generalized estimating equation regression model was used to assess the variables independently associated with hs-TnT after PCI (see “Methods” for the variables that were adjusted for). The model showed that age, body mass index, baseline Tn level, restenotic lesions, complex lesions, bifurcation lesions and total stented length were independently associated with increased levels of hs-TnT after PCI. The direction and strength of the association is shown in Table 3.
Variables Independently Associated with Elevated Post-percutaneous Coronary Intervention High-sensitivity Troponin T Level Obtained From the Generalized Estimating Equation Regression Model
| Characteristic | Coefficient | Chi-square | P value |
|---|---|---|---|
| Age | 0.054291 | 3.84 | .050 |
| Body mass index | –0.005549 | 6.06 | .013 |
| Baseline hs-TnT | 0.136061 | 7.61 | .006 |
| Restenotic lesion | –0.541114 | 14.53 | <.001 |
| Complex lesions | 0.113832 | 3.98 | .046 |
| Bifurcation lesions | 0.201106 | 6.08 | .013 |
| Total stented length | 0.002927 | 10.41 | .001 |
hs-TnT, high sensitivity troponin T.
There were 7 Q wave myocardial infarctions (0.2%) during the hospital stay.
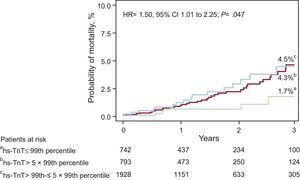
Post-percutaneous Coronary Intervention High-sensitivity Troponin T and MortalityThe length of follow-up (median [25th-75th percentiles]) was 15.5 [6.5-28.2] months or 15.7 [6.5-27.7] months in the group with hs-TnT≤99th percentile URL, 15.5 [6.5-28.7] months in the group with hs-TnT between>99th percentile URL and 5×99th percentile URL and 15.0 [6.4-27.1] months in the group with hs-TnT>5×99th percentile URL (P=0.517). Overall, there were 56 deaths during the follow-up: 5 deaths (1.7%) among patients with peak post-PCI hs-TnT≤99th percentile URL, 35 deaths (4.5%) among patients with peak post-PCI hs-TnT between>99th percentile URL and 5×99th percentile URL and 16 deaths (4.3%) among patients with peak post-PCI hs-TnT>5×99th percentile URL with percentages representing Kaplan-Meier-estimates of mortality (hazard ratio=1.50; 95% confidence interval [95%CI], 1.01-2.25; P=.047) (Figure 1).
,>99th to 5×99th percentile (red line) and>5×99th percentile (blue line) upper reference limit of hs-TnT. CI, confidence interval; HR, hazard ratio; hs-TnT, high sensitivity troponin T.")
On univariable analysis, age (P < .001), baseline TIMI flow grade (P=.030), LVEF (P < .001), restenotic lesion (P=.003), balloon diameter (P=.039), maximal balloon pressure (P=.049), post-PCI TIMI flow grade (P < .001), and peak post-PCI hs-TnT level (P=.021) were independently associated with an increased risk of mortality.
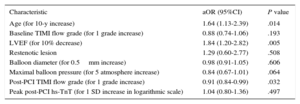
After adjustment in the generalized estimating equation model for variables associated with mortality identified in the univariable analysis, the association between peak hs-TnT and mortality was not significant (P=.094). The association between post-PCI hs-TnT and mortality remained nonsignificant when hs-TnT was entered into the model after logarithmic transformation (P=.497) or after being categorized at≤99th percentile, 1 to 5×99th percentile and>5×99th percentile URL groups (P=.485). In this model, patient age (P=.014), LVEF (P=.005) and TIMI flow grade after PCI (P=.032) were independently associated with an increased risk of mortality (Table 4).
Results of Generalized Estimating Equation Model Applied to Assess Correlates of Mortality
| Characteristic | aOR (95%CI) | P value |
|---|---|---|
| Age (for 10-y increase) | 1.64 (1.13-2.39) | .014 |
| Baseline TIMI flow grade (for 1 grade increase) | 0.88 (0.74-1.06) | .193 |
| LVEF (for 10% decrease) | 1.84 (1.20-2.82) | .005 |
| Restenotic lesion | 1.29 (0.60-2.77) | .508 |
| Balloon diameter (for 0.5mm increase) | 0.98 (0.91-1.05) | .606 |
| Maximal balloon pressure (for 5 atmosphere increase) | 0.84 (0.67-1.01) | .064 |
| Post-PCI TIMI flow grade (for 1 grade increase) | 0.91 (0.84-0.99) | .032 |
| Peak post-PCI hs-TnT (for 1 SD increase in logarithmic scale) | 1.04 (0.80-1.36) | .497 |
95%CI, 95% confidence interval; aOR, adjusted odds ratio; hs-TnT, high-sensitivity troponin T; LVEF, left ventricular ejection fraction; PCI, percutaneous coronary intervention; SD, standard deviation; TIMI, Thrombolysis in Myocardial Infarction.
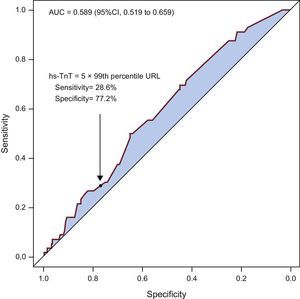
The discriminatory power of post-PCI hs-TnT was tested with the ROC curve analysis. The ROC curve analysis showed that hs-TnT after PCI predicted mortality with an area under the ROC curve of 0.589 [0.519-0.659]. Although the discriminatory power of peak post-PCI hs-TNT level in the prediction of mortality was significant, the magnitude of the area under the ROC curve was below the limit of clinical utility (generally accepted at an area under the ROC curve of 0.70 or greater). The peak post-PCI hs-TnT cut-off of 5×99th percentile URL had a sensitivity of 28.6% [17.3%-44.2%] and a specificity of 77.2% [75.7%-78.6%] for prediction of mortality (Figure 2). The best peak post-PCI hs-TnT value for predicting mortality whilst maximizing sensitivity and specificity was 0.047μg/L, corresponding to a sensitivity of 50% and a specificity of 64.8%. The 5×99th percentile URL had a positive predictive value of 2.0% [1.2%-3.3%] and a negative predictive value of 98.5% [98.0%-99.0%] for the prediction of mortality.

Receiver operating characteristic curve showing the discriminatory power of peak hs-TnT level after percutaneous coronary intervention to predict mortality. AUC, area under the receiver operating characteristic curve; CI, confidence interval; hs-TnT, high sensitivity troponin T; URL, upper reference limit.
The main findings of this study may be summarized as follows: a) in patients with stable CAD and baseline hs-TnT within the reference range, peak post-PCI hs-TnT or the>5×99th percentile URL cutoff were not associated with the adjusted risk of post-PCI mortality. The sensitivity of the 5×99th percentile URL cutoff of peak postprocedural hs-TnT for the prediction of mortality was 28.6%, which is outside the range of clinical utility; b) elevation of hs-TnT above the 99th percentile URL after PCI occurred in almost 80% of patients; an elevation of post-PCI hs-TnT>5×99th percentile URL occurred in nearly 23% of the patients; c) baseline values (age, preprocedural hs-TnT level, and smaller body mass index) and indices of procedural complexity (complex lesions, bifurcational lesions, and total stented length) were associated with increased levels of hs-TnT after PCI.
Previous studies on the prognostic value of Tn after elective or nonemergent PCI are controversial. A meta-analysis of 22 studies of patients undergoing nonemergent PCI between 1998 and 2009 found that post-PCI elevations of Tn T or I were associated with an increased risk of long-term mortality or composite adverse events of all-cause mortality and myocardial infarction.13 More recent studies, however, have failed to show an association between the response of Tn to nonemergent PCI and subsequent prognosis.14,15 With regard to the correlation between post-PCI Tn level and indices of myocardial necrosis/injury, imaging studies have also yielded mixed results.16,17 Although the exact reasons for such a high degree of controversy between the studies in the prognostic value of Tn levels after elective or nonemergent PCI are unclear, interstudy differences in patient characteristics may offer some clues. These studies mostly used conventional assays to measure circulating Tn and included mixed groups of patients in terms of clinical presentation (stable and unstable CAD) or baseline Tn (normal or elevated). Patients presenting with unstable CAD have a poorer outcome after PCI than patients with stable CAD.18 Evidence also suggests that the prognostic capability of post-PCI Tn depends on the clinical presentation of CAD and baseline Tn level. A recent study suggested that post-PCI TnT elevation predicted 1-year adverse outcome in patients with acute coronary syndromes but not in those with stable CAD.19 It has also been reported that long-term prognosis after PCI is mostly related to preprocedural Tn values and not to biomarker response following PCI.20 Moreover, if preprocedural Tn levels are unstable or elevated, it may be impossible to distinguish biomarker increases due to PCI from those due to preprocedural myocardial alterations and it is reasonable to assume that there is an overlap between the prognostic value of baseline and post-PCI biomarker increases.21 Thus, these studies clearly show that differences in clinical presentation and baseline Tn levels are strong confounders that affect the association between Tn after PCI and clinical outcome.
The present study differs from the above-mentioned studies in that it used a hs-Tn assay and included patients with clinically stable CAD and not elevated baseline Tn levels. Due to these design aspects, the present study enables the assessment of the prognostic value of strictly PCI-related hs-TnT response in a homogeneous group of patients. The current study found no association between peak hs-TnT after PCI and mortality in these patients. Notably, an association between peak post-PCI hs-TnT and mortality that was of borderline statistical significance in univariable analysis was attenuated to below the level of significance after adjustment for relevant baseline risk variables. Moreover the>5×99th percentile URL hs-TnT cutoff–a criterion proposed by the “Third universal definition of myocardial infarction” document to detect post-PCI myocardial infarction–has a low and clinically not usable sensitivity to detect the risk of mortality. Although the exact reasons for the failure of post-PCI hs-TnT to predict subsequent mortality remain unclear, the use of an oversensitive Tn assay could offer some explanation. The degree of sensitivity of the hs-TnT assay used allows detection of protein release from a quantity of myocardial tissue of a few milligrams in size.2 Thus, it is possible that PCI-related myocardial damage leading to TnT elevation above the 99th percentile URL or even 5×99th percentile URL could be either transient and recoverable or clinically not meaningful if it persists.
In the “Third universal definition of myocardial infarction” document, the 5×99th percentile URL cutoff was recommended for use as a marker of PCI-related myocardial infarction in conjunction with clinical, electrocardiographic or angiographic indices of myocardial injury. Nonetheless, there are at least 2 problems related to the use of these indices of myocardial injury after PCI. First, in the current-day practice of PCI in stable CAD, the frequency of failed or complicated procedures is very low. In the current study, Q-wave myocardial infarction within 48hours of PCI was encountered in only 0.2% of the patients and the frequency of angiographic no-reflow (TIMI flow grade≤2) was 2%. Therefore, the proportion of patients with post-PCI hs-TnT>5×99th percentile URL was>100 times higher than the frequency of Q-wave myocardial infarction and>10 times higher than the frequency of angiographic no-reflow. Thus, in approximately 98% of patients with stable CAD undergoing PCI, the>5 ×99th percentile URL criterion should be interpreted as an isolated finding. Second, when PCI-related complications occur, it may be that the complications per se but not postprocedural hs-TnT predict the subsequent prognosis.
The current study identified several procedure-related (complex lesions, bifurcation lesions, and total stented length) factors as being associated with elevated TnT level after PCI. This finding corroborates the findings of prior studies that have implicated procedure-related distal embolization of atherosclerotic/thrombotic material or side branch occlusion in the elevation of biomarkers of myocardial injury after PCI.1,22 Notably, the finding of an inverse association between intervention in restenotic lesions—known to have less atherosclerotic and more fibrotic content compared with native atherosclerotic plaques—and postprocedural hs-TnT level, offers additional, albeit indirect, evidence of the involvement of distal embolization of thrombotic material in the genesis of myocardial injury and elevation of its circulating biomarkers after PCI.
LimitationsThe present study has some limitations. First, the study is a retrospective analysis and as such it has the limitations inherent to this design. Second, elevated baseline hs-TnT levels are associated with cardiovascular risk factors,23 more extensive CAD,24 and comorbidities,25 all of which tend to cluster among patients with elevated baseline level of the biomarker. By excluding patients with elevated baseline hs-TnT levels, we filtered out an important portion of cardiovascular risk which was retained in the excluded patients. Thus the inclusion of low-risk patients in the current study might have had consequences such as a reduced incidence of PCI-related complications and a low subsequent mortality.
CONCLUSIONSIn patients with stable CAD and no elevation of preprocedural hs-TnT, peak postprocedural hs-TnT level or the 5×99th percentile URL cutoff were not associated with an increased risk of mortality up to 3 years after PCI. In this regard, the proposed 5×99th percentile URL cutoff of peak hs-TnT after PCI in patients with stable CAD and the preprocedural hs-TnT within the reference range offers no reliable prognostic value and may need reappraisal.
CONFLICTS OF INTERESTNone declared.
- –
Elevated troponin level after percutaneous coronary intervention is frequent, yet its prognostic value remains controversial.
- –
An elevation of high-sensitivity troponin level of>5×99th percentile upper reference limit in patients with normal baseline values of the biomarker is used as a criterion for percutaneous coronary intervention-related myocardial infarction in the presence of symptoms of ischemia or electrocardiographic, angiographic, or imaging evidence of myocardial damage.
- –
The prognostic value of>5×99th percentile upper reference limit cutoff of high-sensitivity troponin after percutaneous coronary intervention in patients with stable coronary artery disease and normal preprocedural value of the biomarker has not been investigated.
- –
Elevation of high-sensitivity troponin T above the>5×99th percentile upper reference limit occurred in nearly 23% of the patients with stable coronary artery disease after percutaneous coronary intervention.
- –
In patients with stable coronary artery disease and baseline high-sensitivity troponin T within the reference range, peak postprocedural or the>5×99th percentile upper reference limit cutoff did not predict the risk of mortality after percutaneous coronary intervention.
- –
The proposed 5×99th percentile upper reference limit of high-sensitivity troponin after percutaneous coronary intervention in patients with stable coronary artery disease and no elevation of preprocedural troponin level offers no reliable prognostic value and may need reappraisal.