Keywords
INTRODUCTION
Diabetes mellitus (DM) is one of the most important risk factors for cardiovascular disease. The risk of cardiovascular disease in patients with DM is at least 2-4 times that faced by non-diabetics of similar age.1 This association has important consequences since it is expected that the prevalence of DM will increase over the next 30 years, and that up to 75% of these patients will die as a consequence of coronary heart disease.2 In patients with DM, coronary heart disease is more likely to appear as an acute coronary syndrome (ACS) associated with a more complicated hospital course, a more frequent recurrence of ischemia, and a greater risk of death, than in non-diabetic patients.3
Patients with hyperglycemia and DM who suffer an episode of ACS experience a greater incidence of adverse events such as congestive heart failure, cardiogenic shock, ventricular arrhythmias, and death.4 However, this association between hyperglycemia and adverse events is not exclusive to patients with DM. It is known that a high admission plasma glucose (APG) level in patients with ACS is a marker of a poor prognosis, and therefore of a poor course of disease progression, in both diabetics and non-diabetics.5-13 In the search for markers of metabolic status that can help clinicians arrive at short-and long-term prognoses, little has been written on the role of the first fasting plasma glucose (FPG) concentration in patients with ACS whether diabetic or not.14-17 The aim of the present study was to investigate the prognostic value of the FPG concentration in patients presenting with ACS, and to determine whether it is a better predictor of adverse events (death and/or reinfarction during hospitalization) than the APG concentration.
METHODS
Study Population
This work was designed as a historic cohort study in which all patients consecutively admitted to the Coronary Unit of the Hospital Clínico San Carlos de Madrid between January and December 2006 with a diagnosis of ACS were analyzed. To be included, patients had to have been admitted for ACS defined by current clinical practice guidelines as at least 1 episode of chest pain or equivalent symptoms in the previous 24 h plus electrocardiographic signs consistent with a persistent elevation of the ST segment of 31 mm in 2 or more contiguous leads, or complete left bundle block of new appearance and the development of new Q waves, or a reduction of the ST segment in 2 or more contiguous leads with or without an elevation in markers of myocardial necrosis (troponin I higher than the normal laboratory limit) at admission.18,19
Patients referred from other hospitals in order to receive coronary angiography and/or coronary angioplasty, who were admitted to our unit for post-procedural observation, were not included. Patients whose pain characteristics raised doubts regarding a coronary origin were also excluded. Patients who required assisted ventilation at admission due to their critical condition (ie, those who had required pre-hospital resuscitation for cardiorespiratory arrest), or who died before their FPG concentrations could be recorded (which required a minimum 8 h period of documented fasting), were also excluded.
Variables Analyzed
All patients were subjected to anamnesis, a physical examination, 12-lead electrocardiography (ECG), a chest x-ray, and transthoracic echocardiography within 24 h of admission. Blood was taken from all patients in order to perform a hemogram and biochemical testing (including the determination of the plasma glucose concentration), and to check coagulation times at admission and after fasting (at least 8 h after the last meal; performed early the next morning after admission). The concentration of the myocardial necrosis marker troponin I was determined at admission and then every 8 h until it reached peak values; determinations were then made every 24 h until enzymatic normalization. The results of all other complementary tests (depending on the clinical course of the disease) performed during hospitalization were documented.
The clinical variables recorded were age, sex, history of DM, treatment with insulin, use of tobacco, hypercholesterolemia, blood pressure, history of myocardial infarction, the existence of ACS with or without ST segment elevation, the location of the infarction, the number and type of vessels affected (as determined by coronary angiography), Killip classification at admission,20 left ventricular ejection fraction (LVEF), creatinine at admission, peak troponin I, and the APG and FPG concentrations. The last 2 variables were analyzed by first grouping them into the following intervals as recommended by the American Diabetes Association and the results of previous studies13,21: <126, 126-200, and >200 mg/dL. The treatment received by patients was also noted; this included the administration of intravenous nitroglycerine, acetylsalicylic acid, clopidogrel, glycoprotein IIb/IIIa inhibitors, statins, beta-blockers, angiotensin converting enzyme inhibitors (ACEi), intravenous insulin, and pharmacological fibrinolysis, as well as coronary angioplasty, and surgical revascularization. Finally, adverse events occurring during hospitalization, such as death, reinfarction (re-elevation of enzymatic markers plus typical electrocardiographic changes or chest pain), post-infarction angina (typical chest pain with or without electrocardiographic changes but without enzyme elevation), malignant ventricular arrhythmias (sustained ventricular fibrillation and/or ventricular tachycardia with hemodynamic instability), cardiogenic shock and the combined event death and/or reinfarction were recorded. Determining all these variables forms part of the normal management of patients entering our unit. No additional tests requiring the explicit consent of the patients were performed. All results were handled according to current data protection laws and following the ethical principles of the Declaration of Helsinki.22
Statistical Analysis
All calculations were performed using SPSS v12.0 software (SPSS Inc., Chicago, Illinois, USA). Univariate analysis was performed in which frequencies and percentages were recorded for each categorical variable, along with the means and standard deviations of the quantitative variables. In all cases the distribution of each variable was checked against theoretical models and the homogeneity of variance tested. Significance was set at P<.05. To determine the P values and to examine the association between the categorical variables, the c2 was used. Odds ratios (OR) and 95% confidence intervals (CI) were also calculated. The association between quantitative variables and the appearance of adverse events was studied using the Student t test or via analysis of variance, according to the number of categories of the variable in question. Receiver operator characteristic (ROC) curves were plotted for APG and FPG, using the above-mentioned intervals, expressing the area under the curve and the 95% CI. Finally, multivariate analysis (logistic regression) was used to calculate the OR and 95% CI of suffering death and/or reinfarction adjusted for the APG and FPG, as well as for the variables that in univariate analysis were significant and clinically relevant.
RESULTS
During 2006 a total of 558 patients were admitted to our unit with a diagnosis of ACS. Of these, 11 were excluded, 5 who presented recovering from pre-hospital cardiorespiratory arrest, and 6 who died within a few hours (and therefore before both plasma glucose levels could be determined). The remaining 547 met the inclusion criteria, of whom 46 progressed to the primary endpoint (combined death and/or reinfarction; number of deaths = 25). Table 1 shows the demographic and clinical characteristics of, and the treatment received by, the patients who died and/or suffered reinfarction and those who did not. The mean age of the members of the death and/or reinfarction group was greater (72.2 [12.1] compared to 65 [13.1] years; P<.001). This group also showed a higher proportion of diabetics (P=.026), smokers (P=.005), and of patients with a history of myocardial infarction (P=.016). No significant differences were seen in sex, prior treatment with insulin, hypercholesterolemia, or high blood pressure.

The patients who suffered death and/or reinfarction more commonly had more than 1 vessel affected (as shown by coronary angiography) (P=.023), a higher Killip class (P<.001), a higher creatinine level at admission (1.6 [1.4] compared to 1.1 [0.6] mg/dL; P<.001), a higher APG value (160.8 [70.1] compared to 122.4 [41.6]; P=.004), a higher FPG value (183.8 [75.9] compared to 150.2 [61]; P<.001), and a lower LVEF (39.9% [12.7%] compared to 46.4% [11.5%]; P=.002).
With respect to the treatment received, no significant differences were seen in the use of intravenous nitroglycerine, acetylsalicylic acid, clopidogrel, glycoprotein IIb/IIIa inhibitors, statins, beta-blockers, ACEi, or intravenous insulin (as administered following current clinical practice guidelines),18,19 nor in revascularization treatment (percutaneous or surgical).
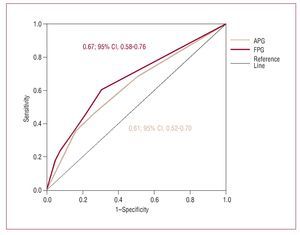
The appearance of adverse events was checked against the APG and FPG concentration groups (<126, 126-200, and >200 mg/dL) (Table 2). Both increasing APG and FPG concentrations were associated with a greater proportion of deaths (APG, P=.005; FPG, P<.001), cardiogenic shock (APG, P<.001; FPG, P<.001), malignant ventricular arrhythmias (APG, P<.001; FPG, P<.001), and the combination death and/or reinfarction (APG, P=.004; FPG, P<.001). Only the FPG concentration was associated with a greater proportion of reinfarctions (APG, P=.236; FPG, P=.021). Figure 1 shows the ROC curves for APG and FPG. The area under the curve for FPG is slightly larger than for APG (FPG=0.67; 95% CI, 0.58-0.76; APG=0.61; 95% CI, 0.52-0.70) with respect to the prediction of death and/or reinfarction.

Figure 1. ROC curve for admission plasma glucose (APG) and first fasting plasma glucose (FPG).

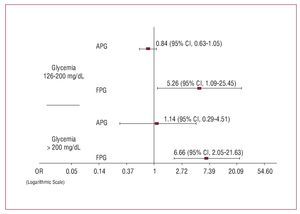
Logistic regression was performed to evaluate the impact of APG and FPG on the appearance of the primary endpoint. This included all the variables that were significant in univariate analysis: age, history of DM, history of myocardial infarction, prior smoking, creatinine concentration at admission, Killip class at admission, the number of vessels affected in coronary angiography, LVEF, and the APG and FPG concentrations. The risk of death and/or reinfarction showed a stronger association with FPG than APG in all the studied intervals; the OR for FPG for the intervals 126-200 and >200 mg/dL compared to <126 mg/dL were significantly different (126-200 mg/dL, OR=5.26; 95% CI, 1.09-25.45; >200 mg/dL, OR=6.66; 95% CI, 2.05-21.63), though this was not the case for APG (126-200 mg/dL, OR=0.84; 95% CI, 0.63-1.05; >200 mg/dL, OR=1.14; 95% CI, 0.29-4.51). Figure 2 shows these results on a logarithmic scale in order to offset the positive asymmetry of the confidence intervals and better visualize the differences. With respect to the remaining variables, only a history of infarction
appeared as an independent risk factor (OR=3.39; 95% CI, 1.28-8.99) along with the creatinine concentration at admission (OR=1.93; 95% CI, 1.09-3.43). A history of DM did not appear as an independent risk factor (OR=1.26; 95% CI, 0.43-3.65).

Figure 2. Comparison of the odds ratio and 95% confidence intervals for inhospital death and/or reinfarction associated with the values of admission plasma glucose (APG) and first fasting plasma glucose (FPG), according to multivariate analysis adjusted for age, smoking status, previous myocardial infarction, the number of vessels affected (as determined by coronary angiography), creatinine at admission, LVEF, and Killip class at admission. The data are shown on a logarithmic scale to better reveal the differences found and offset the positive asymmetry of the confidence intervals.
DISCUSSIONThe present results reinforce the prognostic importance of DM and the plasma glucose status of patients suffering an ACS.1,3 Diabetes mellitus was more prevalent among patients who died/suffered reinfarction during their hospitalization, as were high APG and FPG concentrations. The results show FPG to be a better predictor of adverse events than APG.
Although having DM has recently been considered as equivalent to cardiovascular disease rather than as a mere risk factor for the latter,23 it has also been described that hyperglycemia at admission is an equally good or even better predictor of death and/or reinfarction than the presence of diabetes.7 The majority of studies published evaluate the influence of APG on the prognosis of patients admitted with ACS.5-13. However, some authors have put forward the idea that FPG may have a determining role. Otten et al13 showed that fasting glycemia was an independent predictor of adverse events (death, reinfarction, cardiogenic shock, ictus, pulmonary edema, cardiac arrest, and supraventricular arrhythmias) in patients with ACS. In addition, the unadjusted analyses of Ravid et al16 and Soler et al17 suggested fasting glycemia to be a significant risk factor. Suleiman et al15 observed a significant relationship between high FPG and APG values and mortality at 30 days in non-diabetic patients who had suffered an acute myocardial infarction; death occurred in patients with high FPG and normal APG values, or in those in whom both FPG and APG were high, but not in those in whom APG was high but FPG was normal.
The results of the present work show that both high APG and FPG concentrations are associated with a greater number of adverse events. With the exception of post-infarction angina and reinfarction (the latter only for APG), the remaining adverse events were significantly related to these glycemia values. Two of our sets of results support the hypothesis that FPG is a better predictor of adverse events than APG in hospitalized patients with ACS. Firstly, the multivariate analysis shows that only FPG is an independent predictor of death and/or reinfarction; no other statistically significant variables, such as age, a history of DM, previous smoking, Killip class, the number of vessels affected as determined by coronary angiography, creatinine at admission, LVEF, or a history of infarction appear to be useful. It is important to point out that, when adjusting for DM, this variable did not appear as an independent risk factor. According to the univariate analysis, it would appear that neither the type of ACS (with or without elevation of the ST segment), nor prior treatment with insulin, nor its intravenous administration in hospital have any influence on outcomes. Secondly, and although the differences found are more modest than in the multivariate analysis, the results of the ROC curve analysis for APG and FPG show an inclination towards FPG being the more important variable (with its slightly bigger area under the curve), despite the limitations of the confidence intervals (which overlap to some extent).
The mechanism by which glycemia is associated with higher mortality remains somewhat unclear. It would appear that the response to stress during ACS increases catecholamine, cortisol, and glucagon concentrations, while reducing the secretion of insulin and the sensitivity of its peripheral receptors. The main metabolic consequences are the stimulation of glycogen breakdown, neoglucogenesis, and the synthesis of fatty acids—all of which lead to increased myocardial damage.6,24-26 The coagulation system is also affected. It is reported that patients with diabetes show hypercoagulability, which has important implications for their management since resistance to antiaggregant treatment (aspirin and clopidogrel) and restenosis after percutaneous intervention are more common in diabetics.27 It has also been shown28-29 that the administration of insulin during the acute phase of an infarction not only improves glycemia but reduces anaerobiosis in the myocardial tissue and corrects hypercoagulability by reducing the production of thromboxane A2 and PAI-1. The main consequence is a reduction in hospital and long-term morbidity and mortality.24-29
The explanations of why FPG may be a better predictor of adverse events are several. Circadian changes in glycemia values and the variability in time between the last meal and time of admission may affect APG values.30 Since this is not the case with the FPG values, the latter may better represent the metabolic status of the patient. Further, in patients whose clinical progress is poor during the first few hours after admission (due to the seriousness of their condition, or due to poorer management at the start of treatment), a rising FPG level reflects a worsening metabolic status and increasing glycemia as the clinical situation deteriorates. This reinforces the idea that this value should be measured.
Finally, although this is an observational study involving a historic cohort, the sample size, the protocol followed with respect to the clinical history of patients at our unit, and the consistency of the statistical analyses reinforce the value of the results obtained.
CONCLUSIONS
This study shows that, in patients admitted for ACS (with or without ST segment elevation), the FPG concentration better predicts the likelihood of suffering an in-hospital adverse event. This suggests that the FPG concentration is a better indicator of metabolic status than APG during the first days after the onset of an ACS. The results suggest further research should be performed into the optimum management of hyperglycemia in such patients.
SEE EDITORIAL ON PAGES 447-50
ABBREVIATIONS
ACS: acute coronary syndrome
APG: admission plasma glucose
DM: diabetes mellitus
FPG: first fasting plasma glucose LVEF: left ventricular ejection fraction
Correspondence:
Dr. D. Vivas Balcones.
Servicio de Cardiología. Hospital Clínico San Carlos.
Prof. Martín Lagos, s/n. 28040 Madrid. España.
E-mail: david_vivas_balcones@hotmail.com
Received June 16, 2007.
Accepted for publication November 27, 2007.