According to the 2013 analysis of the Institute of Health Metrics, high body mass index values are the most important risk factor for disease in Spain. Consequently, we describe the prevalence of total obesity and abdominal obesity in the Spanish adult population (25–64 years) for 2014-2015.
MethodsThe sample was taken from the ENPE study, a cross-sectional study with a representative sample of the noninstitutionalized population (n = 6800) carried out between May 2014 and May 2015. This analysis refers to the population between age 25 and 64 years (n = 3966). The anthropometric measurements were performed by trained observers at participants’ homes according to standard international protocols. Body mass index ≥ 25 was defined as overweight and ≥ 30 as obesity. Abdominal obesity was classified as waist > 102 cm in men and > 88 cm in women.
ResultsThe estimated prevalence of overweight in the Spanish adult population (25–64 years) was 39.3% 95% confidence interval [95%CI], 35.7%-42.9%). The prevalence of general obesity was 21.6% (95%CI, 19.0%-24.2%) and, more specifically, was 22.8% (95%CI, 20.6%-25.0%) among men and 20.5% (95%CI, 18.5%-22.5%) among women, and rose with age. The prevalence of abdominal obesity was estimated at 33.4% (95%CI, 31.1%-35.7%) and was higher among women (43.3%; 95%CI, 41.1%-45.8%) than among men (23.3%; 95%CI, 20.9%-25.5%), and also rose with age.
ConclusionsThe prevalence of general obesity and abdominal obesity in Spain is high, although the distribution differs according to autonomous community. A comparison with earlier data reveals a considerable increase in overweight, indicating the need for routine monitoring and comprehensive initiatives.
Keywords
The large overall rise in obesity is one of the most difficult public health challenges faced by current society, a situation that not only affects higher income countries, but is also worsening in countries with low and middle income levels.1 According to the World Health Organization (WHO), the world prevalence of obesity (body mass index [BMI] ≥ 30) has almost doubled between 1980 and 2014. Around the world, overweight and obesity are associated with more deaths than low weight.1
High BMI and abdominal obesity (AO) values are known to be associated with all-cause mortality,2,3 morbidity,4 and disability, and consequently with years of life characterized by deteriorated health and low quality of life,5 a situation that has led to mounting health costs.6 Obesity is a risk factor for diseases such as type 2 diabetes mellitus (DM), cardiovascular disease, and some types of cancer.1,7,8
Although premature morbidity and mortality due to cardiovascular disease in industrialized nations have dropped considerably in the last 40 years, this trend could be slowed or even reversed by the increase in obesity and type 2 DM. This rise in overweight and obesity among adults may be predictive of a potential continual increase in morbidity and mortality in upcoming decades.1,9,10
According to a report prepared with 2013 data by the Institute for Health Metrics and Evaluation on the disease burden attributable to the main 15 risk factors, expressed as a percentage of disability-adjusted life years, the risks associated with a high BMI and an improper dietary profile are ranked first and second in the analysis performed for Spain.11,12
Some authors report that the prevalence of obesity is possibly now holding steady.13 However, a disparity has been observed in data from the adult population in different European countries, and rising trends continue to be reported among adults in some studies.13,14
The high prevalence of overweight makes constant monitoring necessary to improve strategies against obesity in Spain. In 2013, the WHO adopted the Global Action Plan for the Prevention and Control of Noncommunicable Diseases 2013-2020, which set a target to halt the rise in obesity between 2010 and 2025.15
Earlier studies have published obesity estimates in the Spanish adult population based on self-reported data,16 but this type of information tends to underestimate the prevalence17 because participants tend to underestimate their weight and overestimate their height when stating these parameters. The earliest population data based on adult weight and height measurements come from local and regional studies conducted in the 1990s. The SEEDO (Spanish Society for the Study of Obesity) study18 performed the first estimate for all of Spain, using the analysis of a dataset composed of regional studies available from random population samples that followed comparable procedures. These data were updated years later in the DORICA study.19 Between 2008 and 2010, the ENRICA study20 provided estimates for adults using anthropometric data from a country-wide population sample.
Most population studies use waist circumference (WC) to estimate the prevalence of AO, an indicator that could overestimate and underestimate the risk of tall and short individuals, respectively, because height is not taken into consideration.21 One proposed alternative is the waist-to-height ratio (WHtR), which has been found to be a good indicator of abdominal adiposity, similar to WC. Some meta-analyses and systematic reviews support its use as a better predictor of cardiovascular risk factors.22–25 In 2011, Bergman et al26 proposed the use of a body adiposity index as a direct estimator of the percentage of total adiposity.
The aim of our study was to describe the prevalences of overall obesity and AO in a representative sample of the Spanish population aged 25 to 64 years in 2014-2015 and to analyze the distribution of various indicators of body adiposity.
METHODSAll data were taken from the ENPE study (Spanish acronym for the Nutritional Study of the Spanish Population), a cross-sectional observational study designed to collect recent data on consumer dietary habits, anthropometric data, and physical activity in the noninstitutionalized Spanish population older than 3 years. The study was carried out in a representative probabilistic sample (n = 6800) selected by a random multistep procedure, performed in 3 phases, with stratification of the units from the first step (census sections) according to autonomous community. A second step considered the primary residences within each census unit, using a random selection procedure. Likewise, individuals were selected from each home, with controlled quotas and proportional allotments according to the population density by age bracket (3-8 years, 9-18 years, 19-64 years, and > 65 years), sex, and municipality size, using the population census published by the National Institute of Statistics (January 2014). The scope of the study included all residents whose primary residence was in Spain.
Pregnant women were excluded from the study. Additionally, the anthropometric measurements excluded persons who were unable to remain standing, were missing an arm or leg, or were immobilized with plaster splints that could not be removed.
The sample was recruited using a field procedure based on random routes. The data were collected between May 2014 and May 2015 by face-to-face interviews at the home of each participant. SIGMA DOS, a company that conducts population studies, coordinated the sample design and handled the logistics of the fieldwork.
The final sample included 6800 individuals, 3966 of them aged 25 to 64 years, which provided a margin of error of 1.62%. The participation of 400 individuals per autonomous community was ensured (sample error, 4.89%).
Anthropometric MeasurementsAll individual anthropometric measurements were taken by well-trained professional interviewers who participated in specific training seminars developed by the study authors. Standard international procedures27 were followed after prior testing in a pilot study. The measurements were performed with participants in the standing position, barefoot, and with lightweight clothing. Height was measured in centimeters using a Seca 213 portable stadiometer (Seca GmbH & Co. Kg.; Hamburg, Germany) (range, 0-200 cm; precision, 0.1 cm). Body weight was obtained using calibrated Seca 803 digital scales (range, 0.1-150 kg; precision, 0.1 kg). Waist circumference was measured at the midpoint between the last costal margin and the iliac crest, and the hip circumference was measured horizontally around the largest circumference on the buttocks. Both circumferences were measured 3 times with a Seca 201 nonstretch measuring tape (range, 0-150 cm; precision, 0.1 cm). The BMI was calculated as weight (kg) divided by the square of the height (m). In addition, the waist-to-hip ratio (WHR) was calculated as WC (cm)/hip circumference (cm). The WHtR was calculated as WC (cm)/height (cm). The body adiposity index was calculated as proposed by Bergman et al26: hip circumference (cm)/(height [m])1.5 – 18. Quality controls showed that intraobserver- and interobserver-related measurement errors were less than 1% for all anthropometric parameters reported, values well below those considered acceptable.28
Overweight was defined as BMI ≥ 25 and obesity as BMI ≥ 30. Additionally, the criteria proposed by the SEEDO were used for weight typing based on BMI value into the following categories: underweight (BMI < 18.5), normal weight (BMI = 18.5-24.9), overweight I (BMI = 25.0-26.9), overweight II (BMI = 27.0-29.9), obesity I (BMI = 30.0-34.9), obesity II (BMI = 35.0-39.9), obesity III (BMI = 40.0-49.9), and obesity IV (BMI ≥ 50)29. Abdominal obesity was defined as WC > 102 cm in men and > 88 cm in women, according to the WHO criteria.30 Using the WHR, AO was defined as values > 0.90 in men and > 0.85 in women.30 According to the WHtR, AO was defined as values > 0.524 and also using the criterion that proposes WHtR values > 0.55.31
Data AnalysisThe analysis was done using all participants aged 25 to 64 years who had full information for the variables of interest (3801 for BMI and 3842 for waist and hip circumferences). The prevalence of obesity and AO was calculated with the respective 95% confidence interval (95%CI) according to age bracket and sex. Confidence intervals were calculated by applying bootstrap techniques,32 based on 1000 samples. The prevalence rates for age-adjusted overweight and obesity were calculated for each autonomous community using a direct method, with the Spanish distribution population taken as a standard population. The sample was weighted according to the Spanish population distribution. The Kruskall-Wallis nonparametric test was used to compare mean values by age bracket, and the chi-squared test and the z-test were used to compare the prevalence rate according to age and sex. The analysis took the complex design of the sample into consideration and was performed using IBM SPSS v. 19.0.
Ethical ConsiderationsAll participants were informed of the study objectives and procedures and gave written consent to participate. The final protocol was approved by the Euskadi Clinical Research Ethics Committee and performed in accordance with the World Medical Association's Declaration of Helsinki for research involving human subjects.33 The study maintained strict confidentiality of the information provided by all the participants as set forth in Organic Act 15/1999, of December 13, on the protection of personal data in all processes used to record and handle the information obtained. A firm specializing in population studies, SIGMA DOS, is the guarantor and custodian of the information and ensures the absolute confidentiality and secrecy of the data collected.
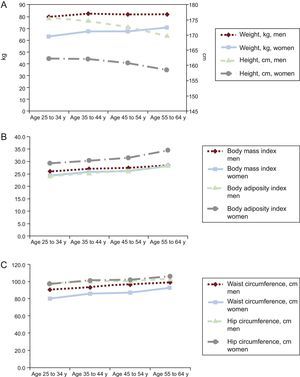
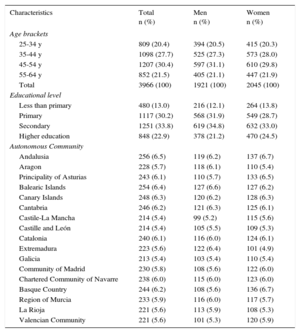
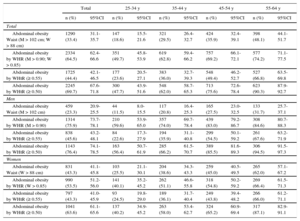
RESULTSTable 1 describes the study group by sex, age, educational level, and autonomous community. Valid anthropometric data were available for 3801 participants (1863 men and 1938 women), which accounted for 95.8% of the participating sample (96.9% of men and 94.7% of women). Weight was significantly higher in men aged 25 to 34 years and the following age bracket of 35 to 44 years, whereas among women, it increased significantly as they grew older. Height gradually dropped with age in both men and women (Table 2). The mean BMI for the Spanish adult population was 26.7 (BMI = 27.2 in men and BMI = 26.1 in women) and increased significantly with age, similar to body adiposity index, which showed lower mean values than BMI in men, but higher mean values than BMI in women in all age brackets. Waist and hip circumferences showed mean values that were significantly higher with age in both men and women, as seen with WHR and WHtR (Figure 1).
Sample Distribution by Age Bracket, Sex, Educational Level, and Autonomous Community
| Characteristics | Total n (%) | Men n (%) | Women n (%) |
|---|---|---|---|
| Age brackets | |||
| 25-34 y | 809 (20.4) | 394 (20.5) | 415 (20.3) |
| 35-44 y | 1098 (27.7) | 525 (27.3) | 573 (28.0) |
| 45-54 y | 1207 (30.4) | 597 (31.1) | 610 (29.8) |
| 55-64 y | 852 (21.5) | 405 (21.1) | 447 (21.9) |
| Total | 3966 (100) | 1921 (100) | 2045 (100) |
| Educational level | |||
| Less than primary | 480 (13.0) | 216 (12.1) | 264 (13.8) |
| Primary | 1117 (30.2) | 568 (31.9) | 549 (28.7) |
| Secondary | 1251 (33.8) | 619 (34.8) | 632 (33.0) |
| Higher education | 848 (22.9) | 378 (21.2) | 470 (24.5) |
| Autonomous Community | |||
| Andalusia | 256 (6.5) | 119 (6.2) | 137 (6.7) |
| Aragon | 228 (5.7) | 118 (6.1) | 110 (5.4) |
| Principality of Asturias | 243 (6.1) | 110 (5.7) | 133 (6.5) |
| Balearic Islands | 254 (6.4) | 127 (6.6) | 127 (6.2) |
| Canary Islands | 248 (6.3) | 120 (6.2) | 128 (6.3) |
| Cantabria | 246 (6.2) | 121 (6.3) | 125 (6.1) |
| Castile-La Mancha | 214 (5.4) | 99 (5.2) | 115 (5.6) |
| Castille and León | 214 (5.4) | 105 (5.5) | 109 (5.3) |
| Catalonia | 240 (6.1) | 116 (6.0) | 124 (6.1) |
| Extremadura | 223 (5.6) | 122 (6.4) | 101 (4.9) |
| Galicia | 213 (5.4) | 103 (5.4) | 110 (5.4) |
| Community of Madrid | 230 (5.8) | 108 (5.6) | 122 (6.0) |
| Chartered Community of Navarre | 238 (6.0) | 115 (6.0) | 123 (6.0) |
| Basque Country | 244 (6.2) | 108 (5.6) | 136 (6.7) |
| Region of Murcia | 233 (5.9) | 116 (6.0) | 117 (5.7) |
| La Rioja | 221 (5.6) | 113 (5.9) | 108 (5.3) |
| Valencian Community | 221 (5.6) | 101 (5.3) | 120 (5.9) |
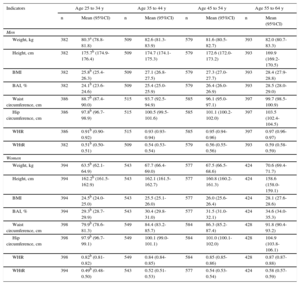
Weight, Height, Body Mass Index, Bbody Adiposity Index, Waist and Hip Circumferences, and Waist-to-hip Ratio and Waist-to-height Ratio Indexes in Men and Women According to Age Bracket
| Indicators | Age 25 to 34 y | Age 35 to 44 y | Age 45 to 54 y | Age 55 to 64 y | ||||
|---|---|---|---|---|---|---|---|---|
| n | Mean (95%CI) | n | Mean (95%CI) | n | Mean (95%CI) | n | Mean (95%CI) | |
| Men | ||||||||
| Weight, kg | 382 | 80.3a (78.8-81.8) | 509 | 82.6 (81.3-83.9) | 579 | 81.6 (80.5-82.7) | 393 | 82.0 (80.7-83.3) |
| Height, cm | 382 | 175.7b (174.9-176.4) | 509 | 174.7 (174.1-175.3) | 579 | 172.6 (172.0-173.2) | 393 | 169.9 (169.2-170.5) |
| BMI | 382 | 25.8b (25.4-26.3) | 509 | 27.1 (26.8-27.5) | 579 | 27.3 (27.0-27.7) | 393 | 28.4 (27.9-28.8) |
| BAI, % | 382 | 24.1b (23.6-24.6) | 509 | 25.4 (25.0-25.9) | 579 | 26.4 (26.0-26.9) | 393 | 28.5 (28.0-29.0) |
| Waist circumference, cm | 386 | 88.7b (87.4-90.0) | 515 | 93.7 (92.5-94.9) | 585 | 96.1 (95.0-97.1) | 397 | 99.7 (98.5-100.9) |
| Hip circumference, cm | 386 | 97.8b (96.7-98.9) | 515 | 100.5 (99.5-101.6) | 585 | 101.1 (100.2-102.0) | 397 | 103.5 (102.4-104.5) |
| WHR | 386 | 0.91b (0.90-0.92) | 515 | 0.93 (0.93-0.94) | 585 | 0.95 (0.94-0.96) | 397 | 0.97 (0.96-0.97) |
| WHtR | 382 | 0.51b (0.50-0.51) | 509 | 0.54 (0.53-0.54) | 579 | 0.56 (0.55-0.56) | 393 | 0.59 (0.58-0.59) |
| Women | ||||||||
| Weight, kg | 394 | 63.5b (62.1-64.9) | 543 | 67.7 (66.4-69.0) | 577 | 67.5 (66.5-68.6) | 424 | 70.6 (69.4-71.7) |
| Height, cm | 394 | 162.2b (161.5-162.9) | 543 | 162.1 (161.5-162.7) | 577 | 160.8 (160.2-161.3) | 424 | 158.6 (158.0-159.1) |
| BMI | 394 | 24.5b (24.0-25.0) | 543 | 25.5 (25.1-26.0) | 577 | 26.0 (25.6-26.4) | 424 | 28.1 (27.6-28.6) |
| BAI, % | 394 | 29.3b (28.7-29.9) | 543 | 30.4 (29.8-31.0) | 577 | 31.5 (31.0-32.1) | 424 | 34.6 (34.0-35.3) |
| Waist circumference, cm | 398 | 79.9b (78.6-81.3) | 549 | 84.4 (83.2-85.7) | 584 | 86.3 (85.2-87.4) | 428 | 91.8 (90.4-93.2) |
| Hip circumference, cm | 398 | 97.9b (96.7-99.1) | 549 | 100.1 (99.0-101.1) | 584 | 101.0 (100.1-102.0) | 428 | 104.9 (103.8-106.1) |
| WHR | 398 | 0.82b (0.81-0.82) | 549 | 0.84 (0.84-0.85) | 584 | 0.85 (0.85-0.86) | 428 | 0.87 (0.87-0.88) |
| WHtR | 394 | 0.49b (0.48-0.50) | 543 | 0.52 (0.51-0.53) | 577 | 0.54 (0.53-0.54) | 424 | 0.58 (0.57-0.59) |
95%CI, 95% confidence interval; BAI, body adiposity index; BMI, body mass index; WHR, waist-to-hip ratio; WHtR, waist-to-height ratio.
, body mass index and body adiposity index (B), and waist and hip circumferences (C) of men and women.")
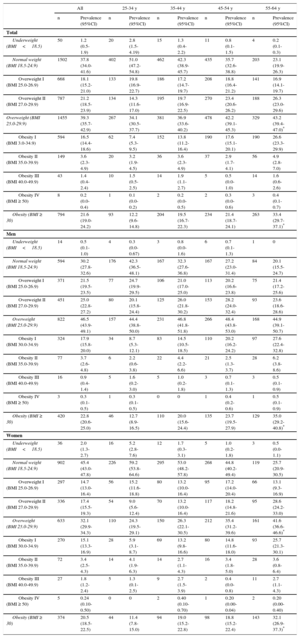
The prevalence of overweight (BMI, 25.0-29.9) estimated in the Spanish adult population aged 25 to 64 years was 39.3% (95%CI, 35.7%-42.9%), and was higher in men (46.5%; 95%CI, 43.9%-49.1%) than in women (32.1%; 95%CI, 29.9%-34.3%). The overall prevalence of obesity (BMI ≥ 30) was estimated at 21.6% (95%CI, 19.0%-24.2%), and was also higher in men (22.8%; 95%CI, 20.6%-25.0%) than in women (20.5%; 95%CI, 18.5%-22.5%) (Table 3). Both overweight and obesity were significantly higher with age in men and women, and in all age brackets analyzed, both rates were significantly higher in men than in women. The global prevalence of overweight was 60.9% (95%CI, 57.3%-64.5%) among the Spanish adult population aged 25 to 64 years, 69.3% (95%CI, 66.7%-71.9%) among men, and 52.6% (95%CI, 50.4%-54.8%) among women. The prevalence of BMI values ≥ 35 was estimated at 5.2% (95%CI, 3.9%-6.5%) and 6.9% (95%CI, 4.8%-9.0%) in the age bracket of 55 to 64 years.
Weight Classification of the Spanish Population Aged 25 to 64 Years (2014-2015) According to Age Bracket and Sex
| All | 25-34 y | 35-44 y | 45-54 y | 55-64 y | ||||||
|---|---|---|---|---|---|---|---|---|---|---|
| n | Prevalence (95%CI) | n | Prevalence (95%CI) | n | Prevalence (95%CI) | n | Prevalence (95%CI) | n | Prevalence (95%CI) | |
| Total | ||||||||||
| Underweight (BMI<18.5) | 50 | 1.2 (0.5-1.9) | 20 | 2.8 (1.5-4.19) | 15 | 1.3 (0.4-2.2) | 11 | 0.8 (0.1-1.5) | 4 | 0.2 (0.1-0.3) |
| Normal weight (BMI 18.5-24.9) | 1502 | 37.8 (34.0-41.6) | 402 | 51.0 (47.2-54.8) | 462 | 42.3 (38.9-45.7) | 435 | 35.7 (32.6-38.8) | 203 | 23.1 (19.9-26.3) |
| Overweight I (BMI 25.0-26.9) | 668 | 18.1 (15.2-21.0) | 133 | 19.8 (16.9-22.7) | 186 | 17.2 (14.7-19.7) | 208 | 18.8 (16.4-21.2) | 141 | 16.9 (14.1-19.7) |
| Overweight II (BMI 27.0-29.9) | 787 | 21.2 (18.5-23.9) | 134 | 14.3 (11.6-17.0) | 195 | 19.7 (16.9-22.5) | 270 | 23.4 (20.6-26.2) | 188 | 26.3 (23.0-29.6) |
| Overweight (BMI 25.0-29.9) | 1455 | 39.3 (35.7-42.9) | 267 | 34.1 (30.5-37.7) | 381 | 36.9 (33.6-40.2) | 478 | 42.2 (39.1-45.3) | 329 | 43.2 (39.4-47.0)* |
| Obesity I (BMI 3.0-34.9) | 594 | 16.5 (14.4-18.6) | 62 | 7.4 (5.3-9.5) | 152 | 13.8 (11.2-16.4) | 190 | 17.6 (15.1-20.1) | 190 | 26.6 (23.3-29.9) |
| Obesity II (BMI 35.0-39.9) | 149 | 3.6 (2.3-4.9) | 20 | 3.2 (1.9-4.5) | 36 | 3.6 (2.3-4.9) | 37 | 2.9 (1.7-4.1) | 56 | 4.9 (2.8-7.0) |
| Obesity III (BMI 40.0-49.9) | 43 | 1.4 (0.4-2.4) | 10 | 1.5 (0.5-2.5) | 14 | 1.9 (1.1-2.7) | 5 | 0.5 (0.0-1.0) | 14 | 1.6 (0.6-2.6) |
| Obesity IV (BMI ≥ 50) | 8 | 0.2 (0.0-0.4) | 1 | 0.1 (0.0-0.2) | 2 | 0.2 (0.0-0.5) | 2 | 0.3 (0.0-0.6) | 3 | 0.4 (0.1-0.7) |
| Obesity (BMI ≥ 30) | 794 | 21.6 (19.0-24.2) | 93 | 12.2 (9.6-14.8) | 204 | 19.5 (16.7-22.3) | 234 | 21.4 (18.7-24.1) | 263 | 33.4 (29.7-37.1)* |
| Men | ||||||||||
| Underweight (BMI<18.5) | 14 | 0.5 (0.1-1.0) | 4 | 0.3 (0.0-0.67) | 3 | 0.8 (0.0-1.6) | 6 | 0.7 (0.1-1.3) | 1 | 0 |
| Normal weight (BMI 18.5-24.9) | 594 | 30.2 (27.8-32.6) | 176 | 42.3 (36.5-48.1) | 167 | 32.3 (27.6-36.8) | 167 | 27.2 (23.0-31.4) | 84 | 20.1 (15.5-24.7) |
| Overweight I (BMI 25.0-26.9) | 371 | 21.5 (19.5-23.5) | 77 | 24.7 (19.9-29.5) | 106 | 21.0 (17.0-25.0) | 113 | 20.2 (16.6-23.8) | 75 | 21.4 (17.2-25.6) |
| Overweight II (BMI 27.0-29.9) | 451 | 25.0 (22.8-27.2) | 80 | 20.1 (15.8-24.4) | 125 | 26.0 (21.8-30.2) | 153 | 28.2 (24.0-32.4) | 93 | 23.6 (18.6-28.6) |
| Overweight (BMI 25.0-29.9) | 822 | 46.5 (43.9-49.1) | 157 | 44.4 (38.8-50.0) | 231 | 46.8 (41.8-51.8) | 266 | 48.4 (43.8-53.0) | 168 | 44.9 (39.1-50.7) |
| Obesity I (BMI 30.0-34.9) | 324 | 17.9 (15.8-20.0) | 34 | 8.7 (5.3-12.1) | 83 | 14.5 (10.5-18.5) | 110 | 20.2 (16.2-24.2) | 97 | 27.6 (22.4-32.8) |
| Obesity II (BMI 35.0-39.9) | 77 | 3.7 (2.6-4.8) | 6 | 2.2 (0.6-3.8) | 22 | 4.4 (2.2-6.6) | 21 | 2.5 (1.3-3.7) | 28 | 6.2 (3.8-8.6) |
| Obesity III (BMI 40.0-49.9) | 16 | 0.9 (0.4-1.4) | 5 | 1.6 (0.2-3.0) | 5 | 1.0 (0.2-1.8) | 3 | 0.7 (0.1-1.3) | 3 | 0.5 (0.1-0.9) |
| Obesity IV (BMI ≥ 50) | 3 | 0.3 (0.1-0.5) | 1 | 0.3 (0.1-0.5) | 0 | 0 | 1 | 0.4 (0.2-0.6) | 1 | 0.5 (0.1-0.9) |
| Obesity (BMI ≥ 30) | 420 | 22.8 (20.6-25.0) | 46 | 12.7 (8.9-16.5) | 110 | 20.0 (15.6-24.4) | 135 | 23.7 (19.5-27.9) | 129 | 35.0 (29.2-40.8)* |
| Women | ||||||||||
| Underweight (BMI<18.5) | 36 | 2.0 (1.3-2.7) | 16 | 5.2 (2.8-7.6) | 12 | 1.7 (0.3-3.1) | 5 | 1.0 (0.2-1.8) | 3 | 0.5 (0.0-1.1) |
| Normal weight (BMI 18.5-24.9) | 902 | 45.4 (43.0-47.8) | 226 | 59.2 (53.8-64.6) | 295 | 53.0 (48.2-57.8) | 268 | 44.8 (40.2-49.4) | 119 | 25.7 (20.9-30.5) |
| Overweight I (BMI 25.0-26.9) | 297 | 14.7 (13.0-16.4) | 56 | 15.2 (11.6-18.8) | 80 | 13.2 (10.0-16.4) | 95 | 17.2 (14.0-20.4) | 66 | 13.1 (9.3-16.9) |
| Overweight II (BMI 27.0-29.9) | 336 | 17.4 (15.5-19.3) | 54 | 9.0 (5.6-12.4) | 70 | 13.2 (10.0-16.4) | 117 | 18.2 (14.8-21.6) | 95 | 28.6 (24.2-33.0) |
| Overweight (BMI 25.0-29.9) | 633 | 32.1 (29.9-34.3) | 110 | 24.3 (19.5-29.1) | 150 | 26.3 (22.1-30.5) | 212 | 35.4 (31.2-39.6) | 161 | 41.6 (36.6-46.6)* |
| Obesity I (BMI 30.0-34.9) | 270 | 15.1 (13.3-16.9) | 28 | 5.9 (3.1-8.7) | 69 | 13.2 (9.8-16.6) | 80 | 14.8 (11.6-18.0) | 93 | 25.7 (21.3-30.1) |
| Obesity II (BMI 35.0-39.9) | 72 | 3.4 (2.5-4.3) | 14 | 4.1 (1.9-6.3) | 14 | 2.7 (1.1-4.3) | 16 | 3.4 (1.8-5.0) | 28 | 3.6 (0.8-6.4) |
| Obesity III (BMI 40.0-49.9) | 27 | 1.8 (1.2-2.4) | 5 | 1.3 (0.1-2.5) | 9 | 2.7 (1.5-3.9) | 2 | 0.4 (0.0-0.8) | 11 | 2.7 (1.1-4.3) |
| Obesity IV (BMI ≥ 50) | 5 | 0.24 (0.10-0.50) | 0 | 0 | 2 | 0.40 (0.10-0.70) | 1 | 0.20 (0.00-0.04) | 2 | 0.20 (0.00-0.40) |
| Obesity (BMI ≥ 30) | 374 | 20.5 (18.5-22.5) | 44 | 11.4 (7.8-15.0) | 94 | 19.0 (15.2-22.8) | 98 | 18.8 (15.2-22.4) | 143 | 32.1 (26.9-37.3)* |
95%CI, 95% confidence interval; BMI, body mass index.
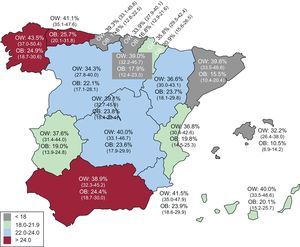
When considering the age-adjusted prevalence rates, the highest obesity rate was estimated to be in the Principality of Asturias (25.7%; 95%CI, 20.1%-31.8%) and in Galicia (24.9%; 95%CI, 18.7%-30.6%), followed by Andalusia (24.4%; 95%CI, 18.7%-30.0%), whereas the lowest rates were observed in the Balearic Islands (10.5%; 95%CI, 6.9%-14.2%), Catalonia (15.5%; 95%CI, 10.4%-20.4%), and the Basque Country (16.8%; 95%CI, 12.9%-21.6%) (Figure 2).
 in Spain. Age-adjusted rates. 95% confidence interval between parentheses. OB, obesity; OW, overweight.")
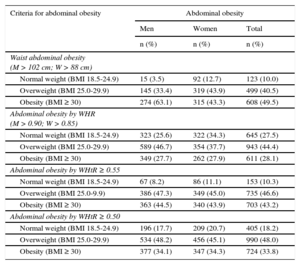
The prevalence of AO, defined using the cutoff points proposed by the WHO for WC (men, > 102 cm; women, > 88 cm), was estimated to be 33.4% (95%CI, 31.1%-35.7%) and was higher in women (43.3%; 95%CI, 41.1%-45.8%) than in men (23.3%; 95%CI, 20.9%-25.5%). These figures were much higher when the criterion used was WHR (men, > 0.9; women, > 0.85), being 64.5% (95%CI, 62.4%-66.6%). Figures were also higher when using the strict cutoff point of WHtR > 0.5, namely 69.7% (95%CI, 67.6%-71.8%). When the cut-off point was WHtR > 0.55, however, the estimate was 44.4% (95%CI, 42.1%-46.5%) (Table 4).
Prevalence of Abdominal Obesity Defined According to Different Criteria by Age Bracket and Sex. Spanish Population Aged 25 to 64 Years (2014-2015)
| Total | 25-34 y | 35-44 y | 45-54 y | 55-64 y | ||||||
|---|---|---|---|---|---|---|---|---|---|---|
| n (%) | 95%CI | n (%) | 95%CI | n (%) | 95%CI | n (%) | 95%CI | n (%) | 95%CI | |
| Total | ||||||||||
| Abdominal obesity Waist (M > 102 cm; W > 88 cm) | 1290 (33.4) | 31.1-35.7 | 147 (18.6) | 15.5-21.6 | 321 (29.5) | 26.4-32.7 | 424 (35.9) | 32.4-39.1 | 398 (48.1) | 44.1-51.7 |
| Abdominal obesity by WHR (M > 0.90; W > 0.85) | 2334 (64.5) | 62.4-66.6 | 351 (49.7) | 45.8-53.9 | 619 (62.8) | 59.4-66.2 | 757 (69.2) | 66.1-72.1 | 577 (74.2) | 71.1-77.5 |
| Abdominal obesity by WHtR (≥ 0.55) | 1725 (44.4) | 42.1-46.5 | 177 (23.6) | 20.5-27.1 | 383 (36.0) | 32.7-39.3 | 548 (49.4) | 46.2-52.7 | 527 (66.8) | 63.5-69.8 |
| Abdominal obesity by WHtR (≥ 0.50) | 2245 (69.7) | 67.6-71.8 | 300 (47.7) | 43.9-51.6 | 548 (62.0) | 58.7-65.3 | 713 (75.6) | 72.6-78.4 | 623 (90.3) | 87.9-92.7 |
| Men | ||||||||||
| Abdominal obesity Waist (M > 102 cm) | 459 (23.3) | 20.9-25.5 | 44 (11.5) | 8.0-15.5 | 117 (20.8) | 16.4-25.3 | 165 (27.5) | 23.0-32.5 | 133 (31.7) | 25.7-37.1 |
| Abdominal obesity by WHR (M > 0.90) | 1314 (75.9) | 73.7-78.1 | 210 (59.6) | 53.9-65.0 | 357 (74.0) | 69.7-78.4 | 439 (83.0) | 79.2-86.7 | 308 (84.6) | 80.7-88.3 |
| Abdominal obesity by WHtR (≥ 0.55) | 838 (45.6) | 43.2-48.1 | 84 (22.6) | 17.3-27.9 | 194 (35.9) | 31.1-40.8 | 299 (54.5) | 50.1-59.2 | 261 (67.6) | 63.2-71.9 |
| Abdominal obesity by WHtR (≥ 0.50) | 1143 (76.4) | 74.1-78.5 | 163 (56.4) | 50.7-61.9 | 285 (66.2) | 61.5-70.7 | 389 (85.5) | 81.6-89.3 | 306 (94.5) | 91.5-97.3 |
| Women | ||||||||||
| Abdominal obesity Waist (W > 88 cm) | 831 (43.3) | 41.1-45.8 | 103 (25.5) | 21.1-30.1 | 204 (38.6) | 34.3-43.3 | 259 (45.0) | 40.5-49.5 | 265 (62.0) | 57.1-67.2 |
| Abdominal obesity by WHR (W > 0.85) | 990 (53.5) | 51.2-56.0 | 141 (40.1) | 35.2-45.2 | 262 (51.1) | 46.6-55.8 | 318 (54.8) | 50.2-59.2 | 269 (66.4) | 61.5-71.3 |
| Abdominal obesity by WHtR (≥ 0.55) | 797 (43.3) | 41.0-45.9 | 93 (24.5) | 19.8-29.0 | 189 (36.1) | 31.7-40.4 | 249 (43.8) | 39.4-48.2 | 266 (66.0) | 61.2-71.1 |
| Abdominal obesity by WHtR (≥ 0.50) | 1041 (63.6) | 61.1-65.6 | 137 (40.2) | 34.9-45.2 | 263 (58.0) | 53.4-62.7 | 324 (65.2) | 60.9-69.4 | 317 (87.1) | 82.9-91.1 |
95%CI, 95% confidence interval; M, men; W, women; WHR, waist-to-hip ratio; WHtR, waist-to-height ratio.
A total of 49.5% of persons classified with AO based on WC had BMI ≥ 30, and 40.5% had values consistent with overweight (25.0 and 29.9). This distribution pattern was similar to that observed when AO was defined as WHtR > 0.55: 43.2% with BMI ≥ 30 and 46.6% with BMI 25.0 to 29.9. However, when the criterion used to define AO was WHR, 28.1% of persons classified with AO had BMI ≥ 30, 44.4% had BMI 25.0 to 29.9, and 27.5% had BMI < 25 (Table 5).
Frequency of Abdominal Obesity, Defined by Different Criteria, in Men and Women According to Weight Type Category
| Criteria for abdominal obesity | Abdominal obesity | ||
|---|---|---|---|
| Men | Women | Total | |
| n (%) | n (%) | n (%) | |
| Waist abdominal obesity (M > 102 cm; W > 88 cm) | |||
| Normal weight (BMI 18.5-24.9) | 15 (3.5) | 92 (12.7) | 123 (10.0) |
| Overweight (BMI 25.0-29.9) | 145 (33.4) | 319 (43.9) | 499 (40.5) |
| Obesity (BMI ≥ 30) | 274 (63.1) | 315 (43.3) | 608 (49.5) |
| Abdominal obesity by WHR (M > 0.90; W > 0.85) | |||
| Normal weight (BMI 18.5-24.9) | 323 (25.6) | 322 (34.3) | 645 (27.5) |
| Overweight (BMI 25.0-29.9) | 589 (46.7) | 354 (37.7) | 943 (44.4) |
| Obesity (BMI ≥ 30) | 349 (27.7) | 262 (27.9) | 611 (28.1) |
| Abdominal obesity by WHtR ≥ 0.55 | |||
| Normal weight (BMI 18.5-24.9) | 67 (8.2) | 86 (11.1) | 153 (10.3) |
| Overweight (BMI 25.0-9.9) | 386 (47.3) | 349 (45.0) | 735 (46.6) |
| Obesity (BMI ≥ 30) | 363 (44.5) | 340 (43.9) | 703 (43.2) |
| Abdominal obesity by WHtR ≥ 0.50 | |||
| Normal weight (BMI 18.5-24.9) | 196 (17.7) | 209 (20.7) | 405 (18.2) |
| Overweight (BMI 25.0-29.9) | 534 (48.2) | 456 (45.1) | 990 (48.0) |
| Obesity (BMI ≥ 30) | 377 (34.1) | 347 (34.3) | 724 (33.8) |
BMI, body mass index; M, men; W, women; WHR, waist-to-hip ratio; WHtR, waist-to-height ratio.
The ENPE study estimated prevalences of overweight of 39.3% and general obesity of 21.6% in the Spanish adult population aged 25 to 64 years. These data are consistent with the estimates obtained in the ENRICA study for 2008-2010,20 a study which estimated a prevalence of 22.9% for obesity in the Spanish population older than 18 years. In contrast, a significant rise in overweight was observed in the Spanish adult population compared with the data reported by the DORICA study in 2003,19 which estimated prevalences of obesity of 15.5% and overweight (BMI, 25.0-29.9) of 39.2% in the population aged 25 to 64 years.
Like the ENRICA and the ENPE studies, the DORICA study observed an upward trend in overweight and obesity rates with age. However, the ENPE study estimated significantly higher obesity rates in men than women, whereas the opposite trend was seen in the DORICA study, revealing a change in the distribution pattern. The ENRICA study also observed higher rates in men than in women in all age brackets except women older than 65 years, a bracket not included in this ENPE study analysis. The latest Health Survey (ENSA) data34 also indicate this trend, although the ENSA study estimated the prevalence of overweight and obesity from self-reported data rather than individual height and weight measurements. Likewise, the last decade has seen an increase in obesity among men in other countries, such as Finland14 and Portugal.35
The prevalence of obesity in the adult population in Spain is lower than the rates estimated for the United States, a country where the prevalence of obesity (BMI ≥ 30) in the population older than 20 years (2011-2012)36 is 35.1%, although the authors of this analysis point out that these rates are now steady, with no significant changes between 2003-2004 and 2011-2012 in that country.
The highest prevalence rates of obesity in adult populations are estimated to be found in countries located in the Middle East and the Persian Gulf.37,38 In countries such as Saudi Arabia, the prevalence of obesity is 50.4% among women aged 25 to 64 years (2005) and 31.5% among men. In Mexico,39 the prevalence of obesity is estimated at 37.5% (2012) among women aged 20 years or older and 26.5% among men, whereas in New Zealand (2013-2014),37 it is estimated at 30.2% of women and 29.6% of men. In Europe, 2013 data for the United Kingdom37,40 indicate a prevalence of obesity among women aged 16 years or older at 28.3% (26% among men) and 2008-2011 data for Germany41 indicate 23.9% among women and 23.2% among men aged 18 to 79 years.
The DORICA study19 observed a trend toward higher obesity prevalence levels toward the south, with the highest estimates seen in the Canary Islands, Andalusia and the Region of Murcia, and the lowest in Catalonia and the Basque Country. Studies in other population groups, such as the enKid study,42 conducted in a population aged 2 to 24 years, have seen a similar distribution pattern in overweight. In the ENPE study, the highest figures were estimated in the Principality of Asturias and in Galicia, followed by Andalusia and the Region of Murcia, whereas the prevalence in the Canary Islands appears to have stabilized at 20.1%. This geographic distribution pattern is similar to that described in the ENRICA study20 and to those of other recent studies conducted in school children, such as PERSEO,43 ALADINO,44 and a study performed by Sánchez-Cruz et al.45
The prevalence of AO in the adult population in Spain is high, rises with age, and is higher in women than in men. Different indicators and distinct cutoff points have been proposed to define AO, depending on the result of the disease investigated: DM, cardiovascular disease, or others. The ENRICA study20 used WC (cutoff points > 102 cm in men and > 88 cm in women) to estimate the prevalence of AO at 35.5%, although it was as high as 43% among persons aged 45 to 64 years and 61.6% among persons aged ≥ 65 years. As in the ENPE study, AO was higher among women than men. The prevalence of AO in adults aged ≥ 20 years was estimated using the same criteria at 54.2% in the United States (2011-2012)46 and 38% in United Kingdom (2009).47
The ROC (receiver operating characteristic) curve-based sensitivity and specificity analysis performed in the DORICA study48 estimated that the risk of the presence of cardiovascular risk factors for WC values of 80 cm in women and 88 cm in men was comparable to the risk with BMI = 25, and for WC values of 88 cm in women and 98 cm in men, similar to BMI = 30.
Strengths and LimitationsThe strengths of the ENPE study include its performance in a representative random sample of the Spanish population, ensuring 400 interviews in each autonomous community and obtaining a sampling error of 4.89%. The procedure to recruit the sample allowed us to achieve the desired sample size, which ensures randomization, as fixed quotas were established in proportion to the distribution of the Spanish population. The estimates were computed by weighting the sample, and all rates were age-adjusted using the direct method to calculate prevalence by autonomous community. All data were collected by individual measurements of weight, height, and circumferences. In addition, considerable care was taken with the study protocol, with measurement equipment selection and calibration, and with interviewer training, while also establishing quality controls throughout the entire process.
One of the limitations is the cross-sectional design, which allowed prevalence to be estimated as reported in this article, but did not establish causality relationships with other factors.
CONCLUSIONSThe prevalence of general obesity and AO in Spain is high, although its distribution is uneven among the various autonomous communities. A comparison with earlier data reveals a large increase in overweight, which appears to have stabilized, according to recent estimates. This indicates a need for better routine monitoring, especially in high-risk groups, as well as a need to implement general preventive strategies targeting the entire population, and specific health care actions for affected individuals.
FUNDINGThe ENPE study was funded by the Eroski Foundation through an agreement with SPRIM and the Spanish Society of Community Nutrition (SENC). The sponsor was not involved in the study design, data collection, analysis or interpretation of the results, manuscript preparation, or the decision to publish the results.
CONFLICTS OF INTERESTS. Lázaro-Masedo and N. Ramos-Carrera are affiliated with SPRIM, which has carried out consulting activities for Fundación Eroski.
The authors would like to express their appreciation for the technical and logistic support of the SIGMA DOS company, the technical support provided by SPRIM-España, the sponsorship of the Eroski Foundation and, most specially, the work undertaken by the field professionals and the kind cooperation of the people who agreed to participate in the study.