Keywords
The treatment of ST segment elevation acute myocardial infarction (STEAMI) has focused on opening the coronary artery.1-3 Nevertheless, patency of the artery does not guarantee adequate tissue perfusion; in fact, up to 30% of patients with apparently normal epicardial flow (Thrombolysis In Myocardial Infarction [TIMI] grade 3) have inadequate tissue perfusion as a consequence of injury to the microcirculation.4-6
Although angiography is highly effective for identifying cases of clearly compromised microcirculation (TIMI<3),7 its usefulness in patients with TIMI 3 flow is more controversial. Myocardial blush is an angiographic index created to assess the status of myocardial perfusion, although there are uncertainties as to the reliability and variability of its measurement.8
The primary objective of this study was to determine the variability of myocardial blush measurement between 2 independent centers: the cardiac catheterization laboratory of a teaching hospital and a catheterization core laboratory. The secondary objectives were to assess the correlation between myocardial blush analyzed in the core laboratory with myocardial perfusion analyzed by myocardial contrast echocardiography and with ventricular function at 6 months, as determined by cardiac magnetic resonance (CMR).
METHODS
Study Group
Sixty consecutive patients with a first STEAMI treated by thrombolysis within the first 6 h after the onset of pain were assessed for eligibility for the study. The inclusion criteria were as follows: a) single-vessel disease with an open infarct-related artery, defined as TIMI 3 flow and residual stenosis <50% on angiography (or angioplasty) performed before discharge; b) stable clinical course without complications during the first 6 months of follow-up; c) persistently open infarct-related artery (TIMI 3 flow and residual stenosis <50%) on angiography performed at 6 months; and d) absence of contraindications for the practice of a CMR study at 6 months. Among the 60 initial patients, 20 were excluded because of multivessel disease (9 patients), TIMI flow <3 (2 patients), quality of the angiographic image insufficient to assess blush (1 patient), reinfarction during follow-up (1 patient), restenosis at 6 months (5 patients), and claustrophobia (2 patients). The final study group was comprised of 40 patients.
The study protocol met the criteria of the Declaration of Helsinki and was approved by the ethics committee of our hospital. All patients enrolled gave informed consent for participation in the study.
Cardiac Catheterization
Angiography was performed within a median of 5 days following the STEAMI (total range, 3-7 days). In patients with >50% stenosis or occlusion of the culprit artery, angioplasty with stent implantation was performed (30 cases, 75%). Rescue angioplasty was undertaken in 3 patients (8%) because of an absence of electrocardiographic criteria of reperfusion. Angiography was repeated before discharge in these patients and the data used for the study were taken from the pre-discharge catheterization. At the end of the procedure, all patients showed a residual stenosis of <50% and TIMI 3 flow.
The infarct-related vessel was the left anterior descending artery in 28 patients (70%) and the right coronary artery in 12 patients (30%). None of the patients in whom the culprit vessel was the circumflex artery met the inclusion criteria for the study.
A standardized protocol was used to ensure consistency of the measures: all angiograms were recorded at 12.5 images per second, the contrast injector used (Acist Medical Systems CMS2000, USA) was set at a constant infusion rate of 4 mL/s for the left anterior descending artery (8-mL boluses) and 3 mL/s for the right coronary artery (6-mL boluses). The right caudal view was used as the first option for assessing the left coronary artery, whereas left views were used for the right coronary; when required, other views were used in which the individual analysis of the culprit artery was optimal. Long angiographic sequences (up to the venous phase) were performed. Intravenous nitroglycerin was administered prior to the view analyzed, except in patients with hypotension (systolic arterial pressure <90 mm Hg).
Myocardial blush assesses the status of the microcirculation by determining the density of contrast in the myocardial territory irrigated by the culprit artery. Blush grades are defined as follows: 0, absence of blush or contrast density; 1, minimal contrast density; 2, moderate contrast density, but less that that obtained with angiography of a contralateral or ipsilateral artery unrelated to the infarct; and 3, normal contrast density, comparable to that obtained with angiography of a contralateral or ipsilateral artery unrelated to the infarct. Cases in which there was a persistence of contrast density in the following view were interpreted as contrast leakage into the extravascular space and were assigned the score of 0.9 Assessment of blush was done in the subacute phase (median 5 days, between 3 and 7) in all cases.
The angiography studies were evaluated at 2 independent centers by experienced interventional cardiologists in both cases. The observers were blinded to the remaining clinical information. Laboratory 1 (Lab 1) is the institution that carried out the study, the catheterization laboratory of a teaching hospital, and laboratory 2 (Lab 2) is an independent catheterization core laboratory with extensive experience in the measurement of the myocardial blush index. Grades 2 and 3 were considered normal perfusion.10 Variability was also determined considering only grade 3 blush to be normal perfusion. The quantitative analysis was carried out with the Philips Integris HM-3000 digital system (Holland) in Lab 1 and the BlushPlus 2004 computer program from Sanders Data System (USA) in Lab 2.
The interobserver variability was 10% for the detection of grades 2 and 3 blush and 20% for grade 3 blush in Lab 1, and 13% and 15%, respectively, in Lab 2.
Myocardial Contrast Echocardiography
Immediately following acquisition of the angiographic views (from the pre-discharge catheterization), MCE was undertaken according to a previously described protocol.11-14 A division into 17 segments was established15 and a quantitative perfusion score was assigned to the segments corresponding to the territory of the infarction (or risk area), using the MATLAB 6.5 program11 (The Mathworks Inc., Natick, Massachusetts, USA), with a normalized videointensity scale between 0 (absence of perfusion) and 1 (normal perfusion). In keeping with our previous data,12,13 a study was considered normal when the mean perfusion score in the area of the infarction was >0.75. Based on our experience11-14 and previous data,16 MCE was considered the reference technique for the perfusion analysis.
Interobserver variability for the detection of normal perfusion according to the criteria defined for MCE was 4%.14
Cardiac Magnetic Resonance
In all cases, CMR (Sonata 1.5 T, Siemens, Germany) was performed at 6 months at an independent site, with the staff blinded to the patients' clinical and angiographic data. Images were acquired with a surface coil, in prospective cardiac synchronism and breath holding. Cine functional sequences (True Fast Imaging with Steady-state Precession) were obtained in several planes along the left ventricle. The ejection fraction was calculated by manual tracing of the end-diastolic and end-systolic contours in various areas of the short axis in the cine sequences (with a 6-mm slice thickness) using the Medis QMASS MR 6.1.517 software.
Absolute interobserver variability for the ejection fraction was 3%±2%.14
Statistical Analysis
Continuous variables were expressed as the mean ± standard deviation and compared by Student's t test for unpaired data. Categorical values were expressed as percentages of the study population and compared by the χ² test.
The intraclass correlation coefficient and the kappa index for the determination of myocardial blush were calculated between the 2 participating centers. The Bland-Altman graphs are shown. Perfusion assessed by blush determination in the core laboratory was correlated with perfusion assessed by MCE and with the ejection fraction at 6 months following the infarction, by calculation of Spearman's correlation coefficient.
All calculations were performed with SPSS 9.0 (Chicago, USA). P-values <.05 were considered statistically significant.
RESULTS
The baseline characteristics of the study sample are shown in Table 1.

The maximum ST segment elevation in the first ECG was 6±3.4 mm and the mean elevation was 3.6±2.2 mm. Maximum elevation at 90 min after thrombolysis was 2.5±1.9 mm (P<.0001 vs the first ECG) and the mean elevation was 1.6±2 mm (P<.0001 vs the first ECG). The percentage of maximum ST segment elevation resolution at 90 min was 52%±35% and the percentage of mean ST elevation resolution was 49%±64%.
The mean ejection fraction was 48%±12% at the first week and 52%±13% at the sixth month (P=.007 vs the first week). Residual stenosis was 87%±15% at the initial examination and 11%±26% after catheterization (and angioplasty, when performed) (P<.0001 vs initial).
Using the criteria of grade 2-3 myocardial blush as normal, 31 patients (78%) in both centers were classified as having normal perfusion, whereas on the basis of grade 3 blush as normal, 23 patients (57%) were classified as having normal perfusion in Lab 1 and 27 (67%) in Lab 2 (Table 2).

Mean myocardial blush values obtained were 2.2±1.1 in Lab 1 and 2.4±1 in Lab 2. There were no differences in blush results between anterior infarcts and inferior infarcts (2.5±0.9 vs 2.2±0.9; P=.3); nevertheless, the MCE score was lower in anterior infarcts (0.75±0.27 vs 0.96±0.1; P=.01), in accordance with previous data indicating better perfusion in inferior infarcts as compared to anterior infarcts.
The corrected TIMI frame count was 20.5±6.3 in Lab 1 and 22.4±9.7 in Lab 2.
Variability in the Measurement
The correlation between the results from the 2 catheterization laboratories was weak (intraclass correlation coefficient, r=0.38; P=.006). Agreement in the assessment of myocardial blush at grade 2-3 was 80%, yielding a kappa index of 0.43. When normal blush was established at grade 3, agreement was 55%, with a kappa index of 0.1 (Figure 1; Table 2). Mean variation in the blush grade between Lab 1 and Lab 2 was 0.72±0.88 (percent variation: 41%±57%).

Figure 1. Bland-Altman plot showing scatter between the 2 laboratories for blush assessment. Lab 1 indicates laboratory 1; Lab 2, laboratory 2; SD, standard deviation.
Correlation Between Perfusion Assessed by Myocardial Blush and Perfusion Assessed by Myocardial Contrast Echocardiography
Fourteen patients (34%) were found to have inadequate myocardial perfusion by MCE. Myocardial blush evaluated at the core laboratory did not show a significant correlation with perfusion assessed by MCE (r=0.23; P=.2 for grade 2-3 blush).
Implications of the Angiographic Data for Systolic Function
A significant positive correlation was found between the ejection fraction at 6 months calculated by CMR and the grade of myocardial perfusion calculated by MCE (r=0.67; P<.0001); nevertheless, no such correlation was found with perfusion calculated by myocardial blush at the core laboratory (r=0.20; P=.3 for grade 2-3 blush) (Figure 2).

Figure 2. Relationship of myocardial perfusion measured by MCE or by myocardial blush (in the core laboratory) with 6-month ejection fraction, analyzed by CMR. MCE indicates myocardial contrast echocardiography at 6 months; 6-m EF, ejection fraction at 6 months; CMR, cardiac magnetic resonance
DISCUSSION
Previous studies have confirmed the prognostic relevance of reperfusion in STEAMI.1-3 Even though a patent coronary artery with TIMI 3 flow appears to be essential for adequate perfusion, this prerequisite does not guarantee proper perfusion. Therefore, additional methods are needed to determine the status of the microcirculation.9,10
In our assessment of myocardial blush we observed: a) considerable variability between the measurements made to identify grade 3 blush in a teaching hospital and those made in an independent core lboratory; b) a weak correlation with MCE; and c) a weak correlation with the late ejection fraction.
Variability of the Measurement
In the analysis of the group of patients with a first STEAMI and an open culprit artery, the correlation between the assessments made in the 2 participating centers was significant, but weak. These data are in line with a subjective perception detected in many catheterization laboratories: although the analysis of myocardial blush is of great interest to determine the status of perfusion beyond TIMI flow (found to be highly useful in large studies), the considerable variability we found between measurements made in a hospital-based catheterization laboratory with respect to a core laboratory should be taken into consideration.
Abnormal perfusion values are much more frequent in the patient population with TIMI flow <3,9,16 a fact that results in a higher correlation between measurements from different observers in large patient series that include various TIMI grades. In the published studies on myocardial blush, the apparent facility to exclude normal perfusion in patients with TIMI 1 or 2 flow results in higher interobserver agreement in heterogeneous groups than that found in patients with exclusively TIMI 3 flow. This is illustrated in the article by van't Hof et al,9 in which 98% of patients with grade 2 or 3 myocardial blush had TIMI 3 flow.
Our results demonstrate an acceptable agreement in the differentiation between grade 2-3 blush and 0-1 blush (80%). This phenomenon (greater agreement when the combination of moderate and severe grades is considered) has also been seen in other visual estimations, such as valvular regurgitation determined by echocardiography or angiography.18 Nevertheless, the agreement obtained for grade 3 blush (patients with a favorable prognosis)7 was weak (55%).
This weak agreement in the measurement of angiographic indexes has recently been reported for other angiographic parameters that are apparently simpler to quantify (e.g., percentage of stenosis).19
Currently the study of myocardial blush is mainly focused on multicenter efforts in which the angiograms are analyzed in specialized core laboratories. The more limited experience of a hospital catheterization laboratory may have been the reason for the lower agreement found in the present study. Our results reinforce the need to analyze myocardial blush in independent core laboratories. It might be advisable to group grades 2 and 3 as normal perfusion to reduce the variability.20
Correlation With Myocardial Contrast Echocardiography
Myocardial contrast echocardiography allows precise assessment of perfusion (Figure 3) and has proven to be useful in predicting remodeling and systolic recovery.21 This technique is indicated as a reference method for the perfusion study,11,13,16 although its invasive nature has limited its use and popularity among specialists in echocardiography. We attribute the poor correlation between myocardial blush and MCE to the following: a) angiography can produce false positive findings because opacification of areas with adequate perfusion may mask areas with perfusion alterations, making it difficult to separate the territories irrigated by an artery into segments, whereas the study of segments by MCE is simpler; and b) false negatives can occur because of the difficulties inherent to visual assessment, particularly in the anterior territory. In fact, our results did not show differences in perfusion as measured by myocardial blush between anterior and inferior infarcts, whereas the analysis by MCE demonstrated poorer perfusion of infarcted segments in the anterior territory.

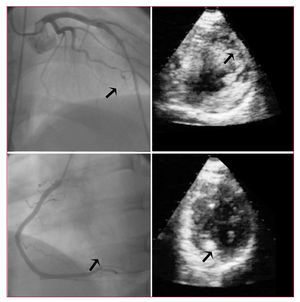
Figure 3. Angiographic and myocardial contrast echocardiographic images from 2 patients in the study group. In the upper panel, images from a patient with an anterior infarct, TIMI 3 flow in the left anterior descending artery (arrow), and an anterior perfusion deficit by echocardiography (arrow). In the lower panel, a patient with an inferior infarction, TIMI 3 flow in the right coronary artery (arrow), and normal perfusion in the area of the infarct (arrow).
Relationship With Ejection Fraction at 6 Months
The status of myocardial microcirculation is closely related with recovery of systolic function in cases where it is intact and with ventricular remodeling in cases where it is affected.22 In the present study, perfusion assessment by myocardial blush immediately following angioplasty (or at completion of catheterization in nontherapeutic cases) was not significantly related with late systolic function independently evaluated by CMR. Perfusion estimation in later phases of infarction might yield a better correlation,23 although it should be remembered that MCE was performed at the same time as catheterization and did provide a reliable prediction of the ejection fraction.
These data might indicate that in a patients with clear TIMI 3 flow we should seek alternative (or complementary) indexes to myocardial blush as a reference standard for perfusion.
Limitations
1. The main limitation of the study is the small number of patients included. Enrollment was difficult because of the strict patient selection criteria and the need to perform additional tests other than those used in daily clinical practice.
2. Another aspect that should be mentioned is the fact that our study is not focused on assessing perfusion following a primary angioplasty, but instead on the subacute phase, whereas in most studies analyzing myocardial perfusion, angiography is done from 60 to 90 min after administration of the thrombolytic agent. Nevertheless, these differences should not affect the variability in the measurements among different observers. As has been mentioned, this factor should also not affect prediction of the late ejection fraction by MCE.
3. The use of different software while performing the measurements is likely to have had an influence on the final results; in any case, this is inevitable in daily practice when comparing the results from different sites.
4. For the quantitative assessment of the angiographic parameters, it would have been interesting to quantify perfusion according to TIMI myocardial perfusion grades because it is an extensively validated measure; in our case, the estimation was done using TIMI frame counts.
CONCLUSIONS
Following STEAMI, angiography-documented TIMI grade provides the best index for the analysis of perfusion. The myocardial blush index has proved to be useful in several multicenter studies to better define the status of perfusion. Our results indicate that in patients with clear TIMI 3 flow, there is considerable variability between a hospital-based catheterization laboratory and a core laboratory. The use of myocardial blush grades 2 and 3 to define normal status reduces this variability, but, in any case, it seems advisable to perform this analysis in highly experienced catheterization core laboratories. The low correlation found between late systolic function and perfusion analyzed by MCE indicates the need to a move toward angiographic evaluation of the microcirculation by quantitative analysis, validated in independent core laboratories, or to consider the use of alternative methods.
This work was financed by the Spanish Society of Cardiology with the grant Bayer 2004 and with Fhe the grant GRUPOS0442 of the Generalitat Valenciana.
Correspondence:
Dr. V. Bodí Peris.
Servicio de Cardiología. Hospital Clínico Universitario.
Blasco Ibáñez, 17. 46010 Valencia. España.
E-mail: vicentbodi@hotmail.com
Received October 27, 2005. Accepted for publication March 2, 2006.