To help to illustrate the trends in isolated surgical aortic valve replacement (SAVR) in Spain, we performed a national-level analysis to investigate the changes from 1998 to 2017 in a) SAVR volume, b) patients’ risk profiles, c) in-hospital mortality, and d) types of aortic valve prostheses.
MethodsWe included all episodes of patients undergoing isolated SAVR from January 1998 to December 2017 recorded in the Minimum Basic Data Set (Ministry of Health, Consumer Affairs, and Social Welfare, Spain). The study duration was divided into four 5-year periods. We analyzed the trends in SAVR volume, comorbidity prevalence, and in-hospital mortality. Through multivariate logistic regression, we identified factors associated with mortality and type of prosthesis. The risk-adjusted mortality rate was compared over the study period.
ResultsIn total, 73 668 patients underwent an isolated SAVR from 1998 to 2017. The annual volume of procedures increased from 16 363 between 1998 and 2002 to 22 685 between 2013 and 2017. The prevalence of all investigated comorbidities increased, except for history of previous myocardial infarction and unplanned admission. The Charlson comorbidity index worsened from 1998-2002 (2.3; SD, 1.4) to 2013-2017 (3.6; SD, 1.7) (P <.001). In-hospital mortality decreased from 7.2% to 3.3% (P <.001) while the risk-adjusted mortality index improved from 1.3 to 0.7. The proportion of bioprostheses increased from 20.7% (1998-2002) to 59.6% (2013-2017) (P <.001).
ConclusionsWe detected an increase in the annual SAVR volume in Spain, with more patients receiving bioprostheses. Despite an increased risk profile of the patients, in-hospital mortality substantially reduced.
Keywords
Because it ameliorates symptoms and improves life expectancy, surgical aortic valve replacement (SAVR) is a class I indication for the treatment of severe aortic stenosis and regurgitation1 when symptomatic or with associated left ventricle dysfunction. Several registries investigating trends in SAVR in other countries2–5 have been reported. This information is valuable to illustrate the changes over time in clinical practice at a national level.
Spain has no national patient-level clinical registries specifically dedicated to SAVR. The Spanish Society of Thoracic and Cardiovascular Surgery annually reports the activity of hospitals across the country6 but submission of information is voluntary and the data are aggregated and not audited. On the other hand, the medical centers of the Spanish National Health System (NHS) send information from discharge reports for every single clinical episode to the registry of the Minimum Basic Data Set (MBDS) of the National Department of Health. This database contains anonymized data, coded according to ICD-9 and -10. Although the use of such nondedicated administrative data sources for the analysis of indicators in cardiac surgery is controversial,7 different studies based on the MBDS have validated its usefulness in evaluating clinical processes8–12 in Spain.
Thus, we studied the changes in SAVR in our country from 1998 to 2017 based on the information obtained from the MBDS of the Spanish Department of Health to understand the changes in clinical practice over time. More specifically, we investigated a) the trends in the volume of SAVR procedures, b) in-hospital mortality and its predictors, and c) the factors associated with the type of prosthesis (mechanical vs biological).
METHODSInformation sources and patient selectionRecords of all episodes between 1998 and 2017 were retrieved from the MBDS. These records had to include ICD-9 procedural codes 35.21 or 35.22 or ICD-10 codes 02RF07Z, 02RF08Z, 02RF0KZ, 02RF47Z, 02RF48Z, 02RF4KZ, X2RF032, X2RF432, 02RF0JZ, or 02RF4JZ.
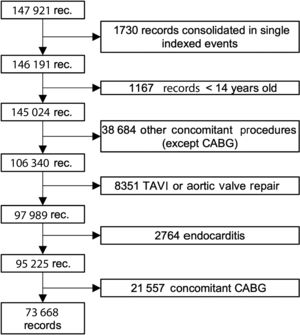
We then excluded all patients who had undergone any other major cardiac procedure during the same admission (operations on other valves, thoracic great vessel repair, or coronary artery bypass grafting). Also not considered were patients younger than 18 years of age and those who had undergone any congenital defect repair. We additionally excluded patients who had undergone a transcatheter aortic valve implantation (TAVI), valvuloplasty, or aortic valve repair or those who had endocarditis. TAVI was excluded by eliminating all records with ICD-9 codes 35.05 and 35.06 or ICD-10 codes 02RF37Z, 02RF38Z, 02RF3JZ, 02RF3KZ, X2RF332, 02RF37H, 02RF38H, 02RF3JH, or 02RF3KH after 2013 and those who had received an aortic tissue valve (code 35.22) without extracorporeal circulation (code 39.61) before 2014 (in 2014, the specific coding for TAVI was included in the ICD-9). Given that it is not possible to differentiate between bioprostheses and aortic homografts in the ICD-9, we considered both to be bioprostheses for the purposes of this study. Nonetheless, the proportion of homografts coded as bioprostheses should be small because endocarditis has been excluded and homografts are uncommonly implanted in Spain for any other indication.13 The patient selection algorithm is shown in figure 1.

The first admission of a patient during the study period was considered the index event and the concatenated episodes of transfer between hospitals were considered a single event with an admission date equal to that of the first concatenated episode and a discharge date equal to that of the last.12
The full period of time (1998-2017) was divided into four 5-year intervals (1998-2002, 2003-2007, 2008-2012, and 2013-2017). Comorbidities, mortality, and type of aortic valve prosthesis were analyzed according to the time interval.
National volume of surgical aortic valve replacement procedures and patients’ risk profileTo estimate the number of SAVRs per million inhabitants per year, we used the Spanish population reported by the Spanish National Institute of Statistics.14 Hospitals performing SAVR were classified according to the distribution of the mean volume of interventions per year in each period (low-volume centers if their mean number of interventions/y in a period was in quartile 1, intermediate–low-volume centers if their mean number of interventions/y in a period was in quartile 2, and so on) (figure 1 of the supplementary data).
Patients were classified into 4 groups according to age (≤ 60, 60-70, 70-80, and> 80 years). In these groups, we analyzed the trends in the prevalence of various comorbidities (table 1). The age-modified Charlson comorbidity index was calculated,15,16 and the population was divided into 4 groups according to quartile. Predictors of mortality, variabilities in mortality, and trends in risk-adjusted mortality were investigated throughout the study period.
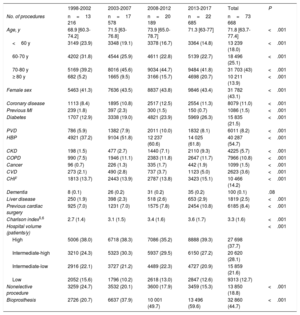
Variations in comorbidities during the study period
| 1998-2002 | 2003-2007 | 2008-2012 | 2013-2017 | Total | P | |
|---|---|---|---|---|---|---|
| No. of procedures | n=13 216 | n=17 578 | n=20 189 | n=22 685 | n=73 668 | |
| Age, y | 68.9 [60.3-74.2] | 71.5 [63-76.8] | 73.9 [65.0-78.7] | 71.3 [63-77] | 71.8 [63.7-77.4] | <.001 |
| <60 y | 3149 (23.9) | 3348 (19.1) | 3378 (16.7) | 3364 (14.8) | 13 239 (18.0) | <.001 |
| 60-70 y | 4202 (31.8) | 4544 (25.9) | 4611 (22.8) | 5139 (22.7) | 18 496 (25.1) | <.001 |
| 70-80 y | 5169 (39.2) | 8016 (45.6) | 9034 (44.7) | 9484 (41.8) | 31 703 (43) | <.001 |
| ≥ 80 y | 682 (5.2) | 1665 (9.5) | 3166 (15.7) | 4698 (20.7) | 10 211 (13.9) | <.001 |
| Female sex | 5463 (41.3) | 7636 (43.5) | 8837 (43.8) | 9846 (43.4) | 31 782 (43.1) | <.001 |
| Coronary disease | 1113 (8.4) | 1895 (10.8) | 2517 (12.5) | 2554 (11.3) | 8079 (11.0) | <.001 |
| Previous MI | 239 (1.8) | 397 (2.3) | 300 (1.5) | 150 (0.7) | 1086 (1.5) | <.001 |
| Diabetes | 1707 (12.9) | 3338 (19.0) | 4821 (23.9) | 5969 (26.3) | 15 835 (21.5) | <.001 |
| PVD | 786 (5.9) | 1382 (7.9) | 2011 (10.0) | 1832 (8.1) | 6011 (8.2) | <.001 |
| HBP | 4921 (37.2) | 9104 (51.8) | 12 237 (60.6) | 14 025 (61.8) | 40 287 (54.7) | <.001 |
| CKD | 198 (1.5) | 477 (2.7) | 1440 (7.1) | 2110 (9.3) | 4225 (5.7) | <.001 |
| COPD | 990 (7.5) | 1946 (11.1) | 2383 (11.8) | 2647 (11.7) | 7966 (10.8) | <.001 |
| Cancer | 96 (0.7) | 226 (1.3) | 335 (1.7) | 442 (1.9) | 1099 (1.5) | <.001 |
| CVD | 273 (2.1) | 490 (2.8) | 737 (3.7) | 1123 (5.0) | 2623 (3.6) | <.001 |
| CHF | 1813 (13.7) | 2443 (13.9) | 2787 (13.8) | 3423 (15.1) | 10 466 (14.2) | <.001 |
| Dementia | 8 (0.1) | 26 (0.2) | 31 (0.2) | 35 (0.2) | 100 (0.1) | .08 |
| Liver disease | 250 (1.9) | 398 (2.3) | 518 (2.6) | 653 (2.9) | 1819 (2.5) | <.001 |
| Previous cardiac surgery | 925 (7.0) | 1231 (7.0) | 1575 (7.8) | 2454 (10.8) | 6185 (8.4) | <.001 |
| Charlson index5,6 | 2.7 (1.4) | 3.1 (1.5) | 3.4 (1.6) | 3.6 (1.7) | 3.3 (1.6) | <.001 |
| Hospital volume (patients/y) | <.001 | |||||
| High | 5006 (38.0) | 6718 (38.3) | 7086 (35.2) | 8888 (39.3) | 27 698 (37.7) | |
| Intermediate-high | 3210 (24.3) | 5323 (30.3) | 5937 (29.5) | 6150 (27.2) | 20 620 (28.1) | |
| Intermediate-low | 2916 (22.1) | 3727 (21.2) | 4489 (22.3) | 4727 (20.9) | 15 859 (21.6) | |
| Low | 2052 (15.6) | 1796 (10.2) | 2618 (13.0) | 2847 (12.6) | 9313 (12.7) | |
| Nonelective procedure | 3259 (24.7) | 3532 (20.1) | 3600 (17.9) | 3459 (15.3) | 13 850 (18.8) | <.001 |
| Bioprosthesis | 2726 (20.7) | 6637 (37.9) | 10 001 (49.7) | 13 496 (59.6) | 32 860 (44.7) | <.001 |
CHF, congestive heart failure; CKD, moderate or severe chronic kidney disease; COPD, chronic obstructive pulmonary disease; CVD, cerebrovascular disease; HBP, high blood pressure; MI, myocardial infarction; PVD, peripheral vascular disease.
Analyses have been performed by considering only nonmissing data.
Data are expressed as No. (%), or median [interquartile range].
We investigated the changes in the proportion of and factors associated with the type of aortic prosthesis (mechanical or biological). Codes 35.21, 02RF07Z, 02RF08Z, 02RF0KZ, 02RF47Z, 02RF48Z, 02RF4KZ, X2RF032, and X2RF432 were used to identify biological prostheses and homografts and 35.22, 02RF0JZ, and 02RF4JZ to identify mechanical prostheses.
Statistical analysisCategorical variables are presented as absolute and relative frequencies (%) and were compared with a chi-square test. The normality of the quantitative variables was analyzed with normality plots. They are expressed as mean (standard deviation) or median and interquartile range [IQR]. Quantitative variables were compared with ANOVA or via nonparametric median comparisons if the distribution was not normal. Further analyses were performed to check for linear trends (LTs). Relative risk reductions (RRRs) and odds ratios (ORs) were calculated to estimate the strengths of associations between baseline variables and mortality.
A joinpoint regression analysis was applied to study varying trends in mortality over time to identify the time point(s) at which the trend changed.17 We calculated the overall annual percentage change (APC) as well as the APC of the periods defined by joinpoint analysis. Joinpoint regression analyses were performed using Joinpoint Regression Program version 4.8.0.1, provided by the Surveillance, Epidemiology, and End Results Program (National Cancer Institute). Further information on joinpoint regression is available in figure 2 of the supplementary data.
Through multivariate stepwise binary logistic regression, factors associated with in-hospital mortality were investigated. The variables in the model were selected according to theoretical criteria or if they were significantly related (P <.05) to the dependent variable in a previous univariate analysis. Multivariate model performance was studied using the area under the curve and Hosmer-Lemeshow test.
To adjust mortality for patient comorbidity, we estimated predicted risks of death with different multivariate logistic regression models. The best model was selected considering the best Akaike's information criteria and area under the receiver operating characteristic curves. Using the probability of in-hospital mortality predicted with this model, we calculated the risk-adjusted mortality ratio (RAMR). RAMR represents the ratio between the observed mortality and the predicted risks estimated by the logistic model. More information on the construction of the RAMR can be found in the figure 3 and figure 4 of the supplementary data.
Variations in the proportions of biological and mechanical valves were studied, and factors associated with the type of implanted prosthesis were detected with stepwise binary logistic regression. The variables in the model were selected according to theoretical criteria or if they had been significantly related (P <.05) to the dependent variable in a previous univariate analysis.
All statistical analyses were performed with Stata version 15.0 (StataCorp, College Station, Texas, United States).
RESULTSIntervention volumesThe MBDS database contains 147 921 records of patients who underwent SAVR between 1998 and 2017. Of these, 95 225 underwent SAVR with or without concomitant coronary artery bypass grafting (CABG). Finally, 77 668 (77.4%) underwent isolated SAVR (figure 1).
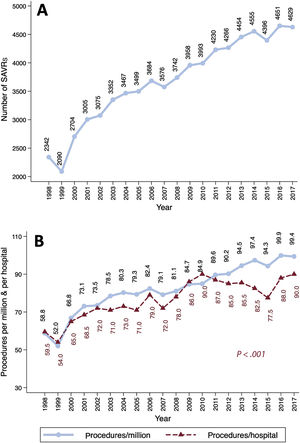
The SAVR volume and the number of procedures per million inhabitants increased linearly over time (figure 2). SAVR procedures were reported by 40 hospitals in 1998 vs 50 in 2017. The median number of interventions per center and year increased progressively—from 59.5 in 1998 to 90 in 2017 (P <.001)—but at a lower rate than the number of procedures per million inhabitants (figure 2B). The median [IQR] numbers of procedures per year and institution were 61.8 [53.2-88.2], 71.6 [56.8-103], 90 [66.8-112.4], and 84 [71.6-117.4] in the first, second, third, and fourth periods, respectively (PLT <.001) (figure 1 of the supplementary data).
Risk profiles and comorbidities in Spain. B: number of procedures per million inhabitants (circles) and median number of procedures/hospital in Spain (triangles) (P value for trend analysis <.001).")
Age increased by 3 years (68.9 vs 71.3, PLT <.001) from the first to the last period. In addition, 31 782 of the patients were women (43.1%). A worsening of patients’ risk profile was observed, with an increased prevalence of almost all comorbidities (table 1). The mean (standard deviation) age-modified Charlson index worsened from 2.7 (1.4) to 3.6 (1.7) (P <.001).
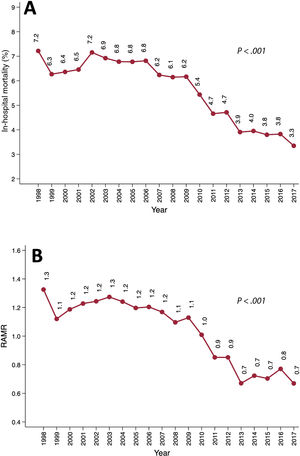
In-hospital mortalityIn-hospital mortality more than halved from 7.2% (169 of 2342) in 1998 to 3.3% in 2017 (155 of 4629) (RRR, 69.7%; PLT <.001) (figure 3A). This decrease occurred in all age groups (figure 3B): <60 years, 4.9% vs 1.4% (PLT <.001); 60-70 years, 6.2% vs 3.3% (PLT <.001); 70-80 years, 9.5% vs 3.6% (PLT <.001); and> 80 years, 11.8% vs 4.3% (PLT <.001). More information on mortality rates is shown in table 1 of the supplementary data.
. B: trend in the risk-adjusted mortality ratio (RAMR) over time (P value for trend analysis <.001).")
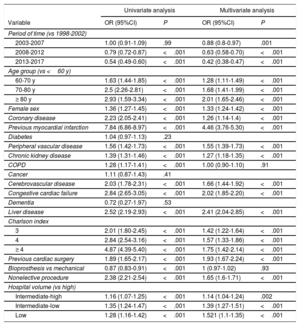
The study period and hospital volume, among others, were associated with mortality (table 2). A multivariate logistic model including factors associated with mortality showed fairly good performance (area under the curve, 0.76; 95% confidence interval [95%CI], 0.75-0.76; P=.23 [Hosmer-Lemeshow]).
Predictors of in-hospital postoperative mortality
| Univariate analysis | Multivariate analysis | |||
|---|---|---|---|---|
| Variable | OR (95%CI) | P | OR (95%CI) | P |
| Period of time (vs 1998-2002) | ||||
| 2003-2007 | 1.00 (0.91-1.09) | .99 | 0.88 (0.8-0.97) | .001 |
| 2008-2012 | 0.79 (0.72-0.87) | <.001 | 0.63 (0.58-0.70) | <.001 |
| 2013-2017 | 0.54 (0.49-0.60) | <.001 | 0.42 (0.38-0.47) | <.001 |
| Age group (vs <60 y) | ||||
| 60-70 y | 1.63 (1.44-1.85) | <.001 | 1.28 (1.11-1.49) | <.001 |
| 70-80 y | 2.5 (2.26-2.81) | <.001 | 1.68 (1.41-1.99) | <.001 |
| ≥ 80 y | 2.93 (1.59-3.34) | <.001 | 2.01 (1.65-2.46) | <.001 |
| Female sex | 1.36 (1.27-1.45) | <.001 | 1.33 (1.24-1.42) | <.001 |
| Coronary disease | 2.23 (2.05-2.41) | <.001 | 1.26 (1.14-1.4) | <.001 |
| Previous myocardial infarction | 7.84 (6.86-8.97) | <.001 | 4.46 (3.76-5.30) | <.001 |
| Diabetes | 1.04 (0.97-1.13) | .23 | ||
| Peripheral vascular disease | 1.56 (1.42-1.73) | <.001 | 1.55 (1.39-1.73) | <.001 |
| Chronic kidney disease | 1.39 (1.31-1.46) | <.001 | 1.27 (1.18-1.35) | <.001 |
| COPD | 1.28 (1.17-1.41) | <.001 | 1.00 (0.90-1.10) | .91 |
| Cancer | 1.11 (0.87-1.43) | .41 | ||
| Cerebrovascular disease | 2.03 (1.78-2.31) | <.001 | 1.66 (1.44-1.92) | <.001 |
| Congestive cardiac failure | 2.84 (2.65-3.05) | <.001 | 2.02 (1.85-2.20) | <.001 |
| Dementia | 0.72 (0.27-1.97) | .53 | ||
| Liver disease | 2.52 (2.19-2.93) | <.001 | 2.41 (2.04-2.85) | <.001 |
| Charlson index | ||||
| 3 | 2.01 (1.80-2.45) | <.001 | 1.42 (1.22-1.64) | <.001 |
| 4 | 2.84 (2.54-3.16) | <.001 | 1.57 (1.33-1.86) | <.001 |
| ≥ 4 | 4.87 (4.39-5.40) | <.001 | 1.75 (1.42-2.14) | <.001 |
| Previous cardiac surgery | 1.89 (1.65-2.17) | <.001 | 1.93 (1.67-2.24) | <.001 |
| Bioprosthesis vs mechanical | 0.87 (0.83-0.91) | <.001 | 1 (0.97-1.02) | .93 |
| Nonelective procedure | 2.38 (2.21-2.54) | <.001 | 1.65 (1.6-1.71) | <.001 |
| Hospital volume (vs high) | ||||
| Intermediate-high | 1.16 (1.07-1.25) | <.001 | 1.14 (1.04-1.24) | .002 |
| Intermediate-low | 1.35 (1.24-1.47) | <.001 | 1.39 (1.27-1.51) | <.001 |
| Low | 1.28 (1.16-1.42) | <.001 | 1.521 (1.1-1.35) | <.001 |
Left: Univariate analysis with logistic regression. Right: Multivariate analysis with stepwise logistic regression. ORs plus 95%CIs are shown. 95%CI, 95% confidence interval; COPD, chronic obstructive pulmonary disease; OR, odds ratio.
The overall average APC in mortality was −3.6 (95%CI, −4.5 to −2.7). A relevant change in the APC was detected in 2006. Between 1998 and 2006, the APC was 0.4 (95%CI, −1.3 to 2.1). From 2006 to 2017, it was −6.3 (95%CI, −7.5 to −5.1) (figure 2 of the supplementary data).
We detected a linear decrease in the RAMR between 1998 (1.3) and 2017 (0.7) (PLT <.001), which is consistent with the observed worsening risk profile of patients and the reduced mortality (figure 3B). Further information regarding the performance of the model used to estimate the RAMR can be found in figure 3 of the supplementary data.
Type of prosthesisIn total, 32 860 patients (44.7%) received a bioprosthesis. Male patients received mechanical prostheses more frequently than women (58.8% vs 50.7%; P <.001).
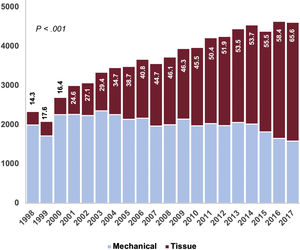
From 1998 to 2002, 20.7% of implanted prostheses were tissue valves. This proportion increased linearly: from 2003 to 2007 (37.9%), from 2008 to 2012 (49.7%), and from 2013 to 2017 (59.6%) (PLT <.001). As shown in table 1 and figure 4, there was a decrease in the ratio of mechanical to biological prostheses. As expected, the use of mechanical prostheses was greater among patients <65 years of age (86.7%, 17 757 of 20 488) than among those ≥ 65 (43.2%, 22 877 of 53 006) (P <.001). There was a progressive increase in the use of tissue valves in the 2 groups throughout the series (figure 4A of the supplementary data) (P <.001). We also detected an inverse relationship between the volume of hospital activity and the use of bioprostheses (figure 4B of the supplementary data) (PLTs <.001).
.")
Factors related to the implantation of tissue valves are shown in table 2 of the supplementary data.
DISCUSSIONWe have analyzed a large cohort of patients who underwent SAVR in Spain. Between 1998 and 2017, there was a significant increase in intervention volume and a worsening of patients’ risk profile (table 1). Nonetheless, mortality fell by 69.7% during the study period. In addition, we found increased use of tissue valves, particularly among patients older than 65 years. We consider this information to be valuable because SAVR has been the most frequent heart valve procedure performed in Spain in the past 2 decades.
The data analyzed in this study were extracted from a mandatory nationwide administrative database. We are aware of the limitations inherent to the analysis of administrative data. Mack et al.7 showed, via a comparison of clinical and administrative databases in the US, that there was a difference of up to 21% in the volume of CABG interventions and of almost 20% in mortality. Gutacker et al.,11 using data from the MBDS, also identified as misclassified more than 25% of patients undergoing CABG because concomitant procedural codes were not excluded during patient selection. Knowing these limitations, we meticulously selected patients by reviewing all procedure codes: finally, only 73 668 patients out of the 147 921 records originally retrieved corresponded to isolated SAVR. Most of the rest underwent a concomitant procedure (figure 1). This volume of interventions was very similar to that reported by the National Registry of the Society of Thoracic and Cardiovascular Surgery.6,18,19
The number of SAVRs/million inhabitants is lower in Spain than in other countries (figure 2B). Dunning et al.3 reported an average SAVR volume in the UK of 100.8 SAVRs/million inhabitants and year between 2004 and 2009, whereas the percentage was barely 80/million inhabitants in Spain. In Germany,4,5 the number of isolated SAVRs with or without CABG was approximately 137.7/million inhabitants in 2015 vs 94.3 in Spain. The low volume of cardiac surgery procedures in our country is a well-known phenomenon.20
In Spain, the profile of patients undergoing isolated SAVR significantly worsened from 1998 to 2017 (table 2). The median age increased by 3 years from the first period to the fourth (68.9 vs 71.3 years, PLT <.001), the proportion of octogenarians quadrupled (5.2% vs 20.7%, PLT <.001), the proportion of diabetes patients doubled (12.9% vs 26.3%, PLT <.001), and moderate-to-severe chronic kidney disease showed a 6-fold increase (1.5% vs 9.3%, PLT <.001). The progressive worsening of the SAVR risk profile has already been observed in other countries. A registry of more than 100 000 patients who underwent operations in the US between 1997 and 2006 21 revealed a similar increase in the median age, proportion of women, and prevalence of peripheral vascular disease to Spain.
On the other hand, the risk profile of patients undergoing SAVR in Spain was different to that of other countries. The median age of Spanish patients was higher than in British,3 German,4,5 or American21 series in the same time periods. Women were more prevalent in Spain than in Germany or the UK. The prevalence of diabetes or chronic obstructive pulmonary disease was high compared with Germany and lower than in the UK or US. It is difficult to make an adjusted comparison of the baseline risk of patients due to the administrative origin of the data presented in this study, although different risk profiles across countries may partially explain the differences in in-hospital mortality: for example, the unadjusted mortality was 2.3% in Germany between 2011 and 2013 but 4.4% in Spain.5 In the 2004 to 2009 period, in-hospital mortality after SAVR was 4.1% in the UK vs 6.4% in Spain.3
The results of this large cohort are particularly valuable for the analysis of trends. From 1998 to 2017, we observed a significant reduction in mortality (7.2% vs 3.3%, PLT <.001) and RAMR (1.3 vs 0.7, PLT <.001) (figure 3). We also detected decreased mortality in all patient subgroups (table 1 of the supplementary data). The decrease in mortality was similar in intensity to that observed in other cohorts. For example, in the UK registry, mortality decreased from 4.4% to 3.7% over 5 years (P <.001).3
We detected a relevant reduction in the average APC in mortality from 2006 (figure 2 of the supplementary data). This could be explained by improvements in the SAVR procedure itself and the increasing indication for TAVI for patients with poorer profiles, which could have precluded them from SAVR and therefore globally improved surgical outcomes. Nevertheless, the impact of TAVI on SAVR is not adequately demonstrated in this study because the major expansion of TAVI among low- and intermediate-risk patients was seen from 2017 to 2018 due to new evidence supporting these indications.22–24
The proportion of tissue valves implanted in Spain was 44.7%, which is low compared with other developed countries (figure 4). In the UK, between 2004 and 2009, 71.8% of patients undergoing SAVR received a bioprosthesis. In the same period, the proportion was 42% in Spain.3 In 2006, 78.4% of the implanted prostheses were biological in the United States, whereas the figure was 40.6% in Spain25 (table 1 and figure 4 of the supplementary data). Higher rates of bioprostheses were also seen in Germany and Sweden.4,26,27 Mechanical valves are recommended in younger patients in the European Guidelines on the Management of Valvular Heart Disease.1,28 Nonetheless, there is a controversy in the literature about their pros and cons: Goldstone et al.25 detected increased long-term mortality in patients younger than 55 years of age who received tissue prostheses vs mechanical prostheses (HR, 1.23; 95%CI, 1.02-1.48). Glaser et al.26 also found increased mortality in patients between 50 and 69 years of age who received bioprostheses (HR, 1.34; 95%CI, 1.09-1.66). This could partially justify the marginal use of biological prostheses in Spain in patients younger than 65 years. Even when tissue valves were the most implanted prostheses (2013-2017), only 1 in 5 patients (20.7%) younger than 65 years received one. The use of biological prostheses in people older than 65 is also markedly low (56.9%) vs other developed countries,3–5,25–27 despite its increasing use over time: 28.8% in the 1998 to 2002 period, 49.3% in the 2003 to 2007 period, 61.8% in the 2008 to 2012 period, and 71.5% in the 2013 to 2017 period (PLT <.001) (figure 4 of the supplementary data).
LimitationsClinical interpretations of administrative data, no matter how carefully performed, should always be taken with caution. Coding errors in clinical information and the lack of availability of ICD-9/ICD-10 codes to cover the entire variety of procedures and diagnoses prevent us from adequately defining variables to adjust the baseline risk of patients. For the same reason, it was not possible to estimate risk of frailty scores for SAVR (such as EuroSCORE,29 Katz's index, or Fried's score), which could have helped to better define the baseline risk. Given the information available in the MBDS, the native valve lesion (stenosis or regurgitation) and its etiology are unknown. Stratified analyses according to these variables would have undoubtedly added valuable information to the study.
We do not have enough information to explain the differences in the choice between bio- and mechanical prostheses with respect to other countries and according to center volume. The reported SAVR volume in Spain might be underestimated because records from hospitals that do not report to the MBDS have not been collected. According to the Spanish Department of Health and previous reports, some records have been missed during 2016 and 2017 due to the conversion from the ICD-9 to ICD-10.30 Therefore, the volume of procedures during these 2 years might, once again, be underestimated.
CONCLUSIONSWe detected a linear increase in the annual volume of SAVR in Spain from 1998 to 2017, with more patients receiving bioprostheses. Despite an increased risk profile of the patients, in-hospital mortality substantially reduced.
FUNDINGThis investigation was partially funded by Edwards Lifesciences. The company participated in designing the scope and methodology of the research.
CONFLICTS OF INTERESTThe authors declare no conflicts of interest regarding the content of this manuscript.
- -
SAVR is indicated to treat severe aortic valve disease. It has been the most frequently performed valve procedure in Spain for decades.
- -
A nationwide systematic analysis of the quality of the SAVR process has not yet been performed.
- -
A perspective of the changes in SAVR in the past 2 decades in Spain is presented: we observed an increase in the volume of procedures and a growing use of tissue valves vs mechanical prostheses. Despite a worsening risk profile, a significant reduction in in-hospital mortality was achieved.
We wish to thank the Unit of Health Care Information and Statistics from the Spanish Ministry of Health, Consumer Affairs, and Social Welfare for the quality of the information provided to perform this investigation.
Supplementary data associated with this article can be found in the online version available at https://doi.org/10.1016/j.rec.2020.06.008