Keywords
INTRODUCTION
The reduction in lumen diameter that occurs following stent implantation is proportional to the extent of vascular damage1-4 and is also linked to a number of clinical and angiographic variables, such as diabetes, artery diameter, and the length of the lesion.5 Although it has been suggested that low levels of wall shear stress (WSS) could favor the process of restenosis, it has been difficult to demonstrate such a relationship in humans. Given the role of shear stress in the composition and behavior of atherosclerotic plaques,6-9 it is reasonable to assume that it may also be involved in proliferative responses following angioplasty.
Currently, direct calculation of flow velocity and pressure at the luminal surface is not possible in vivo. However, technological and scientific advances in mathematical and numerical models allows mathematical simulation of blood flow and the precise determination of local hemodynamic effects.10 In this way, the WSS can be estimated in vivo and we can analyze the influence of hemodynamic variables on in-stent restenosis. Early studies using these methods yielded conflicting results. In 1 report, a negative correlation was suggested between WSS and neointimal proliferation following implantation of Wallstents,11 while in another study no relationship was found between these 2 variables.9
The aim of this study was to assess the contribution of WSS to neointima formation following successful implantation of balloon-expandable stents. Realistic 3-dimensional (3D) geometric reconstruction was used based on a combination of conventional coronary angiography and IU alongside a technique for numerical simulation of blood-flow conditions known as computational fluid dynamics (CFD).
PATIENTS AND METHODS
Study Group
The study was approved by the local ethics committee and all patients signed an informed consent form. Inclusion criteria were as follows: patients should be at least 18 years old, present de novo lesions of less than 25 mm in length in native coronary arteries, and be considered candidates for treatment by angioplasty and stenting. Only proximal and medial segments of the right coronary artery were studied, in an effort to avoid complexities associated with large bifurcations such as that of the left main coronary artery. Exclusion criteria were as follows: intervention during the acute phase of myocardial infarction, substantial tortuosity proximal to the target lesion, severe calcification that could interfere with ultrasound analysis of the arterial edges, renal failure, anemia, significant systemic disease that could threaten life expectancy, and use of experimental devices or drugs for prevention of restenosis.
Angioplasty Procedures
Stent implantation was performed using a standard procedure. All patients were treated with aspirin and ticlopidine prior to the procedure. Unfractionated heparin (100 U/kg) was administered through the guide catheter. Prior to the introduction of the angioplasty guidewire, 2 angiographic projections of the target lesions were obtained and the artery was examined by intravascular ultrasound (IU). With the exception of patient 2, the stent was placed directly in all cases. The following stents were implanted: Multilink Ultra in 2 cases and Tetra in 2 cases (both from Guidant, Santa Clara, CA, USA); Jostent Flexmaster (Jomed, Ragendingen, Netherlands) in 1 case; and NIR (Boston Scimed, Natick, MA, USA) in 2 cases.
Imaging of the Coronary Arteries
In all cases, conventional angiography and IU were performed at baseline (following stent implantation) and at 6-month follow-up. Images were acquired using 6-French guide catheters following intracoronary administration of 200 µg nitroglycerin. Once satisfactory stent placement was achieved, 2 orthogonal projections were captured in DICOM format at a rate of 25 images per second, with the IU catheter positioned just beyond the distal edge of the stent. During capture of the angiographic images, contrast solution was injected following 1:1 dilution with saline in an effort not to obscure visualization of the IU catheter. Since identification of the edges of the intima was still possible, this allowed the trajectory of the catheter and anatomic markers such as side branches to be visualized at the same time. Images obtained in end-diastole were used for the geometric reconstruction. The trajectory of the IU catheter was used as the main axis or "backbone" with which to orientate the reconstruction of the transverse sections obtained by IU and, therefore, obtain a realistic 3D reconstruction.
Automated quantitative angiography data were obtained using a program available as part of the General Electric Advantx system (GE Medical Systems, Paris, France).
Conventional catheters (Atlantis 40 MHZ, Boston Scimed, San Jose, CA, USA) were used for IU. Ultrasound images were obtained digitally during ECG-triggered automated pullback using a specifically designed device (TomTec Imaging Systems, GMBH, Unterschleissheim, Germany). The system allowed correction for the displacement of the intravascular-ultrasound catheter that occurs during the cardiac cycle and breathing, making it possible to obtain precise end-diastolic images for the longitudinal reconstruction.
Three-Dimensional Reconstruction and Generation of the Mesh
The technique used for reconstruction in this study was similar to that used by Slager et al.12 Briefly, the technique is based on the superposition of ultrasound sections on the 3D trajectory of the coronary artery, or in this case, the IU catheter inside it. The ultrasound sections used were images obtained at intervals of 2 mm, with the first image taken 4 mm from the distal edge of the stent (most distal section) and the last section (most proximal) at the aorto-ostial junction. The lumen and external contours were manually identified and marked in each section. After marrying the line of the IU catheter obtained by angiography with the center of the ultrasound sections, the lumen and external contours were reconstructed perpendicularly at 2 mm intervals and the global geometry interpolated. Axial orientation of the ultrasound sections was performed by localization of 2 separate side branches identified both by angiography and IU.
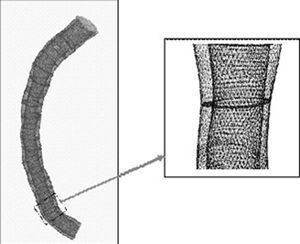
Three-dimensional reconstruction allows generation of a virtual mesh that is used in the mathematical simulation of the fluid dynamics. The spatial reconstruction, segmentation (3D mesh), and fluid dynamic variables derived were obtained using specific software (Fluent, v. 6.0, Fluent Inc., Lebanon, NH, USA). Figure 1 shows an example of this kind of 3D reconstruction.

Figure 1. Example of a realistic 3D reconstruction used in the studies of fluid dynamics.
Computational Fluid Dynamics
A technique known as the finite volume method was used to calculate blood-flow conditions. The method is based on dividing the internal volume of the coronary artery into tiny parts or finite volumes (Figure 1).13 Then, the Navier-Stokes equations are resolved, allowing the fluid-mechanical variables to be calculated for each of the elements. The application of this technique requires the construction of a mesh based on the reconstructed image of the coronary artery. The mesh process allows the vascular structure to be subdivided into finite volumes, in which the flow velocity and WSS can be calculated. In this study, the volume elements were hexahedrons with a mean resolution of 0.2 mm, such that each coronary artery was subdivided into a variable number of points in which the fluid-dynamic variables were calculated. The number of points varied according to the length and dimensions of the vessel studied.
For calculations of fluid dynamics it was assumed that blood behaved as a Newtonian fluid with a density of 1050 kg/m³ and a viscosity of 3 cP.8,14 Laminar flow was assumed, taking into consideration the Reynolds number for a vessel with a diameter of between 3 and 4 mm. Variations in the cross-sectional area of the vessel during the cardiac cycle were not taken into account, since they are minimal in arteries that are atherosclerotic and, therefore, more rigid, and nonexistent in stented segments. Consequently, calculations were performed based on a fixed geometry for the luminal surface. The parabolic inflow velocity profile at the entrance of the coronary artery was taken to be 25 cm/s in all cases. This rate was chosen to simulate a situation at rest in all cases and is similar to the rate used in other studies.8 The fluid dynamics were calculated in the stented sections at baseline (following expansion of the stent) and at 6-month follow-up.
Analysis and Statistics
Continuous variables are expressed as means (SD). Means were compared using the Student t test for independent samples. To assess the relationship between fluid dynamics and neointimal proliferation, an algorithm was developed specifically that allowed precise, robust correlation between the shear stress obtained from the CFD calculations and the local thickness of the vessel wall at each point.
In the segment studied, the internal mesh was obtained from the lumen contour of the IU performed at 6-month follow-up. The NT was calculated from the difference between that lumen contour and the stent contour. The thickness at the edges of the stent was obtained from the difference between the lumen contour at 6-month follow-up and that in the baseline condition following stent implantation. In this calculation the edges included the 4 mm distal and proximal to the stent. Given the enormous number of points with data available from CFD, in order to be able to analyze correlations with wall thickness a specific algorithm was designed that allowed the number of points to be reduced and, at the same time, smoothed the data by eliminating undesirable local artifacts. To this end, a new interpolation mesh was constructed. Data with which to assess correlations between fluid dynamics and NT was available for an average of 2432 points (range, 955-5002) per coronary artery.
The relationship between shear stress and neointimal proliferation was assessed by linear regression analysis. Analysis of correlations was performed using the shear stress obtained at baseline. For a more accurate analysis of the fluid-dynamic conditions associated with restenosis, the shear stress was divided into quartiles. In this way, NT could be compared in different groups according to post-stent values for WSS.
Statistical calculations were performed using SPSS version 10.0. P<.05 was considered statistically significant.
RESULTS
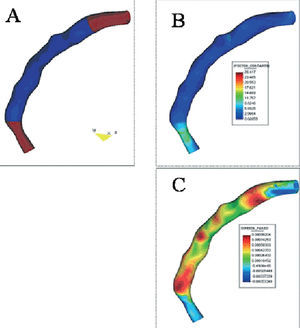
The clinical and angiographic characteristics of the 7 patients included in the study are summarized in Tables 1 and 2. In all cases, it was possible to perform a 3D geometric reconstruction, both at baseline and follow-up. One patient required additional stents to cover a dissection proximal to the initial lesion that extended up to the ostium of the coronary artery. Consequently, it was not possible to obtain the proximal edge without stent in this case. Figure 2 contains an example of a 3D reconstruction showing the estimated WSS and NT using a colored scale. Two patients presented angiographic restenosis (stenosis >50%) at follow-up and 1 of those patients required repeat angioplasty of the target lesion. In that case, IU was performed prior to dilatation.


Figure 2. Example of a geometric reconstruction of the segment covered by the stent (shown in blue in panel A) and the proximal and distal edges (shown in brown in panel A). The wall shear stress and neointimal thickness are shown on a colored scale in panels B and C, respectively.
NT and WSS
The mean NT in the treated segments, including the edges without the stent, was 0.29±0.21 mm and the WSS for the same segments was 1.93 Pa. In general, neointimal growth was greater in the segments covered by the stent than the in the edges (0.29±0.20 mm vs 0.14±0.31 mm; P<.001). In contrast, the WSS was significantly lower in the stented segments than the edges (1.82±1.10 Pa vs 2.40±2.10 Pa; P<.001).
Relationship Between Neointimal Proliferation and WSS
When all cases were considered, a weak negative correlation was observed between NT and WSS (r=-0.15; P<.001). The relationship between these 2 variables was similar in the stented segments and the edges, except in 1 case (Tables 3 and 4). A significant negative correlation between NT and WSS was observed in 5 patients. With the exception of 1 case, the mean NT was significantly higher in the lower quartiles for WSS (Table 5). However, abnormally low values for WSS were recorded in that patient (Table 5). Grouping together all of the cases, in the quartiles corresponding to WSS the NT was 0.34±0.21 mm in quartile 1 and 0.27±0.24 mm in quartile 4 (P<.0001). The NT of the 4 groups for WSS is shown in Figure 3.


Figure 3. Distribution of neointimal thickness (y axis) according to wall shear stress divided into 4 groups (quartiles) shown on the x axis.
Evolution of WSS in Stented Segments
The baseline WSS in the stented segments shifted from 2.40±2.06 Pa to 3.43±3.26 Pa. This change in shear stress was positively correlated with the measured NT (r=0.33; P<.0001). Figure 4 shows the relationship between the change in WSS and the NT divided into quartiles. The mean increase in WSS for the lower and upper quartiles of NT was 0.22±1.80 Pa and 2.14±2.24 Pa, respectively (P<.001).

Figure 4. Changes in the wall shear stress (calculated as [value at follow-up][baseline value immediately after stent implantation]; y axis) in different groups (quartiles) of neointimal thickness (x axis).
DISCUSSION
In this study, the influence of WSS on neointimal proliferation following intracoronary stent implantation was analyzed longitudinally in an in vivo human model. The main finding was a negative correlation between WSS and NT in 5 out of 7 cases studied. The lowest values for WSS were correlated with a higher degree of proliferation at 6 months. However, the observed correlation is weak and other, more potent factors are certain to be involved in neointima formation.
Neointimal Proliferation Following Stent Implantation: the Role of Fluid Dynamics
Proliferation of scar tissue is practically the only mechanism of lumen loss following placement of stents.1 The main trigger for this proliferative response is the mechanical stretching of the vessel wall, leading to the exposure of subendothelial structures to the blood flow and activation of a major thrombotic and inflammatory response.4,5 The amount of neointimal tissue is proportional to the degree of damage caused, and local factors play a major role in the reparative response following angioplasty.2,3 In fact, the presence of a metallic structure at the luminal surface contributes to the increased neointimal response4,15 and even the design of the stent can influence this response.16-18 Systemic variables, such as insulin resistance and diabetes can promote restenosis.19 A correlation between restenosis and certain genetic polymorphisms has also been shown.20-22
Compared with other local factors, the role of fluid dynamics in neointimal proliferation has not been extensively studied. The relationship between low WSS and progression of atherosclerosis can be inferred from the eccentric distribution of atherosclerotic plaques, which are generally thickest at the inner surface of curves in the arteries and the side opposing the flow division in bifurcations.23,24
In previous studies, numerical simulation of blood flow has shown a negative correlation between WSS and plaque progression8; however, the relationship is complex and is limited to certain patterns of vascular remodeling.25 More recently, in an experimental model of angioplasty, Carlier et al26 elegantly demonstrated that implantation of multiple flow dividers in an oversized stent placed in rabbit iliac arteries can attenuate neointimal growth and the inflammatory response. These findings suggest that hemodynamic conditions exert an influence on in-stent restenosis. However, the conclusions cannot be extrapolated directly to human models, since flow conditions, vascular geometry, and the extent of the response to lesions are very different.
Wentzel et al11 used a similar 3D reconstruction model to the one employed here to evaluate 14 patients with Wallstents implanted in native coronary arteries. They demonstrated a negative correlation between NT and WSS in 9 patients. The r values varied between 0.04 and 0.65, with a beta coefficient of -0.08±10 mm. Although our findings are consistent with those of Wentzel et al, the impact of WSS on neointimal proliferation appears to be lower in our study. However, it is important to take into account certain methodological differences between the 2 studies. The results obtained with self-expanding stents such as the Wallstent are difficult to extend to balloon-expanded stents, which are in more widespread clinical use. Self-expanding stents generate a more intense neointimal response, partly due to the continued, late expansion.16,17 Late expansion was not considered in the study of Wentzel et al, and the authors used the stent contour obtained at follow-up (generally considered to be larger than that measured immediately after implantation), possibly leading to overestimation of the WSS at the luminal surface.
More recently, Stone et al9 studied 6 coronary artery segments treated with conventional stents, also using numerical simulation of the fluid dynamic conditions and 3D reconstruction. While areas with low WSS were more prone to plaque accumulation and eccentric remodeling in sections not containing stents, there was no significant correlation between in-stent neointima formation and WSS. Again, certain methodological differences may explain these apparent discrepancies between our study and the results of Stone et al, such as the inclusion of branches of the left coronary artery, the methods used to estimate blood flow, and the segmentation of plaque thickness for analysis of correlations.
Our findings support the hypothesis that neointimal growth is correlated with flow conditions following stent placement. This relationship appears not to be present under conditions of physiologic or elevated of WSS. The correlation appears to be restricted to conditions of low shear stress and the pattern observed suggests a threshold effect on the proliferative response. The underlying cellular mechanisms could involve the activation of membrane receptors that are sensitive to conditions of reduced flow and that activate intracellular signals that favor the generation of neointimal tissue. The outcome would be normalization of flow conditions at the vessel wall through growth into the lumen of the artery. In fact, in our study, estimation of the WSS over time revealed an exponential increase in those areas with greatest neointimal growth (Figure 4). It should be noted that the 2 cases in which no correlation was observed between baseline fluid dynamic conditions and neointimal proliferation showed the highest and lowest absolute values, with limited changes along the length of the stent (patients 1 and 6, respectively; Table 5). This finding is also suggestive of a threshold for shear stress beyond which the stimulus for proliferation of the tissue is triggered.
Finally, we were able to analyze the behavior at the edges of the stent, areas in which the greatest loss often occurs following angioplasty. The results suggest a similar role for fluid dynamics at this site, with a weak negative correlation between WSS and lumen loss.
Implications
These findings further support the general recommendation that good, uniform expansion is ensured in segments treated with stents. Nevertheless, the implications of this study in terms of restenosis in the currently available drug-eluting stents are unclear, since those stents generate almost no neointimal response.
Limitations
The main limitation of this study is the small number of cases included, justified by the overall complexity of the procedure. Nevertheless, the large number of points and the wide range of shear stress values analyzed for each coronary artery lessen this limitation. None of the coronary arteries studied had significant tortuosity or bifurcations, and furthermore, the results of angioplasty in terms of stent expansion could be considered satisfactory, without clear areas of underexpansion, which can prevent assessment of these specific conditions. However, the mathematical simulation of fluid dynamics in a tortuous vessel is difficult using these methods because the geometric reconstruction is based on a central axis obtained from the IU catheter and the presence of the device stretches the artery, neutralizing the natural curves observed by angiography.
Finally, the fact that we did not perform a direct assessment of flow velocity prevents estimation of the absolute values of WSS. However, the calculations are based on values for the velocity that are commonly seen in the right coronary artery and allow temporal changes in the WSS to be analyzed in the same artery.
CONCLUSIONS
The present study shows a negative correlation between WSS and neointimal proliferation. However, the influence of this fluid dynamic variable appears to be limited and, furthermore, is restricted to conditions of reduced flow. The implications of these findings for the current use of drug-eluting stents are unclear.
This work was funded in part by a special grant from the Spanish Society of Cardiology.
Correspondence: Dr. M. Sanmartín Fernández.
Unidad de Cardiología Intervencionista. Medtec. Hospital Meixoeiro.
Meixoeiro, s/n. 36200 Vigo. Pontevedra. España.
E-mail: marcelo.sanmartin.fernandez@sergas.es
Received July 12, 2004.
Accepted for publication October 18, 2005.