There is currently increasing interest in epicardial adipose tissue (EAT) as a marker of cardiovascular disease. Our purpose was to describe EAT, measured by transthoracic echocardiography, and to assess its association with metabolic syndrome (MS) in the RIVANA population-based study.
MethodsPhysical examination was performed in 880 participants aged 45 to 74 years (492 of them with MS according to the harmonized definition). Fasting glucose, high-density lipoprotein cholesterol, triglyceride, and C-reactive protein concentrations were determined in a blood sample. In all participants, EAT thickness was measured with transthoracic echocardiography at end-systole.
ResultsAmong participants without MS, the prevalence of EAT ≥ 5mm significantly increased with age (OR > 65 years vs 45-54 years=8.22; 95%CI, 3.90-17.35; P for trend<.001). Increasing EAT quintiles were significantly associated with MS (OR fifth quintile vs first quintile=3.26; 95%CI, 1.59-6.71; P for trend=.001). Considering the different MS criteria, increasing quintiles of EAT were independently associated with low high-density lipoprotein cholesterol (OR fifth quintile vs first quintile=2.65; 95%CI, 1.16-6.05; P for trend=.028), high triglycerides (OR fifth quintile vs first quintile=2.22; 95%CI, 1.26-3.90; P for trend=.003), and elevated waist circumference (OR fifth quintile vs first quintile=6.85; 95%CI, 2.91-16.11; P for trend<.001).
ConclusionsIn a subsample of the general population, EAT measured by echocardiography increased significantly and independently with age. Increased EAT thickness was independently associated with MS and with low high-density lipoprotein cholesterol, high triglycerides, and elevated waist circumference as individual criteria.
Keywords
Obesity is currently one of the leading causes of cardiovascular disease (CVD) and death worldwide. Together with overweight, obesity causes at least 2.8 million deaths worldwide each year, 3% to 9% of potential years of life lost, and is responsible for at least 35% of cases of coronary artery disease.1–3 It is intimately related to the development of atherosclerosis and the subsequent increase in cardiovascular risk.4 This risk depends, however, on the location of the excess adipose tissue. Ectopic adiposity has been reported to imply a higher cardiovascular risk than subcutaneous adiposity.5 Therefore, interest in ectopic adiposity is currently growing.
Each organ-specific visceral fat deposit has been proven to be anatomically and functionally different6–8; furthermore, due to its proximity to vital organs, visceral fat deposit may play a local modulatory role in addition to having a systemic effect.5 Specifically, epicardial adipose tissue (EAT) is anatomically and functionally contiguous to the myocardium and is in direct contact with the coronary vasculature. It can produce and secrete bioactive molecules, which can modulate adjacent myocardium through different mechanisms, and can exert mechanical, thermogenic, and metabolic effects.9,10
The role of EAT in CVD, however, is still not completely clear, and the mechanisms by which it can produce atherosclerosis are complex and not completely understood.8 Nevertheless, there is strong scientific-based evidence that increased EAT is associated with prevalent11 and incident12 metabolic syndrome (MS), insulin resistance in obese persons and postmenopausal women,13,14 visceral adiposity,14–17 cardiac structural abnormalities,18–20 and, moreover, with incident and prevalent coronary artery disease and cardiovascular events.21–23 However, studies describing echocardiographically measured EAT in the general population are scarce,12,20 and there are substantial differences between ethnic groups.11,24 Our purpose was a) to describe EAT by age and sex in a healthy sample of the general population, and b) to determine the association of EAT with MS and its various different components.
METHODSStudy PopulationThe present study is included in the RIVANA study,25,26 which was designed to study the prevalence of cardiovascular risk factors and MS in the Spanish province of Navarre, their relationship with asymptomatic CVD, and their impact on vascular disease after a 10-year follow-up. Initially, 5682 participants aged between 35 and 84 years were randomly selected from the electoral registry of Navarre, obtaining a response rate of 73.4%. Accordingly, the final sample size was 4168. A subsample of 1100 participants aged 45 to 74 years was selected to constitute a cohort to address the incidence of MS and asymptomatic CVD, according to different markers of cardiovascular risk: 550 with MS randomly selected from those participants with MS according to the Adult Treatment Panel III criteria27 and 550 randomly selected participants free of MS, all of them free of CVD at baseline. This sample size was calculated on the basis of a 1:1 exposed to nonexposed ratio, a cumulative incidence of 0.045 to 0.05 for cardiovascular events, an estimated hazard ratio of 2 for MS, a statistical power of 80%, and an a priori defined alpha error of 0.05. The sample size was overestimated by an additional 10%. Finally, 900 participants (435 with MS and 465 free of MS) were recruited and underwent transthoracic echocardiography (TTE). Eventually, 20 participants were excluded due to baseline atrial fibrillation or other pathological cardiac conditions unknown to the participants prior to the baseline examination. Thus, the resultant effective sample size for our analyses was 880 participants (423 with MS and 457 free of MS according to the Adult Treatment Panel III definition of MS). All participants gave their informed consent and the study protocol was approved by the Institutional Review Board of the Government of Navarre, Spain.
Metabolic Syndrome AscertainmentAs previously indicated, participants were initially classified according to the 2001 Adult Treatment Panel III definition of MS,27 which was the prevailing criteria when we performed this study. We decided to reclassify the patients according to the International Diabetes Federation classification established in 200628 and subsequently harmonized,29 which is currently more widely used. In this classification, participants must have at least 3 of the following criteria: waist circumference ≥ 102cm in men or ≥ 88cm in women; triglycerides ≥ 150mg/dL (1.69 mmol/L) or treatment with a triglyceride-lowering drug; high-density lipoprotein cholesterol (HDL-C) < 40mg/dL (1.04 mmol/L) in men or 50mg/dL (1.29 mmol/L) in women or drug treatment for low HDL-C; systolic or diastolic blood pressure ≥ 130 or 85mmHg respectively, or treatment with blood pressure-lowering drugs; fasting glucose ≥ 100mg/dL (5.6 mmol/L) or prescribed treatment for established diabetes. According to the harmonized definition, the final sample for our analyses included 492 participants with MS and 388 participants free of MS.
Assessment of Epicardial Adipose TissueAt baseline, all participants underwent targeted M-mode recordings, 2-dimensional imaging, and Doppler ultrasound measurements (Phillips 7500, Andover, Massachusetts, United States) according to published standards.30 On echocardiography, EAT thickness was measured on the right ventricle anterior free wall at end-systole, as recommended by Iacobellis.15,31 All echocardiographic studies were done by a trained cardiologist.
Physical Examination and Determination of Biological ParametersFinally, all participants underwent a physical examination, with measurement of waist circumference, height, weight, and blood pressure. Body mass index was calculated as the weight divided by the square of the height (kg/m2) and was categorized into normal weight (< 25kg/m2), overweight (25 to < 30kg/m2), and obesity (≥ 30kg/m2). A fasting blood sample was taken, and fasting glucose, HDL-C, plasma triglycerides, and high-sensitivity specific C-reactive protein were determined.
Assessment of Other CovariatesInformation on sociodemographic factors and smoking were gathered in the baseline interview, and smoking was classified in 3 categories (current-, former-, or never-smokers).
Statistical AnalysisBaseline characteristics are presented as mean±standard deviation or absolute numbers (percentage) separately for men and women. To assess the association between age and increased EAT (cutoff value 5mm), we used nonconditional logistic regression models and considered sex, smoking, body surface area (tertiles), high-sensitivity C-reactive protein (dichotomous), body mass index, and waist-to height ratio (dichotomous) as potential confounders; in an additional model, we further adjusted for MS criteria, according to a previous publication and the clinical relevance of potential confounders.21 We also evaluated the interaction between age and sex in their association with EAT with the likelihood ratio test. Mean differences in EAT by age among men and women without MS were assessed with crude and multivariable adjusted linear regression models.
To assess the association between EAT quintiles and the prevalence of MS or its different components, we also used nonconditional logistic regression models with EAT as an independent variable and MS or its components as dependent variables, taking into account the same potential confounders, based on previous publications and their clinical relevance.12,16,21 Goodness-of-fit was assessed with the Hosmer-Lemeshow test and the model specification with the link test. All analyses were performed with STATA/SE 13.1 (College Station, TX: StataCorp LP). All P values are 2-tailed and statistical significance was set a priori at P<.05.
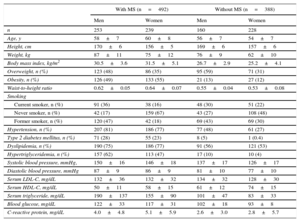
RESULTSIn our study, we included 880 participants. Baseline characteristics according to the presence of MS are displayed in Table 1 separately for men and women. Among participants without MS, women had a lower prevalence of overweight and smoking and a lower body mass index, waist-to-height ratio, systolic and diastolic blood pressure, and serum levels of low density lipoprotein cholesterol, fasting glucose and triglycerides. Also women had higher HDL-C levels.
Baseline Characteristics of the RIVANA Participants by MS and Sex
| With MS (n=492) | Without MS (n=388) | |||
|---|---|---|---|---|
| Men | Women | Men | Women | |
| n | 253 | 239 | 160 | 228 |
| Age, y | 58±7 | 60±8 | 56±7 | 54±7 |
| Height, cm | 170±6 | 156±5 | 169±6 | 157±6 |
| Weight, kg | 87±11 | 75±12 | 76±9 | 62±10 |
| Body mass index, kg/m2 | 30.5±3.6 | 31.5±5.1 | 26.7±2.9 | 25.2±4.1 |
| Overweight, n (%) | 123 (48) | 86 (35) | 95 (59) | 71 (31) |
| Obesity, n (%) | 126 (49) | 133 (55) | 21 (13) | 27 (12) |
| Waist-to-height ratio | 0.62±0.05 | 0.64±0.07 | 0.55±0.04 | 0.53±0.08 |
| Smoking | ||||
| Current smoker, n (%) | 91 (36) | 38 (16) | 48 (30) | 51 (22) |
| Never smoker, n (%) | 42 (17) | 159 (67) | 43 (27) | 108 (48) |
| Former smoker, n (%) | 120 (47) | 42 (18) | 69 (43) | 69 (30) |
| Hypertension, n (%) | 207 (81) | 186 (77) | 77 (48) | 61 (27) |
| Type 2 diabetes mellitus, n (%) | 71 (28) | 55 (23) | 8 (5) | 1 (0.4) |
| Dyslipidemia, n (%) | 190 (75) | 186 (77) | 91 (56) | 121 (53) |
| Hypertriglyceridemia, n (%) | 157 (62) | 113 (47) | 17 (10) | 10 (4) |
| Systolic blood pressure, mmHg, | 150±16 | 146±18 | 137±17 | 126±17 |
| Diastolic blood pressure, mmHg | 87±9 | 86±9 | 81±10 | 77±10 |
| Serum LDL-C, mg/dL | 132±36 | 132±32 | 134±32 | 128±30 |
| Serum HDL-C, mg/dL | 50±11 | 58±15 | 61±12 | 74±15 |
| Serum triglyceride, mg/dL | 190±137 | 155±90 | 101±47 | 83±33 |
| Blood glucose, mg/dL | 122±33 | 117±31 | 102±18 | 93±8 |
| C-reactive protein, mg/dL | 4.0±4.8 | 5.1±5.9 | 2.6±3.0 | 2.8±5.7 |
HDL-C, high-density lipoprotein cholesterol; LDL-C, low density lipoprotein cholesterol; MS, metabolic syndrome.
Unless otherwise indicated, values are expressed as mean±standard deviation.
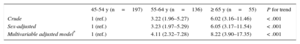
The association between age and EAT among participants without MS is shown in Table 2. The presence of EAT ≥ 5mm significantly increased with age. Compared with participants aged 45 to 54 years, those aged 55 to 64 years had a 4.11 times higher odds of high EAT (95% confidence interval [95%CI], 2.32-7.28; P for trend<.001) and participants aged 65 years or older had a 8.22 higher odds of high EAT (95%CI, 3.90–17.35; P for trend<.001). Mean EAT by age and sex, are presented in the Table of the supplementary material. For both men and women, older participants showed higher EAT than younger participants and the linear trend was statistically significant. These results were hardly changed by additional adjustment for MS criteria. On average, men had a higher EAT than women (5.75mm [95%CI, 5.50–5.99] for men and 5.43 [95%CI, 5.21–5.64] for women; adjusted mean difference 0.46mm [95%CI, 0.10–0.82]; P=.011).
Epicardial Adipose Tissue ≥ 5mm by Age Among Participants Without Metabolic Syndrome
| 45-54 y (n=197) | 55-64 y (n=136) | ≥ 65 y (n=55) | P for trend | |
|---|---|---|---|---|
| Crude | 1 (ref.) | 3.22 (1.96–5.27) | 6.02 (3.16–11.46) | < .001 |
| Sex-adjusted | 1 (ref.) | 3.23 (1.97–5.29) | 6.05 (3.17–11.54) | < .001 |
| Multivariable adjusted model* | 1 (ref.) | 4.11 (2.32–7.28) | 8.22 (3.90–17.35) | < .001 |
Values are expressed as odds ratios (95% confidence intervals).
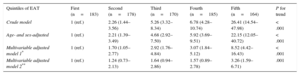
Higher EAT quintiles were associated with an increased prevalence of MS (Table 3). After adjustment for overweight, obesity, and waist-to-height ratio, the association remained statistically significant (odds ratio for the fifth vs the first quintile=3.26 [95%CI, 1.59–6.71]; P for trend=.001).
Metabolic Syndrome by Quintiles of EAT
| Quintiles of EAT | First (n=183) | Second (n=178) | Third (n=170) | Fourth (n=185) | Fifth (n=164) | P for trend |
|---|---|---|---|---|---|---|
| Crude model | 1 (ref.) | 2.26 (1.44–3.56) | 5.26 (3.32–8.34) | 6.78 (4.28–10.74) | 26.41 (14.54–47.98) | < .001 |
| Age- and sex-adjusted | 1 (ref.) | 2.21 (1.39–3.49) | 4.68 (2.92–7.50) | 5.92 (3.69–9.51) | 22.15 (12.05–40.72) | < .001 |
| Multivariable adjusted model 1* | 1 (ref.) | 1.70 (1.05–2.77) | 2.92 (1.76–4.84) | 3.07 (1.84–5.12) | 8.52 (4.42–16.43) | < .001 |
| Multivariable adjusted model 2** | 1 (ref.) | 1.24 (0.73–2.13) | 1.64 (0.94–2.86) | 1.57 (0.89–2.78) | 3.26 (1.59–6.71) | .001 |
EAT, epicardial adipose tissue.
Values are expressed as odds ratios (95% confidence intervals).
*Model 1: Adjusted by sex, age, smoking habit, body surface area (continuous), and C-reactive protein (continuous).
**Model 2: Model 1+overweight, obesity and waist-to-height ratio (continuous).
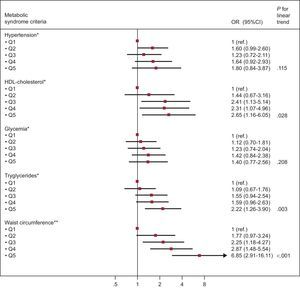
The Figure shows the association between increasing EAT quintiles and individual MS criteria. We observed that increasing EAT was associated with lower HDL-C, hypertriglyceridemia, and the presence of abdominal obesity after adjustment for potential confounders.
 for the different Adult Treatment Panel III/International Diabetes Federation metabolic syndrome criteria according to quintiles of epicardial adipose tissue. HDL, high-density lipoprotein; Q, quintile; OR, odds ratio; CI, confidence interval. *Adjusted by age, sex, smoking, body surface area (continuous), C-reactive protein (continuous), overweight, obesity, and waist-to-height ratio (continuous). **Adjusted by age, sex, smoking, body surface area (continuous), C-reactive protein (continuous), overweight, and obesity.")
Odds ratio (95% confidence interval) for the different Adult Treatment Panel III/International Diabetes Federation metabolic syndrome criteria according to quintiles of epicardial adipose tissue. HDL, high-density lipoprotein; Q, quintile; OR, odds ratio; CI, confidence interval. *Adjusted by age, sex, smoking, body surface area (continuous), C-reactive protein (continuous), overweight, obesity, and waist-to-height ratio (continuous). **Adjusted by age, sex, smoking, body surface area (continuous), C-reactive protein (continuous), overweight, and obesity.
For all models, the Hosmer-Lemeshow test showed an adequate goodness-of-fit.
DISCUSSIONOur study suggests that EAT increases with age among participants without MS. In addition, increased EAT was associated with a higher prevalence of MS and with lower HDL-C, hypertriglyceridemia, and the presence of abdominal obesity.
The MS is an important health problem in Spain since it has an estimated prevalence of 22.7%32 and, as is well known, it has been associated with an impaired metabolic and inflammatory profile.33
Interest has focused on EAT as a potential marker and modulator of cardiovascular function due to its location and proximity to the myocardium and coronary vasculature. Measurement of EAT by TTE, as an objective marker of visceral fat levels14,16,31 and as an effective predictor of the risk of developing MS,12,14,34 could be used to identify at-risk individuals.
General cutoff points have not yet been established for several reasons. It is known that EAT differs considerably among ethnic groups,11,24 due to differences in body fat distribution and cardiovascular risk. Another controversial point is the time in the cardiac cycle when EAT thickness may be more accurately measured. Some authors support measuring EAT during end-systole, as in our case, due to EAT deformation and underestimation during diastole. Others measure EAT during end-diastole in order to be consistent with cardiac computed tomography and magnetic resonance measurements. Last, there is a lack of data in general populations describing EAT and evaluating its distribution with age, and its association with subclinical markers of cardiometabolic impairment.
In our analysis, we chose 5mm as a cutoff point. Despite the absence of consensus, several authors have postulated that measurements > 5mm should represent a relevant cutoff to define increased EAT, especially in low-risk populations, although these values should be supported by larger studies.35,36
A large body of scientific-based evidence currently supports the relationship of EAT with impaired cardiometabolic profile11 and increased cardiovascular risk21–23 but most research has been conducted in selected populations or in patients referred to physicians. To our knowledge, scarce evidence is available on TTE-measured EAT in the general population and even less is available in Caucasian participants. In the general population, EAT volume has previously been measured with computed tomography in Caucasians.21,24,37–39 Only a few studies have measured echocardiographic EAT thickness in the general population in non-Caucasians,12,40 while, to our knowledge, only 1 recently published study has previously measured echocardiographically-measured EAT thickness and its association with MS in Caucasian participants from a general population.20 However, in this latter study, increased EAT was not associated with greater age and the association between EAT and MS was significant only among women. Moreover, in the PLIC study,20 women had significantly more EAT than men (4.00mm, 95%CI, 0.10–8.00 in men vs 4.5mm, 95%CI, 0.20–9.00 in women; P=.013) while in our study found the opposite. The reason for these differences could be that the PLIC study was actually composed mainly of postmenopausal women, with a median age of 68 years (interquartile range, 50-77.6).
We found that increased EAT thickness was associated with hypertriglyceridemia, low HDL-C, and abdominal obesity. On the other hand, compared with subcutaneous adipose tissue, EAT is rich in saturated fatty acids6 and has a greater capacity for free fatty acid release and uptake than any other visceral fat depot.41 Hence, EAT has been proposed to provide energy for the myocardium and at the same time to work as a buffer to protect the heart against exposure to excessively high fatty acid levels. It remains unclear whether EAT is increased due to dyslipidemia, in order to protect the heart from elevated triglyceride and cholesterol concentrations, or whether it simply reflects the excess of visceral adipose tissue that eventually causes MS and insulin resistance.
Limitations and StrengthsThis study has several limitations. First, our subsample cannot be considered exactly a representative sample of the population, given that the participants were selected from the original sample depending on the presence of MS, as described in the methods section. Second, multidetector computed tomography and cardiac magnetic resonance, the latter considered the gold standard, can certainly more accurately assess epicardial fat than TTE, since they measure the whole EAT volume instead of just 1 slice. In contrast, despite being less accurate, echocardiography is more accessible, less expensive, has excellent reproducibility,34 and has shown a good correlation with computed tomography and magnetic resonance.15,16,42
Our study also has several strengths. First, it was conducted with over 800 community-dwelling asymptomatic participants without CVD. Second, we decided to reclassify our patients with MS according to the International Diabetes Federation harmonized definition29 instead of the Adult Treatment Panel III classification27 initially planned at the time of study performance. The harmonized definition is currently more widely used and may reduce misclassification bias. Third, all TTEs were conducted by a trained cardiologist.
CONCLUSIONSIn a sample from a population-based study, echocardiographically measured EAT thickness increased with age and was directly associated with MS and reduced HDL-C, hypertriglyceridemia, and the presence of abdominal obesity as individual components. Further investigation is needed to determine the physiopathology of EAT, its association with CVD, and its usefulness in discriminating participants at high cardiovascular risk.
FUNDINGThis study was supported by the Government of Navarre and the Spanish Ministry of Health and Social Politics, Instituto de Salud Carlos III (Fondo de Investigación Sanitaria Pl 05/2364).
CONFLICTS OF INTERESTNone declared.
- -
Epicardial fat is the visceral fat depot of the heart and is able to secrete bioactive molecules with modulatory effects on the myocardium.
- -
Epicardial fat has been associated with MS and with incident and prevalent coronary artery disease.
- -
There are few data on echocardiographically-measured epicardial fat thickness in the general population.
- -
This study provides information about the behavior of epicardial fat thickness in asymptomatic CVD-free participants from the general population and its relationship with cardiometabolic profile.
- -
To our knowledge, this is the first study to measure echocardiographic epicardial fat thickness in a subsample from a representative sample of the Caucasian population.
The authors wish to thank the entire RIVANA study investigation team, who made possible the data collection; the Navarre Government for their support and funding of the RIVANA study, and last, all the participants, especially those who collaborated directly in Phase II of the RIVANA study, for their altruistic participation.