Patient- and procedure-related factors are known to be associated with aortic regurgitation after transcatheter aortic valve implantation. Nevertheless, this entity may also be caused by a specific device-host interaction due to the biomechanical properties of the valves, independently of clinical factors. We sought to elucidate the role of frame geometry in the occurrence of aortic regurgitation after Medtronic CoreValve and Edwards SAPIEN valve implantation.
MethodsWe conducted an observational study encompassing 134 patients undergoing transcatheter aortic valve implantation with the Medtronic CoreValve and Edwards SAPIEN valve. Frame analysis was performed at 3 predefined levels of both valves by rotational angiography using dedicated motion compensation software. A distinction was made between patients with no-to-mild and moderate-to-severe aortic regurgitation by echocardiography.
ResultsBaseline characteristics were similar between the 2 valves. Despite greater use of predilation in the CoreValve (95.2% vs 82.0%; P=.012), more oversizing (perimeter, 114±7% vs 103±7%; P<.001), and the same depth of implantation (noncoronary sinus, 7±4 vs 8±2mm; left coronary sinus, 8±4 vs 8±2mm), it was less expanded and more eccentric than the Edwards SAPIEN (83±7% vs 92±4%; P<.001 and 82±8% vs 95±3%; P<.001, respectively) and when eccentricity was adjusted for the patient's annulus eccentricity (4±13% vs 21±11%; P<.001). Eccentricity and adjusted eccentricity were associated with moderate-to-severe aortic regurgitation.
ConclusionsIndependently of patient- and procedure-related factors, there is a device-specific device-host interaction that explains aortic regurgitation after transcatheter aortic valve implantation.
Keywords
Transcatheter aortic valve implantation (TAVI) is increasingly used for patients with severe aortic stenosis at high risk for surgical valve replacement and has been shown to be safe and effective compared with aortic valve replacement in such patients.1–5 Nevertheless, aortic regurgitation (AR) often occurs and is usually paravalvular. It is more frequent after the implantation of the self-expanding Medtronic CoreValve System (MCS) than the balloon-expandable Edwards SAPIEN valve (ESV).6–8
Patient- and procedure-related variables such as the amount and distribution of aortic root calcification, annular dimensions, the depth of implantation, and sizing have been identified as determinants of AR post-TAVI.9,10 Nevertheless, AR may also stem from a specific device-host interaction due to the intrinsic biomechanical properties of valves that in turn may affect frame geometry and the degree of expansion contributing to AR. There is evidence from multislice computed tomography (MSCT) analysis in selected patients that noncircular expansion and malapposition is more frequent after MCS than ESV valve implantation.11–14 To further elucidate the role of frame geometry and degree of expansion in relation to established patient- and procedure-related variables associated with AR, we incorporated rotational angiography with dedicated motion compensation 3-dimensional image reconstruction immediately after TAVI.15 The objective of this study was to assess and compare the geometric findings by rotational angiography between the MCS and ESV valve and its association with AR.
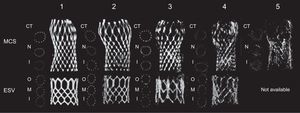
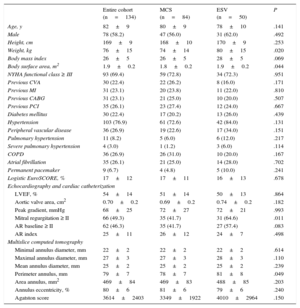
METHODSPatientsThis was an prospective observational study with a study population of 150 consecutive patients with symptomatic severe aortic stenosis who underwent TAVI with the MCS or ESV and who underwent rotational angiography.15 Only patients with a single valve implantation (ie, patients with a valve-in-valve procedure were excluded) in a native aortic valve (ie, patients with failed bioprosthesis were excluded) and sufficient image quality for frame assessment (grade 1, 2 or 3) were included using the following score: grade 1, excellent image quality (struts visible without artifacts); grade 2, struts clearly visible, distinction between struts and artifacts possible; grade 3, struts visible but in some regions the distinction between struts and artifacts cannot be made; grade 4, degraded (struts are blurred and distorted), and grade 5, strongly degraded (struts and artefacts cannot be distinguished) (Figure 1). A total of 16 patients (MCS 14, ESV 2) were excluded from the analysis because of image quality grade 4 (8 patients) and 5 (8 patients). Therefore, the total study population was 134 (MCS 84, ESV 50).
 to grade 5 (worst). CT, central coaptation of the leaflets; ESV, Edwards SAPIEN valve; I, inflow; M, mid segment; MCS, Medtronic CoreValve system; N, nadir; O, outflow.")
All patients underwent TAVI under general anesthesia via the femoral or subclavian artery or left ventricular apex after heart-team discussion. The MSCT was used for sizing in all patients except 9.16 Patients were first seen at the outpatient clinic and gave written informed consent for anonymized prospective data collection for clinical research purpose (TAVI Care and Cure project, MEC-2014-277).
Rotational Angiography, 3-dimensional Reconstruction and Frame AnalysisRotational angiography was performed immediately after TAVI using the Artis zee angiographic C-arm system (Siemens Healthcare GmbH; Forchheim, Germany) with a 20×20cm detector and isotropic pixel length of 180μm. A total of 133 images were acquired in 5seconds along a 198° arc (99° right anterior oblique to 99° left anterior oblique view) during breath hold at a detector entrance dose of 0.36μm per frame.
Three-dimensional ReconstructionFrom the projection images, a motion-compensated 3-dimensional image was reconstructed with prototype software (Siemens Healthcare GmbH) with a matrix of 256 and 0.5mm3 voxel size using a standard operating procedure.15 In summary, an electrocardiogram-gated reconstruction was made using the end-diastolic phase at 75% of the cardiac cycle since at that moment there is theoretically less motion. The electrocardiogram-gated reconstruction was used as a reference image for estimating cardiac motion. The estimated motion was compensated in a final reconstruction step. The total process took approximately 5minutes. The 3-dimensional reconstruction of the frame was then processed (eg, cropping) before analysis. Cross-sectional images were used for frame analysis.
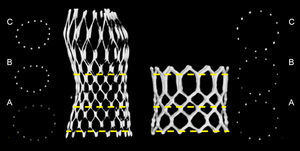
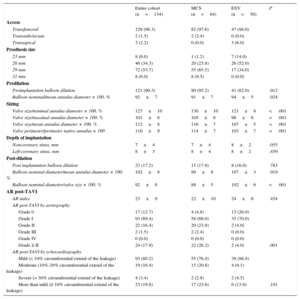
Frame AnalysisFrame analysis was performed at 3 predefined levels of both valves. The dimensions of the MCS were measured at the inflow (0mm), nadir of leaflets (12mm from inflow), and central coaptation (24mm from inflow), as previously described.13 The dimensions of the ESV were measured at the inflow (0mm), mid segment (at 50% for XT, at the 3rd cross section for S3) (Figure 2), and outflow (top). At each of these levels, the minimum diameter (Dmin), maximum diameter (Dmax), area and perimeter were manually measured using the center point of the strut or struts (Figure 2).

Valve sizing was defined by dividing the nominal valve size by the MSCT-derived annulus measures (Dmin, Dmax, Dmean and perimeter)×100 (%). The degree of frame expansion was calculated by dividing the measured perimeter by the nominal perimeter of that level (perimeterframe-measured/perimeterframe-nominal), as well as by relating the degree of expansion to the annulus perimeter (ie, adjusted degree of expansion) by calculating: perimetervalve-measured/perimeterannulus. For the MCS valve, the following nominal perimeters were used: inflow, 72.3, 81.7, 91.1 and 97.4mm for 23, 26, 29 and 31mm, respectively; nadir, 64.4, 75.4, 79.8 and 83.9mm for 23, 26, 29 and 31mm, respectively, and central coaptation, 68.8, 69.1, 72.6 and 76.3mm for 23, 26, 29 and 31mm, respectively (source: Medtronic Inc.; Mineapolis, United States). For the ESV, the calculated nominal perimeter of the inflow (ie, π×Dnominal) was used for all levels given the tubular shape of the ESV. The eccentricity of the frame was calculated by Dframe-min/Dframe-max at all levels. The eccentricity at the nadir (MCS) and mid segment (ESV) was adjusted to the eccentricity of the native valve using the following equation: (eccentricity nadir or mid segment–eccentricity native annulus/eccentricity native annulus)×100. This was done since this part of the frame is closer to the patients’ native annulus than the other parts of the frame.
Assessment of Aortic RegurgitationContrast angiography and Doppler echocardiography were used to assess AR immediately after TAVI and at discharge. With respect to contrast angiography, AR severity was defined using Sellers’ classification (0=none, 1=mild, 2=moderate, 3=moderate to severe, and 4=severe).17 For that purpose, a predefined angiography protocol was used that consisted of the injection of 20ml undiluted iodixanol (Visipaque™) at a flow rate of 20ml/s via a 6-Fr pigtail that was positioned just above the bioprosthetic leaflets. Cine runs were recorded at a speed of 30 frames/s. Two observers scored the angiograms independently from each another. If there was a discrepancy, consensus was reached by including a third observer. The intra- and interobserver variability for the assessment of AR post-TAVI according to Sellers’ classification were k = 0.70 and k = 0.78, respectively. A distinction was made between patients with Sellers’ grade 0-1 and those with Sellers’ grade 2-4.
Transthoracic Doppler echocardiography was performed before discharge. The AR severity was defined by the circumferential extent of the Doppler signal at the inflow of the MCS frame in the parasternal short axis view using the VARC-2 (Valve Academic Research Consortium-2) criteria.18 Echocardiography of sufficient quality to assess AR was available in 119 out of the 134 patients (89%). A distinction was made between patients with no AR and mild AR (< 10%) and those with moderate and severe AR (10% to 29% and ≥ 30%).
Statistical AnalysisCategorical variables are presented as frequencies and percentages and compared with the Pearson chi-square test. The normality of the continuous variables distributions was assessed using the Kolmogorov-Smirnov test and, since all the variables studied were (nearly) normally-distributed results, are presented as means±standard deviation and compared with the Student t test. Interobserver variability was calculated using intraclass correlation (Table 1 of the supplementary material). Statistical analyses were performed using SPSS software version 21.0 (IBM SPSS Statistics for Windows, Version 21.0; Armonk, New York, United States).
The main analysis consisted of the comparison of the geometry of the MCS and the ESV. The secondary analysis consisted of the assessment of the relationship between the geometry of the frame of both valves and AR. A distinction was made between (none or mild (< 10%) vs moderate or severe (10% to 29% and ≥ 30%) AR based on the short axis view of the echocardiography-Doppler examination before discharge (VARC-2 criteria).18
RESULTSThe baseline clinical and procedural data of all patients and of those treated with the MCS or ESV valve are summarized in Tables 1 and 2. By univariable analysis, there were no differences between patients treated with the MCS or ESV valve except for a lower body weight (74±14 kg vs 80±15 kg; P=.02), lower body surface area (1.8±0.2 m2 vs 1.9±0.2 m2; P=.044), a lesser prevalence of mitral regurgitation ≥ II at baseline (41.7% vs 64.6%; P=.021), and smaller annulus perimeter (78±7 mm vs 81±8 mm; P=.049) in patients treated with the MCS valve.
Baseline Characteristics
| Entire cohort (n=134) | MCS (n=84) | ESV (n=50) | P | |
|---|---|---|---|---|
| Age, y | 82±9 | 80±9 | 78±10 | .141 |
| Male | 78 (58.2) | 47 (56.0) | 31 (62.0) | .492 |
| Height, cm | 169±9 | 168±10 | 170±9 | .253 |
| Weight, kg | 76±15 | 74±14 | 80±15 | .020 |
| Body mass index | 26±5 | 26±5 | 28±5 | .069 |
| Body surface area, m2 | 1.9±0.2 | 1.8±0.2 | 1.9±0.2 | .044 |
| NYHA functional class ≥ III | 93 (69.4) | 59 (72.8) | 34 (72.3) | .951 |
| Previous CVA | 30 (22.4) | 22 (26.2) | 8 (16.0) | .171 |
| Previous MI | 31 (23.1) | 20 (23.8) | 11 (22.0) | .810 |
| Previous CABG | 31 (23.1) | 21 (25.0) | 10 (20.0) | .507 |
| Previous PCI | 35 (26.1) | 23 (27.4) | 12 (24.0) | .667 |
| Diabetes mellitus | 30 (22.4) | 17 (20.2) | 13 (26.0) | .439 |
| Hypertension | 103 (76.9) | 61 (72.6) | 42 (84.0) | .131 |
| Peripheral vascular disease | 36 (26.9) | 19 (22.6) | 17 (34.0) | .151 |
| Pulmonary hypertension | 11 (8.2) | 5 (6.0) | 6 (12.0) | .217 |
| Severe pulmonary hypertension | 4 (3.0) | 1 (1.2) | 3 (6.0) | .114 |
| COPD | 36 (26.9) | 26 (31.0) | 10 (20.0) | .167 |
| Atrial fibrillation | 35 (26.1) | 21 (25.0) | 14 (28.0) | .702 |
| Permanent pacemaker | 9 (6.7) | 4 (4.8) | 5 (10.0) | .241 |
| Logistic EuroSCORE, % | 17±12 | 17±11 | 16±13 | .678 |
| Echocardiography and cardiac catheterization | ||||
| LVEF, % | 54±14 | 51±14 | 50±13 | .864 |
| Aortic valve area, cm2 | 0.70±0.2 | 0.69±0.2 | 0.74±0.2 | .182 |
| Peak gradient, mmHg | 68±25 | 72±27 | 72±21 | .993 |
| Mitral regurgitation ≥ II | 66 (49.3) | 35 (41.7) | 31 (64.6) | .011 |
| AR baseline ≥ II | 62 (46.3) | 35 (41.7) | 27 (57.4) | .083 |
| AR index | 25±11 | 26±12 | 24±7 | .498 |
| Multislice computed tomography | ||||
| Minimal annulus diameter, mm | 22±2 | 22±2 | 22±2 | .614 |
| Maximal annulus diameter, mm | 27±3 | 27±3 | 28±3 | .110 |
| Mean annulus diameter, mm | 25±2 | 25±2 | 25±2 | .239 |
| Perimeter annulus, mm | 79±7 | 78±7 | 81±8 | .049 |
| Area annulus, mm2 | 469±84 | 469±83 | 488±85 | .203 |
| Annulus eccentricity, % | 80±6 | 81±6 | 79±6 | .240 |
| Agatston score | 3614±2403 | 3349±1922 | 4010±2964 | .150 |
AR, aortic regurgitation; CABG, coronary artery bypass; COPD, chronic obstructive pulmonary disease; CVA, cerebrovascular event; ESV, Edwards SAPIEN valve; LVEF, left ventricular ejection fraction; MCS, Medtronic CoreValve system; MI, myocardial infarction; NYHA, New York Heart Association; PCI, percutaneous coronary intervention.
Data are expressed as no. (%) or mean±standard deviation
Procedural Details
| Entire cohort (n=134) | MCS (n=84) | ESV (n=50) | P | |
|---|---|---|---|---|
| Access | ||||
| Transfemoral | 129 (96.3) | 82 (97.6) | 47 (94.0) | |
| Transsubclavian | 2 (1.5) | 2 (2.4) | 0 (0.0) | |
| Transapical | 3 (2.2) | 0 (0.0) | 3 (6.0) | |
| Prosthesis size | ||||
| 23 mm | 8 (6.0) | 1 (1.2) | 7 (14.0) | |
| 26 mm | 46 (34.3) | 20 (23.8) | 26 (52.0) | |
| 29 mm | 72 (53.7) | 55 (65.5) | 17 (34.0) | |
| 31 mm | 8 (6.0) | 8 (9.5) | 0 (0.0) | |
| Predilation | ||||
| Preimplantation balloon dilation | 121 (90.3) | 80 (95.2) | 41 (82.0) | .012 |
| Balloon nominal/mean annulus diameter × 100, % | 92±7 | 91±7 | 94±5 | .024 |
| Sizing | ||||
| Valve size/minimal annulus diameter × 100, % | 127±10 | 130±10 | 121±8 | <.001 |
| Valve size/maximal annulus diameter × 100, % | 101±8 | 105±8 | 96±6 | <.001 |
| Valve size/mean annulus diameter × 100, % | 112±8 | 116±7 | 107±5 | <.001 |
| Valve perimeter/perimeter native annulus × 100 | 110±9 | 114±7 | 103±7 | <.001 |
| Depth of implantation | ||||
| Noncoronary sinus, mm | 7±4 | 7±4 | 8±2 | .055 |
| Left-coronary sinus, mm | 8±3 | 8±4 | 8±2 | .459 |
| Post-dilation | ||||
| Post implantation balloon dilation | 23 (17.2) | 15 (17.9) | 8 (16.0) | .783 |
| Balloon nominal diameter/mean annulus diameter × 100, % | 102±8 | 99±8 | 107±3 | .019 |
| Balloon nominal diameter/valve size × 100, % | 92±8 | 88±5 | 102±6 | <.001 |
| AR post-TAVI | ||||
| AR index | 23±9 | 22±10 | 24±6 | .454 |
| AR post TAVI by aortography | ||||
| Grade 0 | 17 (12.7) | 4 (4.8) | 13 (26.0) | |
| Grade I | 93 (69.4) | 58 (69.0) | 35 (70.0) | |
| Grade II | 22 (16.4) | 20 (23.8) | 2 (4.0) | |
| Grade III | 2 (1.5) | 2 (2.4) | 0 (0.0) | |
| Grade IV | 0 (0.0) | 0 (0.0) | 0 (0.0) | |
| Grade ≥ II | 24 (17.9) | 22 (26.2) | 2 (4.0) | .001 |
| AR post-TAVI by echocardiography | ||||
| Mild (< 10% circumferential extend of the leakage) | 93 (80.2) | 55 (76.4) | 38 (86.4) | |
| Moderate (10%-29% circumferential extend of the leakage) | 19 (16.4) | 15 (20.8) | 4 (9.1) | |
| Severe (> 30% circumferential extend of the leakage) | 4 (3.4) | 2 (2.8) | 2 (4.5) | |
| More than mild (≥ 10% circumferential extend of the leakage) | 23 (19.8) | 17 (23.6) | 6 (13.6) | .191 |
AR, aortic regurgitation; ESV, Edwards SAPIEN valve; MCS, Medtronic CoreValve system; TAVI, transcatheter aortic valve implantation.
Data are expressed as no. (%) or mean±standard deviation
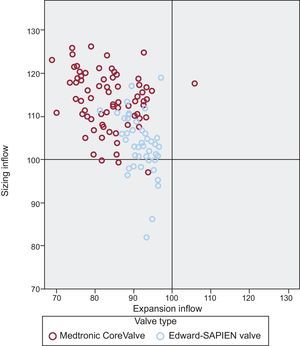
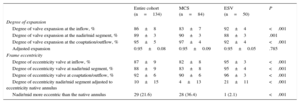
From a procedural perspective, patients treated with the MCS valve more often underwent balloon predilation than patients treated with the ESV valve (95.2% vs 82.0%; P=.012), albeit with a smaller balloon in relation to the patient's annulus (mean balloon diameter/mean diameter annulus×100 MCS vs ESV: 91±7% vs 94±5%; P=.024), and also received a larger valve relative to all MSCT-derived annulus measures compared with patients receiving the ESV (MCS vs ESV: Dmin, 130±10 mm; vs 121±8 mm; P<.001; Dmax, 105±8 mm vs 96±6 mm; P<.001; Dmean, 116±7 mm vs 107±5 mm; P<.001, perimeter 114±7 vs 103±7; P<.001) (Figure 3). After valve implantation, the depth of implantation was similar between the 2 groups as was the use of post-dilation (MCS, 17.9% vs ESV, 16%; P=.783), although the balloon used for post-dilation in the MCS group was smaller relative to the mean diameter of the patient's annulus (99±8 mm vs 107±3 mm; P=.019) and nominal valve size (88±5 mm vs 102±6 mm; P<.001).
 and expansion (perimeter measured valve at the inflow/nominal valve perimeter at the inflow level×100).")
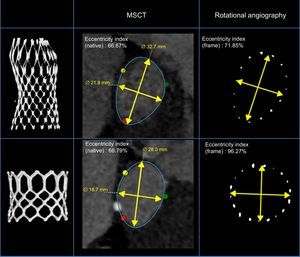
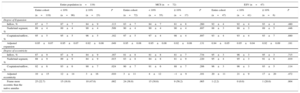
Details of the frame geometry of the 2 valves are summarized in Table 3. The degree of expansion of the MCS valve was less at its inflow compared with the ESV (83±7 vs 92±4; P<.001). When we related the degree of expansion to the patient's annulus (adjusted expansion), no difference was found between valves either at the inflow or at the nadir/mid-segment (MCS vs ESV, 0.95±0.09 vs 0.95±0.05 and 0.91±0.07 vs 0.91±0.06, respectively) (Table 3). The MCS valve was more elliptical than the ESV at all levels (inflow, 82±8 vs 95±3; P<.001; nadir/mid segment, 83±8 vs 95±4; P<.001; coaptation/outflow, 90±6 vs 96±3; P<.001). This was also the case for the adjusted eccentricity (MCS, 4±13 vs ESV, 21±11; P<.001), which was more prevalent after MCS than ESV implantation (MCS, 36% vs 2% P<.001) (Figure 4).
Frame Analysis by Rotational Angiography
| Entire cohort (n=134) | MCS (n=84) | ESV (n=50) | P | |
|---|---|---|---|---|
| Degree of expansion | ||||
| Degree of valve expansion at the inflow, % | 86±8 | 83±7 | 92±4 | <.001 |
| Degree of valve expansion at the nadir/mid segment, % | 89±3 | 90±3 | 88±3 | .001 |
| Degree of valve expansion at the coaptation/outflow, % | 95±5 | 97±4 | 92±4 | <.001 |
| Adjusted expansion | 0.95±0.08 | 0.95±0.09 | 0.95±0.05 | .785 |
| Frame eccentricity | ||||
| Degree of eccentricity valve at inflow, % | 87±9 | 82±8 | 95±3 | <.001 |
| Degree of eccentricity valve at nadir/mid segment, % | 88±9 | 83±8 | 95±4 | <.001 |
| Degree of eccentricity valve at coaptation/outflow, % | 92±6 | 90±6 | 96±3 | <.001 |
| Degree of eccentricity nadir/mid segment adjusted to eccentricity native annulus | 10±15 | 4±13 | 21±11 | <.001 |
| Nadir/mid more eccentric than the native annulus | 29 (21.6) | 28 (36.4) | 1 (2.1) | <.001 |
ESV, Edwards SAPIEN valve; MCS, Medtronic CoreValve system.
Data are expressed as no. (%) or mean±standard deviation
 treated with the Medtronic CoreValve and Edwards SAPIEN valve. Left panel: 3-dimensional rendered image of frame implanted. Right panel: frame geometry at the level of the nadir (Medtronic CoreValve) and mid segment (Edwards SAPIEN valve) by rotational angiography post transcatheter aortic valve implantation. Mid panel: cross-sectional view and eccentricity index of the Medtronic CoreValve (above) and Edwards SAPIEN valve (below) post transcatheter aortic valve implantation. MSCT, multislice computed tomography.")
Example of the aortic annulus of 2 patients with similar annulus eccentricity (multislice computed tomography) treated with the Medtronic CoreValve and Edwards SAPIEN valve. Left panel: 3-dimensional rendered image of frame implanted. Right panel: frame geometry at the level of the nadir (Medtronic CoreValve) and mid segment (Edwards SAPIEN valve) by rotational angiography post transcatheter aortic valve implantation. Mid panel: cross-sectional view and eccentricity index of the Medtronic CoreValve (above) and Edwards SAPIEN valve (below) post transcatheter aortic valve implantation. MSCT, multislice computed tomography.
Separate analysis for the ESV-XT and ESV-S3 are summarized in Tables 2–5 of the supplementary material. Despite a lesser use of balloon predilation and less oversizing, a higher degree of expansion of the S3 compared with XT was noted and a similar degree of circularity with a trend to less post-dilation.
Aortic Regurgitation Post-implantation and Before DischargeBy contrast angiography, the prevalence of AR grade 0-1 and 2-4 after MCS implantation was 73.8% and 26.2% and was 96% and 4%, respectively, after ESV implantation. By echocardiography at discharge, the prevalence of no-to-mild and moderate-to-severe AR was 76.4% and 23.6% after MCS implantation and was 86.4% and 13.6% after ESV implantation (Table 2). Table 4 summarizes the relationship between frame geometry and AR post-TAVI (echocardiography at discharge, VARC-2). Aortic regurgitation ≥ 10% was related to the adjusted degree of expansion (the lesser the expansion, the more AR) as well as with the eccentricity and adjusted eccentricity of the frame at the nadir (MCS)/mid segment (ESV) and coaptation (MCS)/outflow (ESV). A similar trend was seen when we separately analyzed patients who received the MCS or ESV, but the sample size precludes firm conclusions.
Relation Between Frame Geometry and Aortic Regurgitation by Echocardiography
| Entire population (n=119) | MCS (n=72) | ESV (n=47) | ||||||||||
|---|---|---|---|---|---|---|---|---|---|---|---|---|
| Entire cohort | < 10% | ≥ 10% | P | Entire cohort | < 10% | ≥ 10% | P | Entire cohort | < 10% | ≥ 10% | P | |
| (n=119) | (n=96) | (n=23) | (n=72) | (n=55) | (n=17) | (n=47) | (n=41) | (n=6) | ||||
| Degree of Expansion | ||||||||||||
| Inflow, % | 87±7 | 87±7 | 84±9 | .113 | 83±7 | 84±7 | 81±8 | .260 | 92±4 | 92±4 | 93±4 | .480 |
| Nadir/mid segment, % | 89±4 | 89±4 | 90±4 | .509 | 90±4 | 90±4 | 90±4 | .897 | 88±3 | 88±3 | 89±5 | .446 |
| Coaptation/outflow, % | 95±5 | 95±5 | 96±5 | .182 | 97±5 | 97±4 | 98±4 | .897 | 93±4 | 93±4 | 93±7 | .880 |
| Adjusted expansion | 0.95±0.07 | 0.95±0.07 | 0.92±0.08 | .049 | 0.95±0.08 | 0.95±0.08 | 0.92±0.08 | .131 | 0.94±0.05 | 0.95±0.04 | 0.92±0.09 | .181 |
| Degree of eccentricity | ||||||||||||
| Inflow, % | 87±9 | 87±9 | 84±9 | .167 | 81±8 | 81±8 | 81±7 | .734 | 95±3 | 96±3 | 95±3 | .715 |
| Nadir/mid segment, % | 88±9 | 89±9 | 84±9 | .015 | 83±8 | 84±8 | 81±9 | .220 | 95±4 | 95±3 | 91±6 | .019 |
| Coaptation/outflow, % | 92±6 | 93±6 | 90±7 | .024 | 90±7 | 91±6 | 88±7 | .206 | 96±3 | 96±3 | 93±5 | .114 |
| Adjusted eccentricity | 10±15 | 12±14 | 3±16 | .010 | 3±11 | 4±12 | −1±9 | .101 | 20±11 | 21±9 | 17±20 | .472 |
| Frame more eccentric than the native annulus | 25 (22.7) | 15 (16.9) | 10 (47.6) | .002 | 24 (36.9) | 15 (30.6) | 9 (56.2) | .065 | 1 (2.2) | 0 (0.0) | 1 (20.0) | .004 |
ESV, Edwards SAPIEN valve; MCS, Medtronic CoreValve system.
Negative value denotes that the frame is more elliptical than native annulus.
Data are expressed as no. (%) or mean±standard deviation.
The main finding of the present study is that the frame of the self-expanding MCS valve is less expanded at its inflow and overall is more eccentric than the balloon-expandable ESV. This was also true when eccentricity was corrected for the eccentricity of the patient's annulus, which was found to be associated with a higher prevalence of AR by both angiography and echocardiography. These data indicate the existence of a device-specific device-host interaction that is associated with AR post-TAVI.
We acknowledge that these findings stem from an observational study with limited sample size and uneven distribution of patients per valve in addition to the absence of randomized allocation to one valve or the other, thereby precluding direct comparison of valve morphology and function. Nevertheless, there were no differences in baseline characteristics, including aortic root anatomy between patients receiving the MCS or ESV valve. Interestingly, balloon dilation before valve implantation was performed more often in patients receiving the MCS valve (albeit with a smaller balloon relative to the patient's annulus) in addition to a higher degree of oversizing (valve size relative to all MSCT-derived measures of the patient's annulus) in comparison with patients treated with the ESV. In addition, we found a higher incidence of AR ≥ 2 by angiography after MCS but no difference between the 2 valves when using echocardiography. This may be explained by the intrinsic differences between the 2 techniques for assessing AR in addition to their timing (angiography immediately after TAVI, echocardiography before discharge). In addition, the change may have played a role given the uneven distribution of patients for AR assessment (MCS, 84; ESV, 50).
The current clinical findings in patients with aortic stenosis who underwent TAVI are underscored by the experimental work of Tzamtzis et al.19 In a study using finite element analysis to study hoop force of the MCS and ESV-XT for different dimensions and rigidity of the left ventricle outflow tract, these authors found that the ESV had a stronger hoop force than the MCS for any left ventricle outflow tract diameter, independently of left ventricle outflow tract rigidity.19 This is not surprising since such a biomechanical property is mandatory for the safe implantation of the ESV valve, which is based upon the plastic deformation and, therefore the frame must withstand the forces of recoil of the left ventricle outflow tract after deflation of the delivery balloon, thereby ensuring valve geometry and function. A lesser hoop force of the self-expanding or super-elastic MCS valve is underscored by a clinical observation reporting that aortic root calcification had a higher discriminatory power for the prediction of balloon dilation after MCS valve implantation than annulus dimensions or the prosthesis-to-annulus ratio.12 Differences in biomechanical properties may also explain the current and previously reported difference in eccentricity between the MCS and ESV valves. In a series of 30 patients, symmetrical expansion of the MCS valve was seen in only 5 patients (17%), while circularity of the ESV was seen in all but 2 out of 89 patients (98%) and was independent of the native annular anatomy.13,14
The aggregate of these clinical and experimental data confirm and explain why the MCS frame conforms to the geometry of the patient's annulus, while the ESV dictates the geometry of the annulus and its contribution to the development of AR. Less AR after ESV implantation has consistently been reported by a number of observational studies and 1 randomized clinical trial directly comparing MCS and ESV.8–10 The question is to what extent does device-host interaction play a role in AR post-TAVI on top of patient- and procedure-related variables such as the amount and distribution of calcium, sizing, and depth of implantation? The present study lacked the power to analyze the contribution to AR relative to the aforementioned patient- and procedure-related variables due to sample size (ie, power) but also because of the equal distribution of baseline and procedural characteristics between patients treated with the MCS and ESV. Nevertheless, a frame with sufficient hoop force at least eliminates one of the components of the equation in the attempt to reduce of AR post-TAVI as seen with the ESV and novel generation devices.20,21
In this study, rotational angiography was used to assess frame geometry using dedicated prototype software for motion compensation that has been validated with MSCT.15 The advantage of rotational angiography over MSCT is that it is available on-line in the catheterization or hybrid operating room. Currently, it is unknown how and when to incorporate this information in the decision for further therapeutic measures such as additional balloon dilation, although a few clinical reports have demonstrated such a potential role and benefit.22 Their need may also be questioned with the advent of novel and more advanced TAVI technologies allowing precise positioning and repositioning if needed to reduce and even eliminate AR.20–24 The data of this study nevertheless indicate the need to either incorporate the calcium load of the aortic root into the sizing matrix in particular when using the MCS and/or to apply sufficient hoop force in the development of future catheter-based valves.
CONCLUSIONSRotational angiography is an easy, accurate, and relatively rapid method to assess frame geometry in the catheterization laboratory. After MCS implantation, frame eccentricity at the annulus is common and not necessarily associated with an increase in AR unless eccentricity is also increased from baseline. After ESV implantation, circularity is the rule and precludes significant AR.
CONFLICTS OF INTERESTR. Rodríguez-Olivares receives a grant from the Spanish Society of Cardiology. G. Lauritsch works for Siemens Healthcare GmbH, Forchheim, Germany.
This work was supported by a grant from the Spanish Society of Cardiology.
The concepts and information presented in this paper are based on research and are not commercially available. The product names and brands referred to are the property of their respective trademark holders.