Keywords
INTRODUCTION
Degenerative aortic stenosis (AS) is a highly prevalent disease in developed countries and is the cause of most aortic valve replacements; in the United States alone, more than 70 000 patients undergo this procedure every year.1 Between 2% and 3% of adults over 65 years of age present this disease, while there is irregular enlargement of the aortic valve without outflow tract obstruction (aortic sclerosis) in approximately 25% of older people.2 As a result, a large increase in this disease is expected due to the improvements in health that are leading to the gradual aging of the population.
For many years, degenerative AS was considered an unavoidable consequence of aging and was thought to be a passive process secondary to calcium deposition in the aortic valve. At present, although its etiology is not known with any certainty, several authors have pointed out that it is associated with the same risk factors as atherosclerosis; thus, it is more frequent in patients with hypercholesterolemia, hypertension, a smoking habit, and diabetes mellitus.3
Furthermore, histological similarities have recently been found between aortic valve stenosis and atherosclerotic plaque, leading to the hypothesis that degenerative AS is an inflammatory process similar to atherosclerosis. Several studies have demonstrated that atherosclerosis occurs in the aortic valve, followed by calcium deposition and the expression of biomarkers specific for bone matrix, such as osteopontin.4-9 Similarly, it has been documented that endothelial dysfunction, with lipid and protein accumulation—apolipoprotein (apo) B, apo(a) and apo-E—10,11 plays an important role in the onset of aortic stenosis; oxidative stress with modification of the nitric oxide enzymes is also relevant.12,13 However, some data indicate that its pathogenic mechanism is not exactly the same as that of atherosclerosis; thus, in adults with severe aortic stenosis, only 50% have significant coronary artery disease. In turn, the majority of patients with coronary artery disease do not have AS.2 Furthermore, some studies assessing the effect of statins on degenerative AS have found a reduction in coronary heart disease without changes in the course of degenerative AS.14,15
Thus, greater understanding of the pathogenesis of degenerative AS is needed as a first step in establishing prevention measures for this disease. One of the problems that has been encountered in studies on AS and other disorders to date, is that they only study alterations of 1 protein or a small number of them at a time, which leads to biased and incomplete data on the actual physiological state of a biological sample. The study of individual proteins, although still essential, has currently been supplanted by proteomic strategies that can analyze all the proteins in a sample.16
Clinical proteomics is a discipline that uses proteomic tools for the diagnosis, prognosis, treatment, and follow-up of human diseases. This approach does not generate individual data, referring to a single molecule, but global data, simultaneously describing hundreds or thousands at the same time. This is due to the fact that the new technologies— matrix-assisted laser desorption/ionization (MALDI)-time of flight/time of flight (TOF/ TOF), liquid chromatography-mass spectrometry (MS), 2-dimensional gel electrophoresis (DIGE), MS-IMAGING, etc—characterize thousands of molecular species (proteins, lipids, metabolites, drugs) in each analysis and generate joint profiles that indicate the global state of a sample.17
Since the proteins are essential to the correct functioning of the aortic valve, their identification and characterization using proteomic tools is vital to the deeper understanding of the physiology of the aortic valve and its possible disorders.
The aim of this study was to obtain a standard and easily reproducible protocol for studying and identifying the different proteins that compose the proteome of the aortic valve and that of the stenotic aortic valve. New information about these proteins will deepen our understanding of the physiology and etiology of this disease.
METHODS
Patient Selection
After providing informed consent, patients who had been admitted to the Hospital Virgen de la Salud (Toledo, Spain) Surgical Unit and undergone aortic valve replacement were included and their extracted valves used to develop and test the study protocol. Furthermore, apparently healthy valves from autopsies conducted in the Department of Pathological Anatomy of the same hospital were used as controls (Table 1). Baseline characteristics were recorded (age, sex, smoking habit, diabetes mellitus, hypertension, hyperlipidemia, obesity) (Table 2). The protocol was tested in a group of 10 patients and validated in 10 control subjects.


Processing of Aortic Valves. Protein Extraction and Lysis
The stenotic valves removed during aortic valve replacement procedures were processed in the following way. The aortic valves were kept at 4oC in RPMI medium from the time of extraction to their arrival (<2 h) at the Hospital Nacional de Parapléjicos (Toledo, Spain). Once in the laboratory, all manipulations were conducted at 4oC.
First, they were washed twice in phosphate-buffered saline to eliminate blood contaminants. To obtain the protein components of the valve, a fragment of the selected valve was frozen in liquid nitrogen and homogenized using a mortar. A total of 0.1-0.3 g of this tissue was resuspended in 400 µL of protein-extraction buffer (phosphate-buffered saline, 2.5 mmol dithiothreitol, 0.01% triton, 0.01% broad-spectrum protease inhibitors).18 After the resulting homogenate was centrifuged, the supernatant corresponding to the soluble protein extract was collected19,20 (350 µL) and quantified using the Bradford-Lowry method (Biorad protein assay),21 thus obtaining a concentration of 0.4-1 µg/ µL of total protein in each extract.
The proteins were denatured in dissociation buffer (0.5 mol of 2-amino-2-hydroxymethyl-1.3 propanediol at pH 8.0, SDS 10%, glycerol, B-mercaptoethanol, 0.02% bromophenol blue), heated for 5 min at 100oC, and subsequently loaded in the gel.
2-Dimensional Gel Electrophoresis
All the reagents and equipment used in the development of these techniques have been described in detail elsewhere.18-20 A total of 250 µg of the protein extract obtained was desalted by filtering the sample through Spin-X columns (Costar). In a second step, the sample was cleaned and precipitated using the 2D-Clean-up kit (GE Healthcare), following the manufacturer's instructions.
After desalting, the samples were resuspended in rehydration buffer19,20 and the reducing agent tributylphosphine (TBP, Bio-Rad) and ampholytes (Bio-Rad) were added to run the first dimension using polyacrylamide strips with gradients immobilized at pH 4-7 and 3-10 (Bio-Rad). Isoelectric focusing (IEF) was done horizontally at a constant temperature of 20 oC following the program previously described by Lázaro et al,22 with slight modifications.
During the IEF program, 2 small pieces of paper and the polyacrylamide strips were placed between the electrodes (Electrode Wicks, Bio-Rad) to eliminate salts, excess water and proteins with isoelectric point values outside the pH range of the strip.
Once IEF was completed, the strips were balanced using equilibration buffer19,20 and the second dimension run. The gels were then dyed with silver (protein silver staining using Ampholine PAGplate; Pharmacia Biotech, GE Healthcare) or with Coomassie blue (pageBlue; Protein Staining, Fermentas), following the manufacturer's instructions. The dyed gels were scanned using the GS-800 scanner/densitometer (Bio-Rad) and subsequently analyzed with PDQUEST 8.0 image analysis software (Bio-Rad).
MALDI-TOF/TOF and Database Search
Protein spots were manually excised from the gels, digested automatically using the Ettan Digester (GE Healthcare) and identified in the Proteomics Unit of the Hospital Nacional de Parapléjicos (Toledo, Spain).
The digestion protocol described by Schevchenko et al23 was used with slight modifications: the gel fragments were reduced using 10 mmol dithiothreitol (dithiothreitol; Sigma Aldrich) in 50 mmol ammonium bicarbonate (99% purity; Scharlau) and alkylated with 55 mmol iodoacetamide (Sigma Aldrich) in 50 mmol ammonium bicarbonate. The gel fragments were then washed with 50 mmol ammonium bicarbonate, 50% methanol (HPLC gradient grade; Scharlau) and acetonitrile (HPLC gradient grade; Scharlau), and dried in a Speedvac (Thermo Fisher). Modified porcine trypsin (sequencing grade; Promega, Madison, Wisconsin, USA) was added to the gel fragments at a final concentration of 20 ng/ µL in 20 mmol ammonium bicarbonate and digested overnight at 37oC. Finally 60% acetonitrile in water and 0.1% formic acid (99.5% purity; Sigma Aldrich) was used for peptide extraction.
Once digestion was completed, an aliquot of each digestion was mixed with an aliquot of a-cyano-4-hydroxycinnamic acid matrix (Sigma Aldrich) in 50% acetonitrile and 0.1% trifluoroacetic acid. The mixture was placed in a thin layer on a 123´81 mm Opti-TOF 384 Well MALDI plate (Applied Biosystems) and dried at room temperature. The MALDI-MS/MS data were obtained automatically by mass spectrometry using a 4800 Plus MALDITOF/TOF Analyzer (Applied Biosystems).
The spectra were captured in positive ion mode using a 355-nm Nd:YAG laser at a frequency of 200 Hz, and from 100 to 2000 individual spectra were obtained. To analyze the ion fragments in tandem TOF/TOF, the precursor ions were accelerated to 8 kV and selected in the ion entry port. In addition, the fragments generated by the collision between the precursors and air in the collision chamber were accelerated to 15 kV in source 2 and their masses analyzed after passing through the ion reflector. Mass data were analyzed automatically using the 4000 Series Explorer version 3.5.3 software package (Applied Biosystems). MALDI-TOF mass spectra were internally calibrated by use of 2 ions from the autolysis of trypsin (m/z=842.510 and m/z=2211.105, respectively). MALDI-MS/MS was calibrated by use of ion fragment spectra obtained from the Glu1-fibrinopeptide B (4800 MALDI/TOF-TOF, Applied Biosystems). MALDI-MS and MS/MS data were combined using GPS Explorer version 3.6 software, which enables non-redundant searches in the NCBInr protein database (version 20080225) using Mascot version 2.1 software (Matrix science),24 at a mass tolerance of 50 ppm and allowing one missed cleavage site. The MALDI-MS/MS spectra and the searches were manually examined in detail using this program.
RESULTS
Processing of Aortic Valves. Protein Extraction and Homogenization
With the aim of maximizing the number of extracted proteins, the valves were submitted to a "strong" extraction protocol that had been adapted previously by Barderas et al18 for other types of sample and appeared to be compatible with our stenotic aortic valve samples. Figure 1 shows a schematic representation of the procedure.

Figure 1. Acquisition and analysis of aortic valve protein content. A: schematic representation of the protocol for acquiring protein extract from stenotic and nonstenotic aortic valves. B: representative images of 1-dimensional gels (SDS-PAGE, acrylamide/bisacrylamide 12%) of proteins obtained from stenotic aortic valves (patients) and healthy valves (controls).
It should be noted that the stenotic aortic valve samples obtained following this protocol presented a high content of calcium salts and other contaminants, which made correct isoelectric focusing difficult (data not shown), and thus a new filtration step was needed. Furthermore, we incorporated protease inhibitors in the protein extraction buffer to avoid protein degradation due to causes external to physiopathological processes during processing.
After optimizing the protein extraction protocol for stenotic aortic valves, protein extracts of approximately 350 µL were obtained with a protein concentration of 0.4-1 µg/µL per each 0.1-0.3 g of tissue.
Afterwards, the same protocol was applied to valves removed during autopsy (healthy samples), and no significant differences were found between the results obtained from either type of sample.
2-Dimensional Electrophoresis and Protein Identification
After protein extraction and the elimination of salts from the samples, 2-dimensional gels (2-DE) were produced from the extracts using different pH ranges (Figure 2) with the aim of identifying the optimum conditions required to obtain the greatest number of protein spots with the best possible resolution.

Figure 2. Representative images of 2-dimensional gels using protein extract obtained from stenotic aortic valves. First dimension run at different pH gradients (4-7 and 3-10). Second dimension run using acrylamide/bisacrylamide gels at 12%.
As can be seen in Figure 2A, there are approximately 400 well-defined protein spots distributed in the gel at a pH gradient 4-7 and some 300 spots at a pH gradient 3-10 (Figure 2B). In both cases, PD-Quest image analysis software (Bio-Rad) was used to quantify the number of protein spots. In all the cases analyzed, 2-DE gels were best resolved in the pH range 4-7, which led to the detection of the greatest number of spots.
Once the compatibility of the methodology with 2-DE was verified, the different protein spots were identified to corroborate that the protocols used in the protein extraction were compatible with mass spectrometry (MALDI-TOF/TOF) (Figure 3); an efficacy of 100% was obtained when identifying the selected protein spots. Identification was conducted in healthy aortic valves and stenotic aortic valves.

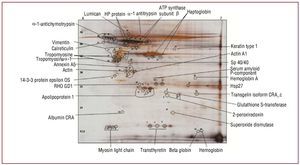
Figure 3. Representative image of 2-dimensional gel (pH 4-7) of protein extract obtained from healthy aortic valves, indicating some of the protein spots identified by mass spectrometry.
In this study, we used the 4800 MALDI-TOF/TOF mass spectrometer (Applied Biosystems), which is distinguished by its high sensitivity and minimum detection and identification limits (minimum detection threshold, 25 fmol). Furthermore, it possesses the great reliability and sensitivity of TOF, which is almost totally automatized, and thus hundreds of proteins can be identified per day. It cleaves the peptides at high energies, generating the fragments referred to above and others from the amino acid side chains, making it possible to differentiate residues with an identical mass, such as Leu/Ile. Thus, peptide sequencing becomes notably easier.
Functional Groups Identified
The peptide fingerprints obtained were used to identify the corresponding proteins using the MASCOT search engine (www. matrixscience. com). In this study, we identified protein spots of interest using pH 4-7 and pH 3-10 strips. Table 3 shows the proteins identified to date, and which have been classified into different functional groups: metabolism (apo-AI, SP40/40, etc), transport (albumin, haptoglobin, transthyretin), energy (ATPase), stress (Hsp27), cytoskeleton (actin), and inflammation and immune response (vitronectin, antitrypsin).

DISCUSSION
This study reports a simple and replicable methodology developed in the laboratory that enables proteomic analysis of the human aortic valve, both healthy and stenotic, using 2-DE, as well as identification of the proteins that compose them, using mass spectrometry. It is important to note that the groups analyzed had different ages (75 [4] years and 57 [14] years), and that the group with severe systemic symptoms may have altered the characteristics of the valves studied. In addition, it should be emphasized that the control samples came from autopsies (the patients died from causes unrelated to aortic valve stenosis).
Sample preparation, as indicated earlier, is a vital step in ensuring good results. Thus, a cleanup step was performed, consisting of filtration and precipitation to reduce the large quantities of salts in the samples, stemming from the calcium deposits present in the stenotic valves. These calcium deposits hindered the acquisition of optimal 2-DE gels. During clean-up there may be a slight loss of proteins associated with these processes, but this is compensated by the fact that high-resolution 2-DE gels are obtained.
On the other hand, although 2-DE is a laborious technique, the development of commercial isoelectric focusing strips, as well as the new electrophoresis tanks (making it possible to make and run up to 12 gels simultaneously), has made this technique easily replicable. However, it has some limitations, since these gels (2-DE) cannot resolve proteins of less than 10 kDa or more thab 150 kDa, and focusing the most basic or most acidic proteins is difficult. This is a drawback for 2-DE because many regulatory proteins are at very low concentrations and are not detectable. The uses of expanded gels and prior fractioning -with the acquisition of subproteomes or protein complexes to enrich the protein complex-partly prevent these drawbacks and increase the sensitivity of the detection thresholds. In our case, and in order to partly solve these limitations, the sample was fractionated, since the efficient extraction of proteins can be a vital step when studying the proteome of the valve or that of any other organ or tissue.25,26 We also developed several 2-DE maps with different pH ranges (IEF strips of pH 4-7 and pH 3-10). The use of these steps led to a considerable improvement in the resolution of the 2-DE gels.
The real limitation when identifying a specific protein spot is usually determined by the dynamic range of the sample and by the quantity and quality (low concentrations of salts, nucleic acids, lipids, etc) of the obtained protein extract, which depends directly on the efficacy of the extraction method. In fact, the preparation of the sample is essential and many recent proteomics studies have focused on optimizing the sample extraction and cleaning protocols for different tissues or organs. In the case of the stenotic aortic valve, our protein extraction protocol enabled us to conduct the first, or one of the first, proteomic approaches to this pathology.
On the other hand, regarding the methodology presented, we have verified (preliminary data) its compatibility with other proteomic techniques, such as 2-D gel electrophoresis and liquid chromatography-MS (data not shown).
Despite the good results obtained to date, we need to continue this type of study and identify the greatest number of proteins present in the proteome of the aortic valve. We hope that, in the future, these studies and other complementary ones, such as liquid chromatography-MS/MS, will lead to obtaining the complete aortic valve proteome, as well as describing the differential expression of healthy and stenotic aortic valves. The expression of a specific protein in stenotic valves that is also expressed in atheromatous plaques would help to establish whether the 2 pathologies share a similar molecular basis (protein).
CONCLUSIONS
We developed a protein extraction method for the large-scale proteomic analysis of stenotic aortic valves and, thus, healthy aortic valves, while minimizing information loss due to protein degradation during the process.
The use of this protein extraction method, together with comprehensive analysis of the proteome using 2-DE, will significantly increase the quantity of aortic valve proteins identified and facilitate their subsequent pathophysiological study.
ACKNOWLEDGMENTS
We would like to thank Dr V.M. Dardé, Gemma Barroso and Ana Isabel Carrasco, of the Proteome Unit of the Hospital Nacional de Parapléjicos, for their help in protein identification. We also would like to thank Carmen Bermúdez for her contribution to this study.
ABBREVIATIONS
apo: apolipoprotein
AS: aortic stenosis
IEF: isoelectric focusing
MALDI: matrix-assisted laser desorption/ ionization
MS: mass spectrometry
TBP: tributylphosphine
TOF: time-of-flight
This study was conducted with the financial help of the Esteve Grant awarded by the Spanish Society of Cardiology. Redes Técnicas de Investigación Cooperativa (RETICS), Instituto de Salud Carlos III, RD06/0014/1015. Health Research Fund PI070537 and P080970; CAM (Biomarkers S2006/GENE-0247). FISCAM 2008/08.
Correspondence: Dra. M.G. Barderas.
Laboratorio de Fisiopatología Vascular. Hospital Nacional de Parapléjicos. SESCAM.
Edificio de Terapia, 2.a planta. 45071 Toledo. España.
E-mail: megonzalezb@sescam.jccm.es
Received November 12, 2008.
Accepted for publication October 7, 2009