
We sought to compare the predictive value of the Thrombolysis In Myocardial Infarction (TIMI), Controlled Abciximab and Device Investigation to Lower Late Angioplasty Complications (CADILLAC), Primary Angioplasty in Myocardial Infarction (PAMI), and Global Registry for Acute Coronary Events (GRACE) scores for the outcome of ST-segment elevation acute coronary syndrome undergoing urgent percutaneous coronary intervention.
MethodsWe performed a retrospective analysis of a cohort composed of all consecutive patients with ST-segment elevation acute coronary syndrome treated by urgent percutaneous coronary intervention between 2006 and 2010 (n=1503). TIMI, PAMI, CADILLAC, and GRACE risk scores were calculated for each patient according to different clinical variables. We assessed the predictive accuracy of these scores for death, reinfarction, and target-vessel revascularization at 30 days and 1 year, using the C statistic, which was obtained by means of logistic regression and ROC curves.
ResultsThe TIMI, PAMI, CADILLAC and GRACE showed an excellent predictive value for 30-day and 1-year mortality (C statistic range, 0.8-0.9), with superiority of the TIMI, CADILLAC, and GRACE risk models. The performance of these 4 scores was poor for both reinfarction and target-vessel revascularization (C statistic, 0.5-0.6).
ConclusionsThe TIMI, PAMI, CADILLAC, and GRACE scores provide excellent information to stratify the risk of mortality in patients treated by percutaneous coronary intervention. The TIMI, CADILLAC, and GRACE models have higher predictive accuracy. The usefulness of these models for reinfarction and target-vessel revascularization prediction is questionable.
Keywords
.
INTRODUCTIONIschemic heart disease is the main cause of death in Western countries, principally due to acute coronary syndrome (ACS) and acute myocardial infarction (AMI).1
The risk of death and cardiovascular events after ACS varies widely.2 Accurate identification of patients with the highest clinical risk will make it possible to help those who may benefit from closer follow-up and more aggressive treatment and, in general, improve the prognosis of ACS. Consequently, risk stratification is a key component of ACS management.
Various scores based on multivariate statistical models have been developed to predict ACS risk, and several risk models are available for ST-segment elevation ACS (STEACS): Thrombolysis In Myocardial Infarction (TIMI),3 the Controlled Abciximab and Device Investigation to Lower Late Angioplasty Complications (CADILLAC),4 and the Primary Angioplasty in Myocardial Infarction (PAMI).5 In non-STEACS, the risk model most widely used is the Global Registry for Acute Coronary Events (GRACE).6 However, there is a paucity of data on the comparative prognostic value of these risk models in STEACS.7
The purpose of this paper is to compare the prognostic predictive value of these 4 scores in STEACS in our setting, in which percutaneous coronary intervention (PCI) is the reperfusion strategy of choice.
METHODS Study DesignWe conducted a retrospective analysis of a cohort composed of all STEACS patients who underwent primary or rescue PCI in our interventional cardiology unit between 2006 and 2010. Although this was a retrospective study, the demographic, clinical, and angiographic characteristics of the patients had been prospectively collected in a computer database. Our unit has a computer program in which the operators enter the characteristics of all patients who undergo a hemodynamic study. The study also included a review of patients’ medical histories to improve the quality of the information compiled.
Revascularization was performed in accordance with the current clinical practice guidelines for PCI.8 Patients were pretreated with aspirin and clopidogrel, and pretreatment with intravenous abciximab was likewise recommended, in accordance with the protocol defined by the GALician PROgram for Acute Myocardial Infarction Care (PROGALIAM). Patients who did not receive clopidogrel before PCI received a loading dose of 300 or 600mg. Stent type and use of thromboaspiration, predilation, postdilation, and other technical aspects were decided by the operator. Following PCI, dual antiplatelet therapy with aspirin and clopidogrel was prescribed for 6 to 12 months in patients treated with drug-eluting stents and at least 1 month in patients who received bare-metal stents; in both cases, patients continued with long-term monotherapy consisting of aspirin or clopidogrel.
Events and DefinitionsThe patients’ clinical course was reviewed to collect the main post-PCI clinical events over time, in particular, all-cause death, AMI, and target-vessel revascularization (TVR). Two time points (30 days and 365 days post-PCI) were established for each event.7 The study included a comprehensive review of the medical histories and electronic medical records for our autonomous community (Ianus program), which stores all patient-related health information obtained at primary care and specialist facilities in our health care system.
In accordance with the universal definition, re-AMI was defined as a cardiac troponin value above the 99th percentile reference limits and at least 1 of the following: symptoms consistent with ischemia, Q waves in the electrocardiogram (ECG), electrocardiographic changes indicating ischemia (ST-T changes or new left bundle-branch block), and images showing loss of viable myocardium or regional contractile abnormality.9
TVR was defined as any revascularization procedure in the target coronary artery during hospitalization for the index event, during primary angioplasty, or during a deferred elective procedure.10
Anemia was defined according to the World Health Organization criteria (hematocrit <36% in women and <39% in men).4
Renal insufficiency was defined as creatinine clearance, estimated using the Cockroft-Gault formula, <60mL/min.11
Statistical AnalysisContinuous variables are presented as mean (standard deviation) and categorical variables are expressed as absolute and relative frequency.
The occurrence of clinical events (death, AMI, and TVR) was estimated by the cumulative incidence (defined as the number of events divided by the total number of patients at risk). The exact limits of the 95% confidence interval (95%CI) were estimated. To calculate the incidence of events at 1 year, patients who underwent PCI during 2010 were excluded to avoid underestimating occurrence because follow-up beyond 1 year was not available.
The TIMI-STEMI, PAMI, CADILLAC, and GRACE risk scores were calculated from patients’ clinical, electrocardiographic, and angiographic characteristics. The individual rating for each variable established in each score was assigned. The total score of each patient was calculated by summing the individual result for each prognostic variable included in the score.
Risk model calibration was assessed by the Hosmer-Lemeshow goodness-of-fit test, which determines how close the predicted and observed incidence of events are over a range of scores. In this test, a significant result indicates lack of model adjustment.12
We assessed the discriminatory capacity of the risk models for each clinical event by the C statistic. In general, a model with a C statistic value above 0.70 has acceptable discriminatory capacity.12 To calculate the C statistic, we used logistic regression models, introducing each clinical event as a dependent variable and each score as a continuous quantitative independent variable,7, 13 and then estimated the predicted probability for the event in question. Afterwards, we compared this probability to actual occurrence of the event using a receiver operating characteristic (ROC) curve, thus obtaining the area under the curve or C statistic and the respective 95%CI.12 The C statistics for the 4 risk models were compared to each other using a nonparametric test developed by DeLong et al.14
SPSS (version 19.0, SPSS Inc., Chicago, Illinois, United States) was used for the statistical analysis, whereas the areas under the ROC curve for clinical event models were compared using MedCalc (version 11.6.1, MedCalc Software, Mariakerke, Belgium). A bilateral value of P<.05 was considered statistically significant.
RESULTS Baseline CharacteristicsThe study cohort was composed of 1503 patients; baseline characteristics are shown in Table 1. Complete follow-up was achieved in 98.9% of patients (16 [1.1%] patients were lost to follow-up).
Table 1. Baseline Characteristics of the Study Population.
| Cardiovascular risk factors | |
| Age, years | 63.6 (12.9) |
| Weight, kg | 79.5 (15.6) |
| Male sex | 1193 (79.4) |
| Smoking | 545 (36.3) |
| Ex-smoker | 272 (18.1) |
| HT | 778 (51.8) |
| Dyslipidemia | 600 (39.9) |
| DM | 294 (19.6) |
| Medical history | |
| Previous AMI | 123 (8.2) |
| Previous PCI | 125 (8.3) |
| Previous coronary surgery | 18 (1.2) |
| Peripheral vascular disease | 43 (2.9) |
| Cerebrovascular disease | 53 (3.5) |
| Renal insufficiency | 341 (22.7) |
| Cr Cl, mL/min * | 89.8 (40.7) |
| Anemia | 302 (20.1) |
| Clinical presentation | |
| Primary PCI | 1427 (94.9) |
| Rescue PCI | 76 (5.1) |
| SBP, mmHg | 124.4 (23.3) |
| DBP, mmHg | 70.8 (14.7) |
| HR (bpm) | 76.5 (16.8) |
| Killip class | |
| I | 1192 (80.9) |
| II | 131 (8) |
| III | 33 (2.2) |
| IV | 117 (7.9) |
| Anterior AMI | 653 (43.3) |
| Inferior AMI | 772 (51.4) |
| New LBBB | 17 (1.1) |
| LVEF, % | 54.6 (12.8) |
| Triple-vessel disease | 259 (17.2) |
| Successful angioplasty | 1415 (94.1) |
Cr Cl, creatinine clearance; DBP, diastolic blood pressure; DM, diabetes mellitus; HR, heart rate; HT, hypertension; LBBB, left bundle-branch block; LVEF, left ventricular ejection fraction; AMI, acute myocardial infarction; PCI, percutaneous coronary intervention; SBP, systolic blood pressure.
Quantitative variables are shown as mean (standard deviation) and categorical variables as absolute frequencies (percentages or relative frequencies).
* Creatinine clearance was estimated by the Cockcroft-Gault formula.
Table 2 summarizes the incidence of the main clinical events. Mortality was 5.5% at 30 days and 9.3% at 365 days, while the incidence of re-AMI was 2.7% at 30 days and 4.9% at 1 year and the cumulative incidence of TVR was 2.4% at 30 days and 5.3% at 1 year.
Table 2. Cumulative Incidence of Clinical Events at 30 and 365 Days.
| At 30 days (n=1503) | At 365 days (n=1130) | |||
| Events, no. | % (95%CI) | Events, no. | % (95%CI) | |
| Death | 83 | 5.5 (4.5-6.9) | 105 | 9.3 (7.8-11.2) |
| Re-AMI | 41 | 2.7 (2-3.7) | 55 | 4.9 (3.8-6.3) |
| TVR | 36 | 2.4 (1.8-3.3) | 60 | 5.3 (4.2-6.8) |
95%CI, 95% confidence interval; Re-AMI, new acute myocardial infarction; TVR; target-vessel revascularization.
The incidence of events at 30 days was calculated for the entire sample (n=1503 patients). The incidence of events at 365 days was calculated after excluding patients undergoing percutaneous coronary intervention in 2010; hence a total of 1130 patients were included.
The calibration of the TIMI, PAMI, CADILLAC, and GRACE risk models for prediction of the risk of death, AMI, and TVR was excellent, as concluded from the results of the Hosmer-Lemeshow test. Nevetheless, the CADILLAC model showed lack of adjustment for TVR at 30 days, and a similar result was seen for 1-year mortality in the GRACE model (Table 3).
Table 3. TIMI, PAMI, CADILLAC, and GRACE Risk Model Calibration and Discrimination.
| Event | TIMI | PAMI | CADILLAC | GRACE | ||||||||
| Patients, a no. (%) | AUC | P b | Patients, a no. (%) | AUC | P b | Patients, a no. (%) | AUC | P b | Patients, a no. (%) | AUC | P b | |
| Death | ||||||||||||
| 30 days | 1448 (96.3) | 0.87 (0.85-0.89) | .460 | 1460 (97.1) | 0.81 (0.79-0.83) | .278 | 1311 (88.2) | 0.90 (0.88-0.91) | .474 | 1409 (93.8) | 0.90 (0.89-0.92) | .089 |
| 1 year | 1084 (95.9) | 0.85 (0.83-0.87) | .544 | 1095 (96.9) | 0.81 (0.78-0.83) | .212 | 975 (86.3) | 0.87 (0.84-0.89) | .815 | 1055 (93.4) | 0.85 (0.83-0.87) | .048 |
| AMI | ||||||||||||
| 30 days | 1448 (96.3) | 0.56 (0.47-0.65) | .985 | 1460 (97.1) | 0.54 (0.45-0.63) | .108 | 1311 (88.2) | 0.57 (0.47-0.66) | .101 | 1409 (93.8) | 0.56 (0.45-0.67) | .371 |
| 1 year | 1084 (95.9) | 0.57 (0.50-0.65) | .390 | 1095 (96.9) | 0.58 (0.48-0.67) | .266 | 975 (86.3) | 0.57 (0.48-0.65) | .482 | 1055 (93.4) | 0.54 (0.46-0.63) | .779 |
| TVR | ||||||||||||
| 30 days | 1448 (96.3) | 0.55 (0.45-0.65) | .618 | 1460 (97.1) | 0.51 (0.42-0.60) | .150 | 1311 (88.2) | 0.54 (0.45-0.64) | .012 | 1409 (93.8) | 0.50 (0.40-0.60) | .187 |
| 1 year | 1084 (95.9) | 0.56 (0.48-0.63) | .885 | 1095 (96.9) | 0.55 (0.47-0.62) | .547 | 975 (86.3) | 0.54 (0.46-0.61) | .930 | 1055 (93.4) | 0.50 (0.42-0.58) | .501 |
AUC, area under the curve or C statistic; CADILLAC, Controlled Abciximab and Device Investigation to Lower Late Angioplasty Complications; GRACE, Global Registry for Acute Coronary Events; AMI, acute myocardial infarction; PAMI, Primary Angioplasty in Myocardial Infarction; TIMI, Thrombolysis In Myocardial Infarction; TVR, target-vessel revascularization.
a Number of valid patients included in the regression model used to obtain the C statistic.
b Hosmer-Lemeshow test.
The discrimination of the risk models for 30-day and 1-year mortality was excellent, as all 4 models presented C statistics >0.80 for death at 30 and 365 days (Table 3). Figure 1 shows the area under the curve obtained from the ROC curves for 30-day mortality with each of the 4 risk models. Conversely, the discriminatory capacity of the 4 risk models for re-AMI prediction and TVR was poor, as the C statistic was 0.50 to 0.60 (Table 3).

Figure 1. Receiver operating characteristic curves of the TIMI (A), PAMI (B), CADILLAC (C), and GRACE (D) models for 30-day mortality prediction. CADILLAC, Controlled Abciximab and Device Investigation to Lower Late Angioplasty Complications; GRACE, Global Registry for Acute Coronary Events; PAMI, Primary Angioplasty in Myocardial Infarction; TIMI, Thrombolysis In Myocardial Infarction.
The C statistic for the PAMI model was statistically significantly lower for the prediction of 30-day mortality compared to that of the TIMI, CADILLAC, and GRACE models. The C statistic of the GRACE model was statistically higher than that of the TIMI model, whereas the CADILLAC model showed a statistically borderline trend with superiority compared to the TIMI model. There were no significant differences between the GRACE and CADILLAC models in predictive capacity for 30-day mortality. For 1-year mortality, the TIMI, CADILLAC, and GRACE scores showed statistically borderline superiority compared to the PAMI score. No differences were observed when the TIMI, CADILLAC, and GRACE scores were compared to each other (Table 4).
Table 4. Comparison of C Statistic of the TIMI, PAMI, CADILLAC, and GRACE Models for Death at 30 and 365 Days.
| Comparison | Death at 30 days | Death at 365 days | ||
| z | P | z | P | |
| TIMI vs PAMI | 3.033 | .0024 | 2.533 | .0113 |
| CADILLAC vs PAMI | 4.154 | <.0001 | 2.938 | .0033 |
| GRACE vs PAMI | 4.105 | <.0001 | 2.915 | .0036 |
| CADILLAC vs TIMI | 1.813 | .0698 | 0.767 | .4431 |
| GRACE vs TIMI | 2.706 | .0068 | 0.847 | .3973 |
| GRACE vs CADILLAC | 0.325 | .7448 | 0.456 | .6484 |
CADILLAC, Controlled Abciximab and Device Investigation to Lower Late Angioplasty Complications; GRACE, Global Registry for Acute Coronary Events; PAMI, Primary Angioplasty in Myocardial Infarction; TIMI, Thrombolysis In Myocardial Infarction.
The null-hypothesis z-test result is shown for the comparisons of the C statistic for the 4 risk models and the respective P value, obtained by the DeLong nonparametric method.
Risk stratification of clinical events is an essential part of the management of patients with an ACS, and the TIMI, PAMI, CADILLAC, and GRACE scores have been designed precisely for this purpose.3, 4, 5, 6 The present study compares the capacity of these scores to predict the risk of events after an STEACS undergoing urgent PCI. In our series, the 4 scores exhibited excellent discriminatory capacity for 30-day and 1-year mortality, as the C statistic was above 0.80. The predictive capacity of the 4 scores for both re-AMI and TVR was poor, with C statistics between 0.5 and 0.6.
Mortality PredictionIn our cohort, the predictive value of the 4 risk models for 30-day and 1-year mortality was excellent (C statistic range, 0.80-0.90) (Table 3). The C statistics for mortality scores were higher in our series than in the original publications of these scores,3, 4, 5, 6 as the mortality in our series was also higher than in those studies. In the present study, the cohort was composed of unselected patients from real life whereas the design of the TIMI, PAMI, and CADILLAC scores was based on clinical trials in highly selected populations3, 4, 5 not necessarily representative of usual clinical practice.
In our series, the GRACE model showed excellent predictive capacity, a finding that differs from that of the single study on the issue to date, which showed poor predictive capacity.7 This probably results from the fact that the study excluded patients in cardiogenic shock whereas our series included these patients, who accounted for 7.9% of our cohort and influenced how well the score functions.
As mentioned, the TIMI, CADILLAC, and GRACE scores have greater predictive value for 30-day and 365-day mortality than the PAMI model.
In view of our results, therefore, it does not seem simple to choose between the first 3 models. In the case of 30-day mortality, the GRACE model yielded a higher C statistic than the TIMI model, and the C statistic of the CADILLAC model presented a statistically borderline trend with superiority over the TIMI model. The CADILLAC regression model was probably negatively affected by the higher number of patients with lost values. We found no significant differences between the GRACE and CADILLAC models.
When comparing predictive models, a balance between complexity (and mathematical accuracy) and simplicity (clinical applicability) must be found.15, 16 The TIMI model consists of 8 clinical variables with a simple grading system, in which each variable is rated according to its presence.3 The CADILLAC model is composed of 7 variables and also has a simple rating system.4 The GRACE model, however, includes 8 variables, in which 3 (age, heart rate, systolic blood pressure) have a rather complex rating system with several categories and different ratings established for these continuous variables.6 The GRACE model is more comprehensive and, from a purely statistical standpoint, provides more complete information to these variables. The most important difficulty involved in calculation is readily solved by using an online risk calculator. This favors the CADILLAC and TIMI scores over the GRACE score, but is not decisive for the choice of a specific model.
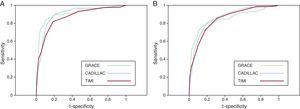
Two or more ROC curves may have a similar C statistic but are not necessarily equal. Although the CADILLAC and GRACE models function similarly, the CADILLAC model seems to be better than the GRACE for the high-sensitivity area. The ROC curve for sensitivities >0.90 is higher in the CADILLAC model than the GRACE model (Figure 2). Models to predict mortality should be sensitive because a false negative is obviously very costly; this gives the CADILLAC model some theoretical advantage.

Figure 2. Comparison of the receiver operating characteristic curves of the TIMI, CADILLAC, and GRACE models for 30-day (A) and 365-day (B) mortality. CADILLAC, Controlled Abciximab and Device Investigation to Lower Late Angioplasty Complications; GRACE, Global Registry for Acute Coronary Events; TIMI, Thrombolysis In Myocardial Infarction.
The TIMI, CADILLAC, and GRACE scores have shown greater discriminatory capacity for 1-year mortality than the PAMI score, and there were no statistical differences between them. Nevertheless, the GRACE model did not show adequate calibration in our series for 1-year mortality, and its result in the Hosmer-Lemeshow test was statistically significant (P=.05). This result should be interpreted with caution, because it is statistically borderline. The model may present adequate calibration in other populations (as shown in a U.S. cohort of patients with STEACS).17 The GRACE model we used was derived and validated to predict in-hospital mortality, and we did not use the GRACE model for 6-month mortality18 because no information was available on congestive heart failure, a factor which could also have influenced the results.
Although the area under the curve of the CADILLAC, TIMI, and GRACE models for 1-year mortality is similar, the CADILLAC and TIMI scores seem to be better than the GRACE score for the high-sensitivity area (Figure 2). Theoretically, this gives them some advantage over the GRACE score, which is also simple and easy to use; however, this is apparently not key when choosing 1 of the 3 models in particular.
The differences between the 4 risk models in mortality discrimination seem to be explained by differences in the variables that comprise each model. All the scores include age and Killip class, both associated with survival in STEACS.19, 20 The TIMI and PAMI models have several variables in common, such as heart rate, diabetes, and previous infarction site, while the TIMI score also includes blood pressure and time to treatment. The inclusion of these variables explains why the TIMI has greater predictive value for 30-day and 365-day mortality than the PAMI. In fact, the time to treatment is a predictor of survival in STEACS.21 The CADILLAC model differs in that it includes angiographic and hemodynamic parameters (triple-vessel disease, left ventricular ejection fraction, and TIMI flow following angioplasty) and laboratory variables (renal insufficiency, anemia). This contributes to the superiority of this model in predicting survival because the variables are associated with post-STEACS prognosis.22, 23, 24, 25 Lastly, the GRACE model, which also includes laboratory variables (creatinine, elevated myocardial injury markers on admission), gives more importance to variables related to clinical presentation (age, Killip class, systolic blood pressure, heart rate, cardiac arrest on admission, and ST-segment deviation in the ECG). This explains its excellent predictive capacity, particularly for early mortality, and its superiority compared to the PAMI and TIMI models for that purpose.
Prediction of Acute Myocardial Infarction and Target-Vessel RevascularizationIn our series, the predictive capacity of the 4 scores for re-AMI and TVR risk was poor (C statistics, 0.50-0.60). In contrast, the only study to address this issue to date found that the discriminatory capacity for the 30-day risk of AMI was moderate in the TIMI, PAMI, and CADILLAC models (C statistics, 0.61, 0.64, and 0.69, respectively) and poor for the GRACE score (C statistic, 0.53).7 The risk prediction for major adverse cardiac events at 30 days was similar (C statistics, 0.64, 0.65, 0.71, and 0.54 for the TIMI, PAMI, CADILLAC, and GRACE scores, respectively).7
Several explanations can be given for the low predictive power of the scores in predicting re-AMI and TVR in our series. First of all, these risk models were designed to predict mortality, and it is not surprising that their capacity to predict other events is low.3, 4, 5, 6 Moreover, the models include variables (age, diabetes, renal insufficiency) that have been related to the risk of re-AMI and new revascularization, as well as variables linked to clinical presentation (blood pressure, heart rate, Killip class), in which case an association with the risk of AMI and TVR is more difficult to establish. Therefore, the usefulness of these scores in predicting re-AMI and TVR is questionable.
LimitationsOur study has several potential limitations. First of all, the study consisted of a retrospective analysis of a historic cohort composed of patients at a single site and was subject to the inherent biases of this type of study. It does represent, however, an unselected population of patients with STEACS in our routine clinical practice, making it an ideal sample to confirm the external validity of the risk models cited. In the present analysis, we used logistic regression models to assess the calibration and discrimination of risk models, rather than Cox regression models, which would permit an analysis of these aspects as well as clinical progress throughout follow-up. We did apply the methodology used in preceding studies3, 4, 5, 6, 7 because logistic regression can be used to estimate effects and make predictions when follow-up is virtually complete.16 Lastly, the main limitation of the risk scores is that they were developed for group rather than individual predictions. Although the discriminatory capacity is high, it will never be perfect. The scores can be used in a specific patient only as an approximate guideline, as they may indicate a particular risk but do not unequivocally predict the final clinical outcome.26
CONCLUSIONSThe TIMI, PAMI, CADILLAC, and GRACE clinical models are an excellent tool for the stratification of mortality risk in patients who undergo primary or rescue PCI. The TIMI, CADILLAC, and GRACE scores have a greater predictive capacity for 30-day and 365-day mortality than the PAMI score. In contrast with previously published studies, the usefulness of these risk models in STEACS undergoing PCI for the prediction of re-AMI and TVR is questionable, given the poor predictive capacity in our series.
CONFLICTS OF INTERESTNone declared.
Received 5 August 2011
Accepted 24 October 2011
Corresponding author: Servicio de Cardiología, Complexo Hospitalario Universitario A Coruña, As Xubias 84, 15006 A Coruña, Spain. xacobeflores@yahoo.es