The traditional Framingham score underestimates cardiovascular risk in certain populations. Extending its time-scale to 30 years and assessing its relationship with the presence of carotid atherosclerotic plaque may improve risk stratification. The objectives were: a) to determine the percentage of patients previously classified with the traditional score who were reclassified when using Framingham 30-year risk score; b) to analyze the prevalence of carotid atherosclerotic plaque; and c) to determine the diagnostic potential of the 30-year score to detect carotid plaque.
MethodsA carotid Doppler ultrasound study was performed and the Framingham 10-year risk score and 30-year score (based on lipids and body mass index) for “hard” cardiovascular events were calculated in a population of primary prevention patients. Prevalence of carotid plaque was determined. Receiver operating characteristic analysis was conducted.
ResultsIn total, 305 subjects were included (age 48 [11] years, 52% men). The 30-year scores based on lipids and on body mass index reclassified 70% and 63% of the population, respectively. Prevalence of carotid plaque was 28.5% and associated gradually with risk category. The area under the curve and optimal cutoff points of the 30-year score to detect carotid plaque were 0.862 and 26% (based on lipids) and 0.845 and 22% (based on body mass index), respectively.
ConclusionsThe 30-year score reclassified a large number of patients and discriminated between those with or without evidence of carotid plaque.
Keywords
Cardiovascular disease is the principle cause of morbidity and mortality.1 Evaluation of cardiovascular risk is the most appropriate way to discriminate between individuals who have risk factors requiring intensive control and those who, because they are at low risk, do not. Large-scale epidemiologic studies have given rise to predictive, multivariate models which, in turn, have served as the basis for the design of clinical prediction equations.2,3,4,5,6,7 Cardiovascular risk scores are extremely useful in daily clinical practice but limited in their capacity to calibrate and discriminate.8,9 These variations depend on population-based, ethnic, and individual factors. Therefore, new risk scores must be evaluated in populations other than those involved in their design. The cohort study based on the US city of Framingham began in 1948 and led to the publication of the most widely used risk equation: the Framingham 10-year risk score (FS10).2,10 The third report of the National Cholesterol Education Program (NCEP) Panel of Experts on the detection, evaluation, and treatment of high blood cholesterol in adults (Adult Treatment Panel III) incorporated FS10 as a basic tool for stratifying cardiovascular risk, on the basis of which objectives or therapeutic goals are determined.11 However, FS10 presents certain fundamental weaknesses, as it underestimates cardiovascular risk in populations such as the young or women. As most cardiovascular events occur in low- or moderate-risk populations,12 access to more efficient predictive tools is necessary. One option is to extend the period for predicting vascular events, thus giving physicians and patients a different perspective on the problem. A recently published score (FS30), which is based on descendants of the original Framingham cohort, extends the time-scale from 10 to 30 years.13 Two models were designed: one based on blood lipid concentrations (total cholesterol and high density lipoprotein cholesterol) and the other based on body mass index.
Another alternative is to incorporate new prognostic elements (biomarkers or diagnostic methods that identify subclinical atherosclerosis) into cardiovascular risk estimates based on classic risk factors. The diagnosis of carotid atherosclerotic plaque (CAP) is a surrogate objective and constitutes an independent predictor of coronary events. Unfortunately, because resources are scarce or because costs are constantly rising, not all healthcare centers can apply CAP detection methods. Hence, the objectives of our study were: a) to determine how many patients analyzed with FS10 were reclassified on applying FS30; b) to analyze the prevalence of CAP in a population stratified by FS30, and c) to determine the optimal cutoff point (OCP) of FS30 to discriminate between patients with or without evidence of CAP.
MethodsWe conducted a descriptive cross-sectional study of a consecutive population sample enrolled in the cardiovascular prevention clinic of the cardiology service of Hospital Italiano, Buenos Aires, Argentina, between January 1 and June 20, 2010.
Inclusion CriterionAny patient attending the cardiovascular prevention clinic aged 20-60 years (the age range that enables us to calculate FS30 risk).
Exclusion Criteria1. Previous cardiovascular disease (acute myocardial infarction, unstable angina, chronic unstable angina, myocardial revascularization surgery, coronary angioplasty, stroke, peripheral vascular disease, and disease of the aorta or any of its branches).
2. Personal history of diabetes mellitus.
3. Previous lipid-lowering treatment.
The FS10 was calculated, defining low, moderate or high risk as <10%, 10%-19% and ≥20% risk, respectively. We also calculated FS30 based on lipids (FS30L) and body mass index (FS30I) for “hard” events: acute myocardial infarction, death due to coronary cause, and stroke. The number of patients reclassified by the new score was calculated. Low risk was defined as ≤12% risk, and high risk as ≥40%. These definitions are drawn from the original population studied by Pencina et al13 in 2009. Carotid atherosclerotic plaque was recorded when atherosclerotic plaque was found in the carotid arteries in noninvasive, 2D-mode ultrasound images, using a Logiq Book XP ultrasound system (General Electric®) with a 7.5MHz linear transducer. Presence of plaque was defined as: a) abnormal wall thickness (defined as intima-media thickness >1.5mm); b) abnormal structure (protrusion towards the lumen, loss of alignment with the adjacent wall), and c) abnormal wall echogenicity. Prevalence of CAP in the different risk categories was compared. Receiver operating characteristic (ROC) analysis was performed. The area under the curve was determined to ascertain how accurately FS30 discriminates between patients with or without CAP. To determine the OCP of FS30L and FS30I to detect CAP, we used Youden's J index, which corresponds to the maximum vertical distance between the ROC curve and the statistical chance line (cJ point).14 We calculated sensitivity, specificity, positive predictive value, and negative predictive value. Continuous data for 2 groups were analyzed with the t test if the distribution of variables was normal (ANOVA with >2 groups), or with the Wilcoxon-Mann-Whitney test if it was not. Categorical variables were analyzed with the χ2 test. Concordance between the two classification methods was analyzed with Cohen's kappa index. Continuous variables are expressed as mean (SD); categorical variables as percentages. A value of P <.05 was considered statistically significant.
The study was conducted according to Helsinki declaration medical research recommendations, guidelines on good clinical practice, and our local ethics committee regulations.
ResultsIn total, 305 patients were enrolled. Baseline patient characteristics are in Table 1.
Table 1. Characteristics of the Study Population.
| Men (n=160) | Women (n=145) | Men (n=305) | |
| Continuous variables | |||
| Age (years) | 45±12 | 51±9 | 48±11 |
| Systolic blood pressure, mmHg | 127±14 | 126±12 | 126±12 |
| Total cholesterol level, mg/dl | 220±47 | 226±38 | 223±43 |
| LDLc, mg/dL | 147±40 | 147±40 | 147±40 |
| HDLc, mg/dL | 41±10 | 56±13 | 48±14 |
| Triglycerides, mg/dL | 154±94 | 119±60 | 136±81 |
| Apolipoprotein B, mg/dL | 110±31 | 108±27 | 110±31 |
| Apolipoprotein A1, mg/dL | 147±32 | 163±28 | 147±32 |
| C-reactive protein, mg/dL | 1.26±1.15 | 1.38±1.21 | 1.34±1.19 |
| Body mass index | 27.6±3 | 25.3±4 | 26.5±4 |
| Glucose level, mg/dL | 98±11 | 94±10 | 96±12 |
| Categorical variables | |||
| Smokers | 38 (24) | 30 (21) | 68 (22) |
| Antihypertensive treatment | 52 (33) | 38 (26) | 90 (29.5) |
| FS10 | |||
| Low risk | 106 (66) | 138 (95) | 244 (80) |
| Moderate risk | 46 (29) | 7 (5) | 53 (17) |
| High risk | 8 (5) | 0 | 8 (3) |
| FS30L | |||
| Low risk | 32 (20) | 39 (27) | 71 (23) |
| Moderate risk | 82 (51) | 95 (66) | 177 (58) |
| High risk | 46 (29) | 11 (7) | 57 (19) |
| FS30I | |||
| Low risk | 39 (24) | 48 (33) | 87 (29) |
| Moderate risk | 81 (51) | 96 (66) | 177 (58) |
| High risk | 40 (25) | 1 (1) | 41 (13) |
HDLc, high density lipoprotein cholesterol; LDLc, low density lipoprotein cholesterol; FS10, Framingham 10-year risk score; FS30I, Framingham 30-year risk score based on body mass index; FS30L, Framingham 30-year risk score based on lipids.
Data are expressed as mean±SD or n (%).
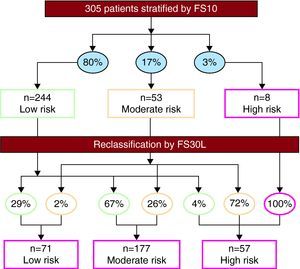
The FS30L classified 23%, 58%, and 19% of patients as being at low, moderate, and high risk, respectively. These scores reclassified 70% of the population with respect to their FS10 scores (Figure 1). Among women classified by FS10 as low risk (n=138), 68% and 3.6% were reclassified as moderate and high risk, respectively; among low-risk men (n=106), 65% and 5.7% were reclassified as moderate and high risk, respectively.

Figure 1. Restratification of the population using the Framingham 30-year risk score based on lipids (FS30L). The percentages shown in ovals indicate the proportion of patients distributed by risk categories, based on the Framingham 10-year risk score (FS10) (above) and the FS30L (below).
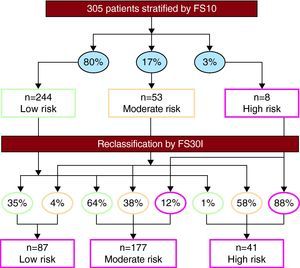
The FS30I score classified 29%, 58%, and 13% of patients as low, moderate, and high risk, respectively. The FS30I function reclassified 63% of the population analyzed with FS10 (Figure 2). Among low-risk women, 66% were reclassified as moderate risk; among low risk men, 61% and 2.8% were reclassified as moderate and high risk, respectively.

Figure 2. Restratification of the population using the Framingham 30-year risk score based on body mass index (FS30I). The percentages shown in ovals indicate the proportion of patients distributed by risk categories based on the Framingham 10-year risk score (FS10) (above) and the FS30I (below).
Concordance in “low-” or “not low” risk classification was very poor when comparing FS10 with FS30L (kappa=0.13) and FS30I (kappa=0.16).
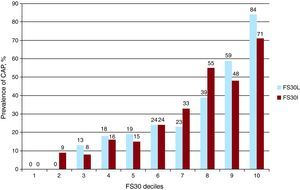
Prevalence of Carotid Atherosclerotic Plaque by Risk CategoriesGeneral prevalence of CAP was 28.5%. When the population was analyzed with FS10, prevalence of CAP was 19%, 60%, and 100% in patients with low, moderate, and high risk, respectively (P<.0001). With FS30L, prevalence was of CAP was 0%, 23% and 81% in patients with low, moderate and high risk, respectively (P<.0001). In contrast, with FS30I, prevalence of CAP was 2%, 31%, and 76% in patients with low, moderate, and high risk, respectively (P<.0001). Results were similar when the population was analyzed by sex, although prevalence among high-risk patients was greater in women (Table 2). The FS30 deciles correlated positively with prevalence of CAP (Figure 3).
Table 2. Prevalence of Carotid Atherosclerotic Plaque by Framingham 10- and 30-Year Risk Score Categories.
| FS10 (%) | FS30L (%) | FS30I (%) | |
| Total | |||
| Low risk | 19 | 0 | 2 |
| Moderate risk | 60 | 23 | 31 |
| High risk | 100 | 81 | 76 |
| Men | |||
| Low risk | 18 | 0 | 3 |
| Moderate risk | 57 | 21 | 27 |
| High risk | 100 | 78 | 75 |
| Women | |||
| Low risk | 20 | 0 | 2 |
| Moderate risk | 86 | 25 | 33 |
| High risk | — | 91 | 100 |
FS30I, Framingham 30-year risk score based on body mass index; FS30L, Framingham 30-year risk score based on lipids.

Figure 3. Relation between the deciles of the Framingham 30-year risk score and prevalence of carotid atherosclerotic plaque. CAP, carotid atherosclerotic plaque; FS30, Framingham 30-year risk score; FS30I, Framingham 30-year risk score based on body mass index; FS30L, Framingham 30-year risk score based on lipids.
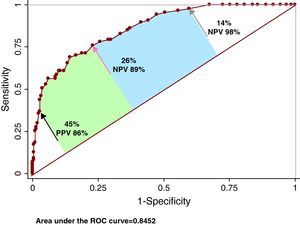
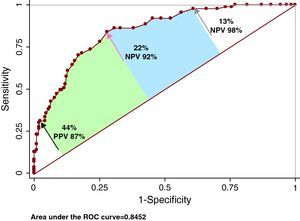
ROC AnalysisThe area under the curve for FS30L to detect CAP was 0.862 (95% confidence interval [CI], 0.818-0.905; Youden, 0.53) and the OCP was ≥26% (sensitivity, 76%; specificity, 77%; positive predictive values, 57%; negative predictive values, 89%) (Figure 4). A high cutoff point was explored for high sensitivity (14%; sensitivity, 97.7%), and another for high specificity (45%; specificity, 97.7%). The negative predictive value of the first was 98%; the positive predictive value of the second was 86%. The area under the curve for FS30I to detect CAP was 0.845 (95% CI, 0.798-0.891; Youden, 0.55) and the OCP was ≥22% (sensitivity, 84%; specificity, 72%; positive predictive value, 54%; negative predictive value, 92%) (Figure 5). A cutoff point was analyzed for high sensitivity (13%; sensitivity, 97.7%), and another for high specificity (44%; specificity, 97.7%). The negative predictive value of the first was 98%; the positive predictive value of the second was 87%.

Figure 4. Accuracy of the Framingham 30-year risk score based on lipids to detect carotid atherosclerotic plaque. The red arrow indicates the location of the optimal cutoff point; the black arrow, the exploratory cutoff point for high specificity; and the grey arrow, that for high sensitivity. See explanation in the text. CAP, carotid atherosclerotic plaque; NPV, negative predictive value; PPV, positive predictive value; ROC, receiver operating characteristic.

Figure 5. Accuracy of the Framingham 30-year risk score based on body mass index to detect carotid atherosclerotic plaque. The red arrow indicates the location of the optimal cutoff point; the black arrow, the exploratory cutoff point for high specificity; and the grey arrow, that for high sensitivity. See explanation in the text. CAP, carotid atherosclerotic plaque; NPV, negative predictive value; PPV, positive predictive value; ROC, receiver operating characteristic.
DiscussionMost of the risk score equations used around the world estimate the risk of a cardiovascular event occurring within 10 years. On this time-scale, approximately 80% of cardiovascular events occur in individuals with low baseline risk.12 The FS10 cannot identify individuals with high vascular risk among men aged <40, and classifies most women aged <70 as being at low cardiovascular risk.15,16 In recent years, two strategies have been adopted to resolve this problem. The first is to find a biomarker that improves the predictive power of the model based on traditional risk factors.7 The second strategy is the detection of subclinical carotid atherosclerosis or atherosclerosis in another vascular territory via imaging studies (eg, calculating coronary calcium scores by computerized tomography, measuring the ankle-brachial index, or determining intima-media thickness/carotid plaque by ultrasound).17,18,19 A meta-analysis has shown the relative risk of acute myocardial infarction increases by 10% for each 0.1mm increase in intima-media thickness, independently of the classic risk factors.20 Moreover, a correlation exists between intima-media thickness and FS10 cardiovascular risk.21,22 A previously published study conducted in Argentina reported that 1 in 2 patients initially classified as being at low cardiovascular risk with different clinical detection tables was reclassified after CAP had been detected by Doppler echocardiography.23 The prevalence of carotid plaque we detected was less than that in the aforementioned study (28.5% versus 53%) but is consistent with other international publications.24 This can probably be explained by differences either in populations or in criteria used to define “carotid plaque”. In our study, detection of CAP associated gradually with risk category, independently of the score used. However, prevalence of CAP in the low risk category was significantly greater with FS10 (approximately 1 in 5 patients). A recent review including 13,145 patients showed incorporating intima-media thickness and presence or absence of CAP into a model consisting of traditional risk factors improved cardiovascular event prediction.25 Presence of CAP predicted the risk of ischemic heart disease better than intima-media thickness. This reaffirms the view that when detecting plaque we are not just evaluating a surrogate objective but, in fact, a process that in itself confirms the onset of atherosclerotic disease. In the aforementioned study, 37.5% of patients with 5%-10% risk (based on classic risk factors) and 38% of patients with 10%-20% risk were reclassified when carotid echo-Doppler data was taken into account. However, although the principle European and North American clinical practice guidelines recognize these techniques as useful tools in cardiovascular risk stratification, they are not “formally” incorporated in the final recommendations, which advise against their widespread use.11,26,27 The exceptions are the American Society of Echocardiography28 consensus document and recently published Canadian guidelines that formally classify patients with subclinical atherosclerosis as high risk and recommend preventive measures as intensive as those to be employed with any other secondary prevention patient.29 Bearing in mind the healthcare reality of many countries, the chances of carotid Doppler echocardiography being widely used to detect incipient atherosclerosis and, therefore, “adjust” our patients’ risk categories is, to say the very least, debatable.30 Possible access to equations that predict events on a longer time-scale but are based on traditional risk factors, inexpensive, and easily obtained, constitutes an attractive alternative. In patients in the prospective Framingham study who were free of cardiovascular disease at 50 years of age, the risk of an event occurring at any time in their lives (up to the age of 95) was 51.7% (95% CI, 49.3%-54.2%) in men, and 39.2% (95% CI, 37%-41.4%) in women, with a median survival of 30 and 36 years, respectively.31 Evaluation of long-term risk is particularly relevant in younger people because if we only pay attention to short-term risk we could discourage many of them from modifying their lifestyle and, ultimately, accepting a treatment regimen. In our study, the FS30L reclassified 70% of the population and 71% of the low risk subgroup. Similarly, with FS30I, 73% of all patients were reclassified, as were 75% of the low risk subgroup. Concordance between FS10 and FS30 in classifying the population as being low risk or not was low. The motivations for implementing preventive measures (and for their intensity) on the part of physicians, and for maintaining regimens on the part of patients, differ according to the way in which baseline cardiovascular risk is presented.
In our study, the area under the ROC curve for FS30L and FS30I to discriminate between individuals with or without CAP was good. The OCPs of 26% and 22% for FS30 based on lipids and FS30 based on body mass index, respectively, had high sensitivity. The negative predictive value was high, indicating that if the FS30 is below the OCP, the likelihood of presenting CAP is low. An exploratory cutoff point of 13%-14% increased sensitivity, which implies greater certainty when rejecting the possibility of CAP. On the other hand, a 44%-45% cutoff point increased specificity and, therefore, positive predictive values for detecting plaque. Therefore, the exploratory cutoff points mentioned “sensitize” FS30 results because they automatically reclassify those individuals with OCP <13%-14% or ≥44%-45% to a level of very low risk or very high risk, respectively. Looking at the ROC curve, 3 areas with different clinical implications remain. The extremes, below the exploratory cutoff point for high specificity and above the exploratory cutoff point for high sensitivity, accurately confirm or reject the presence of CAP. The area between the OCP and the exploratory cutoff point for high specificity corresponds to the points of greater uncertainty, where detecting CAP could add prognostic information. Finally, the area between the point of high sensitivity and the OCP corresponds to cutoff points that discriminate adequately between patients with or without carotid plaque. Here, decisions to request another method of confirming the presence of CAP remain in the hands of physicians, based on their clinical judgment and the conditions of the healthcare centers where they work.
LimitationsIn our study, CAP was defined according to the Atherosclerosis Risk in Communities study criteria. However, no clear, uniform definition exists in the literature.32 Changing the definition of plaque could modify our results. Currently, some expert recommendations consider subclinical carotid atherosclerosis as the presence of plaque and/or >1mm intima-media thickness. Analysis of this data point was not included in the present study.
This study was not intended to determine whether risk reclassification was correct. A 30-year follow-up cohort study would be needed for this.
We believe a selection bias may exist in our sampling, as patients attending the cardiovascular prevention clinic do not necessarily represent the general population. Studies in progress in our center will extend knowledge of this topic in a more representative sample and will be published in due course.
The small proportion of high-risk patients in our study prevents us from drawing conclusions about this subgroup.
Clinical ImplicationsMeasuring total cholesterol and high density lipoproteins cholesterol is inexpensive; determining body mass index costs nothing at all. Hence, the FS30 could be used in most centers to improve primary prevention strategies in a high proportion of patients needing to be investigated for subclinical atherosclerosis.
ConclusionsIn this primary prevention population, the new FS30 reclassified a large number of patients, regardless of the model (lipids or body mass index) used. Moreover, we found a strong association between FS30-estimated risk and prevalence of CAP. The FS30 proved useful in predicting diagnosis of CAP and, perhaps, in improving cardiovascular risk stratification in a population classified as low risk by the traditional FS10, although this last hypothesis would need to be proved by validating the risk functions.
Conflicts of interestNone declared.
Received 6 July 2010
Accepted 5 November 2010
Corresponding author: Gascón 450, Ciudad Autónoma de Buenos Aires, C1181ACH Argentina. walter.masson@hospitalitaliano.org.ar