Keywords
INTRODUCTION
Hypertrophic cardiomyopathy (HCM) is a genetic disorder characterized by a hypertrophied non-dilated left ventricle (LV) with regions of myocardial fiber disarray. HCM is normally identified by an increased LV wall thickness, usually quantified by echocardiography or magnetic resonance imaging (MRI). The distribution of the hypertrophy may take many forms and vary greatly among patients but it is usually most prominent in the ventricular septum. In addition, the absolute thickness of the wall may differ greatly: while normal thickness of the LV is 12 mm or less, in HCM the thickness is usually 15 mm or more (up to extremely thick walls of more than 30 mm). It is known, however, that people with a mutant HCM gene may have normal wall thickness1. Moreover, excessive thickening of the heart muscle may occasionally occur as part of other diseases, such as mitochondrial disorders or Fabry's disease.1
Besides HCM, other examples of left ventricular thickening (ie, hypertrophy) are hypertensive left ventricular hypertrophy (HT-LVH) and athlete's heart (physiological remodeling). All these forms can present overlapping cardiac hypertrophy phenotypes as determined by conventional echocardiography.2,3 Ultrasound tissue velocities and deformation analysis have been recently introduced to study and to distinguish HCM from other forms of left ventricular hypertrophy (LVH).4-6
In HCM, even if global ventricular function appears normal, regional myocardial function and long-axis motion are significantly impaired. All studies quantifying myocardial deformation in HCM conclude that regional deformation is overall decreased compared to normal subjects.7-9 Traditionally, either tagged MRI or ultrasound strain imaging is used to determine global or regional strains, averaged over the whole population.
However, it has been suggested that HCM (as opposed to HT-LVH or athlete's heart) is associated with regions where deformation is absent or severely reduced, while other segments show normal strain.5 This results in an overall decrease when average strain is calculated. In order to maintain the diagnostic information from the inhomogeneous amplitude and spatial location of the regional deformation in HCM, we propose to calculate the distribution of the strain values from tagged MRI of the whole LV. Comparing the distributions from pathological and normal ventricles should easily identify both the overall decrease in deformation and the presence of segments with abnormal strain.
The purpose of the present study was to characterize regional systolic deformation measured using tagged MRI and a nonrigid registration approach in HCM and to compare it with other forms of LVH such as HT-LVH and athlete's heart.
METHODS
Study Population and Data Acquisition
In total, 44 subjects were included in the study. From these, 12 (8 males, aged 61.4±14.1 years) were diagnosed with HCM (4 obstructive and 8 nonobstructive asymmetrical septal hypertrophy cases), 10 (6 males, aged 64.1±16.6 years) were diagnosed with HT-LVH, 10 were healthy trained cyclist athletes (10 males, aged 23.2±3.0 years) and 12 were healthy sedentary controls (8 males, aged 28.7 ± 2.7 years). The diagnosis of HCM was made by echocardiography in the absence of other causes such as systemic hypertension or aortic stenosis which could lead to LVH. The diagnosis of HTLVH was based on the evidence of concentric LVH by echocardiography and sustained increase in systolic blood pressure (above 140 mmHg) and/or diastolic blood pressure (above 90 mmHg), in the absence of other causes of secondary hypertension. In all cases, the diagnosis of LVH was confirmed by MRI. Baseline characteristics of the studied population are listed in Table 1. The study complied with the declaration of Helsinki and informed consent was obtained from each participant.

Imaging was performed in breath-hold using a General Electric Signa CVi-HDx, 1.5 T scanner (General Electric, Milwaukee, USA). A SPAMM grid tag pattern was applied, starting at enddiastole. The slice thickness was 8 mm with an in-plane resolution of 0.78 mm ´ 0.78 mm and no gaps between slices. The tagging flip angle was 20º with vertical and horizontal tag spacing of 6 mm. Thirty phases were reconstructed per cardiac cycle, each one comprising 8 to 10 slices in short-axis and 3 to 6 slices in long-axis, covering the whole of the LV. For 24 of the 38 sequences, long-axis images were acquired as parallel planes; the rest were acquired as three radial planes with tag plane orientations of 0º, 45º and 90º around the LV central axis.
The first phase corresponded to end-diastole, and end-systole was defined as the phase with minimal intraventricular area (visually estimated from the tagged images). The number of systolic phases varied from subject to subject but constituted approximately one third of the cardiac cycle. For the registration and deformation analysis, only the systolic phases plus one diastolic phase were used since the tags faded to undetectable levels by early diastole, making it impossible to track myocardial deformation from that phase on.
Additionally, for HCM patients, late gadolinium enhancement (LGE) MRI was obtained 10 minutes after injection of 0.2 mmol/kg IV of gadopentate dimeglumine contrast. The LGE images were acquired using an inversion recovery sequence with 8 mm slice thickness at the same position as the short-axis tagged images in end-diastole.
Data Analysis
The strain tensor was computed from tagged MRI sequences applying a nonrigid registration algorithm.10,11 When parallel long-axis views were available, both short-axis and long-axis views were used.10 Through registration, the correspondences between the myocardial points in end-diastole and the myocardial points in each of the systolic phases were established.
To reduce the high computational cost of registration, we used a two-level acceleration strategy where registrations of consecutive images in the sequence are distributed over different multiprocessor nodes of a grid computing infrastructure and, within each node, the process is optimized by using different parallelization techniques.11,12 This acceleration strategy allowed noticeably speeding up the registration process and lowering the strain computation times to manageable values (approximately 1 minute instead of 65 minutes per patient). The grid infrastructure consisted of a 24-node SGI Altix ICE 8200 cluster, each node running two quad-core Intel Xeon (2.66 GHz CPU, 16 GB RAM) processors, for a total of 192 CPUs.
The strain tensor was then obtained from the analytical expression of the spatial gradient of the displacement field (obtained by the registration process) and projected onto the radial and circumferential directions corresponding to the geometry of the heart at end-diastole (ie, the nondeformed state). Negative values indicate shortening (or thinning), and positive values indicate lengthening (or thickening). For each direction and each time frame, the strain data was averaged into 16 regions (apex excluded) in accordance with the standard segmentation proposed by the American Heart Association.13 Peak strain was determined as the maximum strain magnitude on the strain curve. Subsequently, the distribution (histogram) of the peak strain values was obtained by considering the location-independent frequency of the segmental peak strain values.
Myocardial fibrosis was assessed by LGE. The LGE image set was reviewed by 2 blinded observers for the presence of hyperenhancement in each myocardial segment of the HCM patients. This hyperenhancement reveals areas of increased interstitial space in the myocardium, which in the case of HCM is likely due to myocardial fibrosis.
Statistical Analysis
The empirical strain distributions were compared with a Gaussian curve. Some of them showed a slight deviation from normal distribution. These observations were supported by performing the Shapiro-Wilk test for normality. The homogeneity of variance among different groups was tested using both the Levene's test and the Brown-Forsythe test. We concluded from these tests that not all variances could be assumed equal. Hence, comparisons between different study groups were done using Welch's test (ie, unequal variance t-test) which is robust even if the distributions are only approximately normal. Dispersion of strain (non-normal with variance homogeneity data) was compared between groups with a Mann-Whitney U test. Due to the descriptive exploratory character of the present study, no adjustment for multiple comparisons was made. Results were expressed as mean ± standard deviation, and the differences were considered statistically significant at a two-sided P value <0.05. The current study had adequate power (above 90%) to detect statistically significant differences in strain values.
RESULTS
Some individual segments (14 in the normal volunteers, 9 in the HCM patients and 6 in the HTLVH patients), corresponding mostly to the apical level, were excluded from the statistical analysis due to the poor quality of the images (low tag contrast which led to registration artifacts). Thus, a total of 675 (95.9%) segments out of 704 were evaluated.
Tables 2 and 3 present the average radial and circumferential peak systolic strains in each segment for all studied groups.


Controls showed a regional strain pattern in agreement with previous studies.14-16 Radial strain was highest in the anterior and lateral wall. Circumferential strain varied more predictably (less variance), tending to be greatest in the septum and gradually increasing from base toward the apex.
The athletes had radial strain decreased in almost all myocardial segments compared with controls, especially in the anterior and lateral walls. Circumferential strain was equal or slightly less than controls except for anterior and anterolateral regions at mid and apical levels where it increased. Globally, radial strain was lower (17.4±3.9 vs 22.7±4.5%; P = 0.0007) whereas circumferential strain showed no significant difference with respect to controls (-13.6±2.9 vs -13.6±2.2%; P = 0.38).
Hypertrophic cardiomyopathy patients had significantly reduced strain values in all 16 segments when compared to other groups. The radial strain was generally larger at the lateral wall than at the septum. Circumferential strain was particularly diminished in inferior and inferoseptal regions at the basal and midventricular level, and in the septum and lateral wall at the apical level. On average, HCM patients presented a lower mean with larger deviation than all other groups: compared to controls (13.8±5.2% vs 22.7±4.5%, P <0.0001 in the radial direction; -9.2±3.4% vs -13.6±2.2%, P <0.0001 in the circumferential direction), compared to athletes (13.8±5.2% vs 17.4±3.9%, P <0.0001 in the radial direction; -9.2±3.4% vs -13.6±2.9%, P <0.0001 in the circumferential direction), and compared to HT-LVH (13.8±5.2% vs 20.1±3.8%, P <0.0001 in the radial direction; -9.2±3.4% vs -11.3±3.1%, P = 0.04 in the circumferential direction).
HT-LVH patients showed strain reduction compared to controls (20.1±3.8% vs 22.7±4.5%; P = 0.09 in the radial direction; -11.3±3.1% vs -13.6±2.2%; P = 0.01 in the circumferential direction). Differences were especially marked in the septum at the basal and medial levels, while all other segments did not differ significantly.
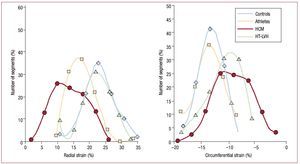
Figure 1 shows the distribution of the radial (left) and circumferential (right) peak systolic strain for every study group, considering all the evaluated segments independently of their location. Each distribution curve shows the proportion of segments (vertical axis) over the range of strain values observed (horizontal axis). From Figure 1, it is clear that while the deformation in controls, athletes and HT-LVH is concentrated around the mean value, in HCM there is a coexistence of segments with normal contraction and segments with absent or significantly reduced deformation, resulting in a greater variability of the values.

Figure 1. Distribution of radial (left) and circumferential (right) peak systolic strain in control group (blue solid line), athletes (magenta dotted line), HCM group (red dashed line) and HT-LVH group (green dot-dashed line). Positive values indicate thickening while negative values indicate thinning. The significant higher spread in HCM results from the coexistence of segments with impaired deformation and segments with normal contraction.
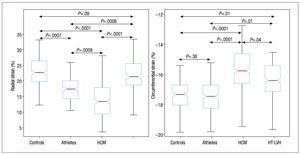
Figure 2 shows the boxplots of the strain distributions. In each box, the central mark is the median, the edges of the box are the first and third quartiles, the whiskers extend to the most extreme data values without considering outliers, and the outliers are plotted individually as crosses.

Figure 2. Boxplot of the radial (left) and circumferential (right) peak systolic strain distributions in the different study groups. Positive values indicate thickening while negative values indicate thinning. HCM group had the lowest median strain and the largest spread of strain values.
Tables 4 and 5 compare the dispersion (within a group) of radial and circumferential peak strain values. Variability of strain within each study group was quantified by measuring the coefficient of variation (ratio of standard deviation to the absolute mean value), range (difference between highest and lowest value) and inter-quartile range (difference between the third and first quartiles) of each individual's strain distribution, and averaging within each group. It should be pointed out, however, that the coefficient of variation (CV) is a more appropriate way of measuring dispersion than range or inter-quartile range (IQR), since data sets with different mean values are being compared. Radial dispersion (Table 4) was greater in controls and HCM patients than in athletes or HT-LVH patients. HCM patients presented a larger coefficient of variation (29.7±5.3% vs 21.0.0±2.2%; P <0.0001) than controls, but lower range (15.8±3.8 vs 17.7±1.5; P = 0.004). There were no significant differences for inter-quartile range between HCM and controls. Circumferential dispersion (Table 5) was significantly greater in HCM group than in any other.


In HCM patients, we could identify segments of very low deformation, while such segments were not present in either the controls, athletes or HTLVH (where the strain values were always above 9% for the radial direction and below -6.5% for the circumferential direction). Moreover, the presence of at least one segment with extremely low deformation (below 3.5 standard deviations from the controls) differentiated HCM from HT-LVH and athlete's heart with a sensitivity of 84% and a specificity of 100% when using the radial strain, and a sensitivity of 100% and a specificity of 100% when using the circumferential strain. This discrimination was not possible when looking only at the global average strain. Using the CV, ROC analysis for discrimination between HCM and HT-LVH showed the optimal cut-off value for radial CV to be 24.7% (sensitivity 91.6%, specificity 85.7%, accuracy 89.5%) and for circumferential CV 24.5% (sensitivity 75%, specificity 100%, accuracy 84.2%).
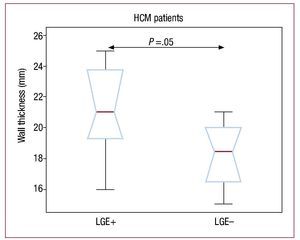
For HCM patients, we also evaluated the relationship between non-deformed segments (assessed by strain analysis), maximum end-diastolic myocardium wall thickness and fibrosis (assessed by LGE imaging). LGE occurred in 8 (67%) of the 12 patients with HCM. More specifically, it occurred in 30 (16.4%) of the 183 analyzed segments, being predominant in the most hypertrophied regions and most often in the anteroseptal and inferoseptal segments. Of the 30 LGE segments, 18 (60%) were non-deforming segments. This contrasts with the non LGE segments, of which only 18 (11.8%) of 153 segments were non-deforming. These results are summarized in Table 6. The relationship between LGE and maximum wall thickness is shown in Figure 3. In general, patients with positive LGE had higher maximum end-diastolic wall thickness (21.1 ± 3.1 mm) than patients with negative LGE (18.2 ± 2.5 mm), but the differences were not statistically significant (P = 0.1).


Figure 3. Boxplot showing the relation between the maximum end-diastolic wall thickness and LGE in the HCM group. Patients with LGE had higher wall thickness.
Non-deforming segments were found in 36 (19.7%) of the 183 analyzed segments. They had a nonuniform distribution, although they were more frequently (69%) detected in the septum and, since the HCM patients had septal asymmetrical hypertrophy, within the thickest myocardial segments. Among the non-deforming segments, LGE was detected in 18 (50%) of the 36 segments. In contrast, only 12 (8.2%) of the 147 deforming segments showed LGE. These results are shown in Table 7.

DISCUSSION
While all forms of LVH show thickening of the myocardium, each of the different etiologies has a specific signature in regional deformation changes.
Our results, along with previous studies, confirm that regional deformation is impaired in LVH and provide information about the heterogeneity of the dysfunctional regions.Hypertrophic cardiomyopathy is histologically characterized by myocyte disarray resulting in local dysfunctional myocardium and potentially abnormal increase of fibrotic tissue.17,18 Kim et al19 demonstrated that, regardless of myocardial hypertrophy, the presence of regional fibrosis is associated with decreased (circumferential) strain. It has also been shown that regional function is decreased in association with the degree of hypertrophy.7,20 Thus, the regional variation in the myocardial disarray and fibrosis may explain the heterogeneity in regional function that has been frequently reported in HCM.7,9,19,20 Our results showed that the HCM patients had significantly reduced strain values in all 16 segments even in the absence of fibrosis or hypertrophy. Circumferential strain was noticeably reduced in the inferior and inferoseptal wall at the basal and midventricular level, and in the septum and lateral wall at the apical level. These results are in agreement with previously reported studies.7-9 The coexistence of segments with normal contraction and segments where deformation was absent or significantly reduced explains the larger deviation of HCM with respect to the other study groups. Depending on the particular patient, these nondeforming regions were located anywhere within the LV, but they were most often localized in the septum, while in the lateral wall deformation was usually normal. These findings are consistent with Orlando et al,5 in which HCM was shown to be characterized by the presence of nondeforming segments (detected by ultrasound strain imaging) distributed non-uniformly in the LV.
Nondeforming segments were present in all HCM patients, most often in the interventricular septum (69%) and among LGE segments (60%) but without being indicative of fibrosis (only 50% of the nondeforming segments showed LGE). At the same time, although the occurrence of fibrosis was significantly higher in nondeforming segments (50%) than in deforming segments (8.2%), the presence of LGE was not an accurate indicator of absence of deformation. These results suggest that absence of deformation is not systematically a response to fibrosis or hypertrophy (nor indeed is fibrosis or hypertrophy a response to absence of deformation). Hence, the presence of fibrosis or hypertrophy cannot always identify deformation abnormalities.
HT-LVH is characterized by increased LV mass and relative wall thickness21. It is often associated with concentric (symmetrical) hypertrophy and reduced global systolic function due to long-standing pressure overload.22 Further studies have shown a significant reduction in longitudinal deformation in the basal septum.5,22 In our study, we found that HT-LVH patients had slightly reduced global radial and circumferential strain when compared to normal subjects, with the most significant reduction in the inferoseptal and anteroseptal segments at the basal level. However, while overall decreased deformation was present, strain values were never as low as showing absence of deformation, as observed in HCM. This agrees with previous studies.5 We also found that HT-LVH patients showed dispersion in radial strain similar to controls, while dispersion in circumferential strain was larger. For both radial and circumferential strains, dispersion in HT-LVH patients was substantially less than that found for HCM patients.
Intensive regular training leads to several morphological and functional modifications in the heart. Athlete's heart refers to LV adaptation to long-term intensive endurance training characterized by an increase in chamber size, wall thickness and mass.23 However, these changes may also be an early sign of cardiac diseases for those who have inherited tendencies to develop enlarged and thickened hearts, hypertrophic cardiomyopathies, or similar abnormalities. Thus, differential diagnosis between pathological and physiologic (nonpathological) responses is critical. Peterson et al24 proposed to use MRI-derived LV volume and geometric indices to distinguish athlete's heart from pathological forms of LVH. These indices, however, could not discriminate between HCM and HT-LVH. On the other hand, there are few studies on regional myocardial strains for endurance athletes and sometimes contradictory results have been reported. A study by Richand et al25 using ultrasound speckle tracking showed that the physiologic hypertrophy that occurs in elite athletes can be distinguished from pathological hypertrophy using myocardial deformation analysis. They found that radial and circumferential strains were significantly higher in athletes compared to controls and HCM patients. Recently, a study by Nottin et al26 using tissue Doppler showed that apical radial strains were lower in cyclists than in controls, whereas no significance difference was found for the circumferential strain. The results of our study showed that in athletes radial strain was lower than in controls, especially in the apical level and the anterior and lateral walls. We also found that circumferential strain was equal or slightly less than in controls, except for anterior and anterolateral regions at mid and apical level where it increased. Similar results were reported by Baggish et al27 The authors hypothesized that this behavior may be due to simultaneous adaptation of the right ventricle.
Finally, it is worth mentioning that the use of our two-level acceleration registration algorithm significantly reduced the time for the MRI tagging-based strain computation, such as to make it a real-time technique in clinical practice.
In summary, the results of this descriptive study suggest that the use of strain distribution is valuable as part of the assessment of LVH. In particular, our results show that: 1) in patients with LVH, strain distributions identified systolic dysfunction because strain was significantly reduced (lower mean); 2) HCM patients showed greater heterogeneity (wider dispersion) in the magnitude of the strain values and presented at least one nondeforming segment; and 3) HT-LVH patients showed reduced circumferential strain, especially in the basal septum, but none of the segments were nondeforming. Thus, the use of strain distributions is a useful tool to evaluate myocardial abnormality in HCM patients, and to differentiate HCM from other forms of hypertrophy.
Study Limitations
One limitation that may influence strain estimation is the artifacts caused by position shift between breath-holds. This complicates the extraction of the epi- and endocardium surfaces, which are needed for defining the radial and circumferential directions. A shift correction algorithm such as the one proposed by Lötjönen et al28 may help to circumvent this problem. In general, images with smaller tag spacing and higher resolution or, alternatively, advanced tagging techniques such as 3D CSPAMM29 would need to be used to improve the strain quantification. Another potential weakness is the multiple testing, which increases the risk of reporting a significant difference when there are none. However, as the P-values for the main results were normally below 0.001, the chance of finding a false positive is low. Other important limitations of our clinical study include the limited size and age mismatch between healthy and pathological populations. Although our study was based primarily on deformation characterization of typical groups of patients, it would be interesting in the future to evaluate myocardial deformation in young patients with HCM and without phenotypic expression.
CONCLUSIONS
Using tagged MRI, and a fast nonrigid registration algorithm for strain quantification, allows for easy construction of the strain distributions. The analysis of these distributions characterizes the specific pattern of myocardial deformation in patients with different etiologies of LVH. In HCM, average strain was significantly lower compared to controls, athletes and HT-LVH, and nondeforming regions were found, resulting in greater heterogeneity of the strain values. These findings may provide important information in hypertrophic diseases to establish a differential diagnostic.
ABBREVIATIONS
HCM: hypertrophic cardiomyopathy
HT-LVH: hypertensive left ventricular hypertrophy
LV: left ventricle
LVH: left ventricle hypertrophy
MRI: magnetic resonance imaging
LGE: late gadolinium enhancement
Full English text available from: www.revespcardiol.org
This work was partially funded by the Industrial and Technological Development Centre (CDTI) under the CENIT Programme (CDTEAM project) and the European Community's Seventh Framework Programme (FP7/2007-2013) [grant number 224495] (euHeart project). G. Piella was supported by the Ramón y Cajal Programme from the Spanish Ministry of Science and Innovation.
Correspondence: Dra. Gemma Piella.
Universitat Pompeu Fabra.
Roc Boronat, 138. Barcelona 08018. Spain
E-mail: gemma.piella@upf.edu
Received March 15, 2009.
Accepted for publication June 1, 2010.