INTRODUCTION
Analysis of the characteristics of electrophysiological signals can help to identify regions of interest associated with the mechanisms involved in different types of arrhythmias. The information obtained can facilitate selective interventions involving radiofrequency ablation (RF).1,2 In this sense, locating areas of post-infarct scarring has proved to be useful in identifying target zones during treatment of ventricular tachycardia.3-6
On the other hand, RF also modifies the substrate and thereby alters the characteristics of the signals recorded. Although information is available on changes in the time domain of atrial and ventricular signals in regions with RF lesions,7-13 information on changes in the frequency domain is scarce. This should be taken into account when interpreting recordings obtained during RF ablation procedures or in patients who have undergone ablation procedures.
Spectral techniques are used to analyze both atrial and ventricular (VF) fibrillation. The information provided includes the frequency domain of the spectrum, which is directly related to myocardial activation frequency.14-19 Using these techniques it is possible to identify regions20,21 which may be of interest for local interventions. Spectral analysis can likewise help to detect fibrillatory processes, define their characteristics, and apply automatic defibrillation procedures.
RF ablation reduces electrogram amplitude in zones with lesions, but information is not available about its effects on spectral characteristics, including parameters such as signal frequency which are related with spectral power and energy. In the present study, an experimental model with isolated rabbit heart preparations was used to evaluate the hypothesis that the spectral characteristics of VF recordings obtained in zones with RF lesions would be significantly altered and that these alterations, as well as those observed in the time domain, could be helpful in determining whether recordings were performed in zones with lesions.
METHODS
Experimental Preparation
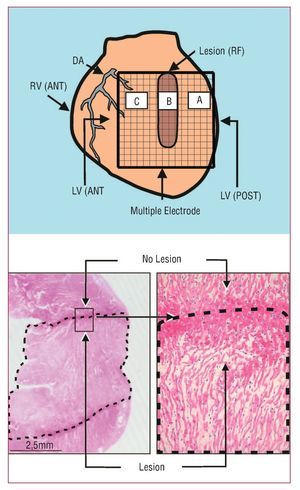
The procedures used in this study followed current guidelines on the care and use of animals in research laboratories. Isolated perfused New Zealand rabbit hearts (n=11; weight, 2.7 [0.3] kg) were used. After anesthesia (ketamine 25 mg/kg im) and heparinization, the heart was removed and submerged in cold Tyrode's solution (4ºC). After isolating the aorta, a Langendorff system was connected to perfuse Tyrode, as in earlier studies.18,19 Ventricular electrograms were recorded using a multiple electrode, composed of 235 unipolar electrodes (diameter, 0.125 mm; distance between electrodes, 1 mm; surface covered, 225 mm2), located on the epicardium of the left ventricular free wall. An Ag-AgCl reference electrode located above the aorta was used. Ventricular stimulation was performed using a bipolar electrode and a GRASS S88 stimulator with a stimulus isolation unit (SIU5). The recordings were obtained using a cardiac mapping system (MAPTECH) with frequency bands between 1 and 400 Hz. VF was induced using increasing frequency stimulation. Perfusion was maintained during the arrhythmia. Recordings were obtained at baseline and after performing a transmural RF lesion in the left ventricular wall from the base to the middle zone of free wall (Figure 1). A needle electrode was used to produce the lesion (diameter, 0.5 mm) through top down consecutive punctures in the ventricular wall. At each puncture site, RF was applied at 10 W for 20 s, using an Osypka HAT 100 generator. The dispersive pad was located on the aortic cannula used for perfusion. After administering RF, VF recordings were obtained after an interval of at least 10 min, with the multiple electrode located at the same position and covering both the zone with the lesion and the surrounding undamaged myocardium. Four fixed points marked on the ventricular wall were used to ensure that the electrode was always located in the same position.

Figure 1. Upper: diagram showing the multiple electrode on the zones with (B) and without (A and C) lesions. Lower: section of the left ventricular wall with the lesion (dotted line) produced by radio-frequency (HE, ´4). The lesion is trans-mural and well-defined. On the right, one of the edges of the damaged zone is shown (HE, ´25). DA indicates descending anterior artery; LV(ANT), left anterior ventricle; LV(POST), left posterior ventricle; RV(ANT), right anterior ventricle.
Data Analyzed
Electrogram Spectral Analysis During VF
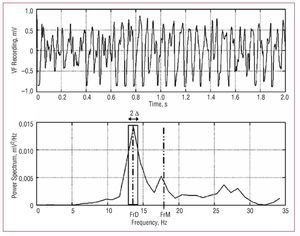
Welch's method22 was used to obtain the power spectrum (Figure 2) of the signals recorded with 15 unipolar electrodes located in the 3 selected zones (5 electrodes for each) (Figure 1). Zone A corresponded to undamaged tissue and was located 4 mm to the right of the lesion, zone B was in the center of the lesion, and zone C corresponded to undamaged tissue 4 mm to the left of the lesion. We analyzed blocks of 4096 points (sampling frequency, 1 kHz) without zero padding. Data were processed with Matlab running on the Hewlett-Packard 712/80 platform. The following parameters were determined:

Figure 2. Power spectrum for one of the VF recordings. The dominant frequency (DFr) and its spectral density is shown, together with the mean frequency (MFr), and the spectral power in the DFr (1) Hz (2 D) band used to calculate the normalized energy around DFr. A total of 2 s of VF are shown to improve observation of the signal. The spectral analysis used 4 s segments.
- DFr: dominant frequency (Hz) or frequency of the power spectrum with the greatest amplitude, determined at a resolution of 0.5 Hz
- MFr: mean spectral frequency (Hz)
- densDFr: spectral density of the dominant frequency (mV2/Hz)
- densMFr: spectral density of the mean frequency (mV2/Hz)
- EnDFr: normalized spectral energy around the dominant frequency (DFr [1] Hz) (dimensionless)
- SDPSp: standard deviation of the power spectrum (mV2/Hz)
Electrogram Time-Domain Analysis During VF
The following morphological characteristics of the electrograms were determined within the same time window:
- MAmpl: mean signal amplitude (mV)
- SDAmpl: standard deviation of the signal amplitude (mV)
- RMSAmpl: root mean square of the signal amplitude (mV)
- MdV/dt: mean dV/dt of the maximum negative slope of the electrograms (mV/ms)
- SDdV/dt: standard deviation of the maximum negative slope of the electrograms (mV/ms)
Statistical Analysis
Numerical data were expressed as mean (1 standard deviation [SD]). Comparison tests were carried out using a repeated measures generalized linear model in which study phase and zones were included as factors. The Bonferroni test was applied in the post-hoc analysis. Differences were considered statistically significant at P<.05. ROC (receiver operating characteristic) curves were calculated (sensitivity with respect to 1-specificity) for each parameter. To identify the parameters which most accurately identified recordings made in a damaged zone, stepwise logistic regression was performed; the state variable was whether or not the recording was made in the zone with the lesion. Variables included in the model were those which independently contributed to identifying the state variable. Analyses were performed using the SPSS statistical package.
RESULTS
The RF lesions had a mean width and length of 3.2 (0.4) and 11.4 (0.6) mm, respectively. Macroscopic and microscopic analysis indicated that lesions were trans-mural and well-defined (Figure 1).
Frequency Domain Parameters
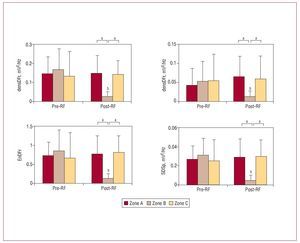
At baseline, before RF, there were no statistically significant differences between the 3 zones studied in terms of densDFr, densMFr, EnDFr, and SDPsp (Figure 3). DFr was significantly greater in zone C (zone A, 14.9 [5.2] Hz; zone B, 16.2 [5.6] Hz; zone C, 17.9 [4.2] Hz; P<.01). There were no statistically significant differences in MFr values (zone A, 17.4 [3.2] Hz; zone B, 17.7 [3.4] Hz; zone C, 18.8 [3.2] Hz).

Figure 3. Values (mean [standard deviation]) of frequency domain parameters which varied significantly in the damaged zone. densDFr, spectral density of the dominant frequency; densMFr, spectral density of the mean frequency; EnDFr, normalized energy of the spectrum in the DFr (1) Hz band; RF, radio-frequency; zone B, zone with lesion; zones A and C, zones without lesions; SDPsp indicates standard deviation of the power spectrum. aSignificant differences between zones: baseline and post-RF ablation. bSignificant differences with respect to baseline values.
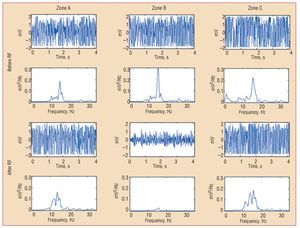
After the lesions were produced, densDFr, densMFr, EnDFr, and SDPsp decreased significantly in zone B (zone with lesion). Differences with the undamaged zones were also statistically significant (Figures 3 and 4). DFr and MFr did not vary significantly in zone B (DFr after RF, 14.8 [1.8] Hz, non-significant with respect to control; MFr after RF, 16.6 [1.3] Hz, non-significant with respect to control). In the zones without lesions, no significant before-after variations were observed, except for DFr in zone C, which decreased significantly (DFr after RF, 14.9 [2.8] Hz; P<.001 compared to control).

Figure 4. Electrograms of ventricular fibrillation and the corresponding power spectrum obtained from one of the electrodes located in each zone before and after radiofrequency. densDFr, spectral density of the dominant frequency; densMFr, spectral density of the mean frequency; EnDFr, normalized energy of the spectrum in the DFr (1) Hz band; RF, radio-frequency; SDPsp indicates standard deviation of the power spectrum; zone B, zone with lesion; zones A and C, zones without lesions.
Time Domain Parameters
At baseline, differences were observed between zones B and C on the MAmpl, SDAmpl, MdV/dt and SDdV/dt variables, and between zones A and B on the MdV/dt and SDdV/dt variables (Figure 3). RMSAmpl was significantly lower in zone C than in zone B (2.193 [0.707] and 2.520 [0.593]; P<.05). After RF, MAmpl, SDAmpl, SDdV/dt, and RMSAmpl decreased significantly in zone B, and corresponding MdV/dt values were significantly less negative (Figure 5). Differences with respect to the zones without lesions were also significant. In this phase, statistically significant differences were observed between the MdV/dt and SDdV/dt of zones A and C; the difference in SDdV/dt was also present at baseline.

Figure 5. Values (mean [standard deviation]) of time domain parameters which varied significantly in the damaged zones. MAmpl, mean signal amplitude; MdV/dt, mean of the maximum negative slope of all electrograms; RF, radio-frequency; SDAmpl indicates standard deviation of signal amplitude; SDdV/dt, standard deviation of the electrogram's maximum negative slope; aSignificant differences between zones: baseline and post-RF ablation. bSignificant differences with respect to baseline values.
Frequency Domain Predictive Models
When we examined each of the variables one by one to determine whether the recordings corresponded to a zone with a lesion, the area under the ROC curve was >0.8 for all of the parameters, except DFr (area=0.53) and MFr (area=0.56) (Table 1). Table 1 shows the cut-points and their corresponding sensitivity and specificity.

The logistic regression analysis showed that the frequency domain variables which contributed independently to identifying a zone with a lesion were SDPsp and densMFr. Their corresponding odds ratio (OR) and 95% confidence intervals (CI) are shown in Table 2. The ORs are <1 and indicate that, when the parameters are within the values established using the cut-points from the ROC analysis, the probability that the recordings were made in the damaged zone is statistically significant.

Time Domain Predictive Models
The area under the ROC curve for all variables was >0.9 in all cases. Table 1 shows the cut-points and their corresponding sensitivity and specificity. The logistic regression analysis showed that the time domain variables which contributed independently to identifying the zone with the lesion were MdV/dt and SDAmpl. Their corresponding odds ratio (OR) and 95% CI are shown in Table 2.
DISCUSSION
The study's main findings are that: a) parameters associated with the spectral power and energy of VF recordings were significantly altered in zones with radiofrequency lesions and that they could be used to identify zones with lesions; and b) there was no significant change in either the dominant or mean frequency in zones with lesions.
Modification of VF Time Domain Characteristics in Zones With Lesions
RF thermal lesions cause coagulation necrosis which suppresses the myocardium's active electrical properties and alters the characteristics of the electrograms.23-29 The structural damage makes it impossible to create action potentials and the tissue is converted into a passive or electrotonic transmission zone for potentials generated in adjacent, undamaged myocardium.9-11,23,25,27-29 The analysis of the electrograms generated in the atrial or ventricular zones with RF lesions, both during sinus rhythm and in the context of certain arrhythmias, showed variations in the amplitude and speed of the deflections, with a reduction in the maximum negative slope.7-9,11-13 Alterations in repolarization with changes in the amplitude of the T wave and displacements in the ST segment were also observed.29 The decrease in amplitude has been used as a marker of a lesion in ventricular myocardium,12,13 although the amplitude can decrease as a result of a deficient contact with the electrodes.30 Chronic myocardial ischemia reduces the voltage of ventricular electrograms,31 and the recording of distant signals can also reduce this parameter's usefulness.13,32 On the other hand, zones of post-infarct scarring give rise to similar changes as those produced by RF and it has been observed that electrogram voltage is correlated with the presence of ventricular scars.33,34 The decrease in the density of viable myocytes in the infarcted regions leads to a reduction in electrogram amplitude and a reduction in the speed of the unipolar signals.35 Experience gained in mapping studies has shown that information obtained by analyzing amplitude, the negative slope of the electrograms, or the duration of the signals can help in identifying scarred tissue.3,4,33,36 Alternative methods to evaluate RF lesions have also been studied, including the increase in the stimulation threshold after ablation.13 In the present study, the analysis of VF recordings confirmed that the lesions caused by RF can also significantly alter VF parameters in the time domain and that the indicators obtained are useful in differentiating between damaged and undamaged myocardium.
Modification of VF Frequency Domain Characteristics in Zones With lesions
Spectral analysis of VF has been used to obtain information on myocardial activation during arrhythmia and the modifications produced by several factors including drugs, ischemia, stretching, or variations in temperature.14-17 Because it alters the electrophysiological properties of the myocardium and the characteristics of the electrograms, RF ablation also modifies their spectral characteristics.
The dominant frequency corresponds to the frequency with the greatest spectral density and is closely related to the inverse of the mean activation cycles during VF. When we analyzed parameters directly related with the activation frequency, such as DFr or MFr, we found that they were not useful in distinguishing normal myocardium from damaged myocardium. These findings are related to the recording of distant potentials originating with the depolarization of the undamaged myocardium surrounding the lesions. However, as mentioned above, the potentials recorded in zones with lesions showed a considerable decrease in amplitude secondary to tissue coagulation necrosis and the loss of potentials generated during local depolarization.13,32 Thus, while DFr and MFr, did not vary significantly in the damaged zone, the parameters related with the power and spectral energy varied significantly and were found to be useful in distinguishing between damaged and undamaged myocardium. The area under the ROC curve and the sensitivity, and specificity obtained separately for each parameter are similar to those obtained for the parameters in the time domain. The OR and their 95% CI obtained in the logistic regression analysis indicate the utility of these parameters in identifying zones with lesions, in a similar fashion to those in the time domain.
The practical consequences of applying this type of analysis during VF will be determined from the results of experimental studies designed to further knowledge of the effects of RF ablation in ventricular arrhythmias. Bearing in mind that spectral analysis of atrial fibrillation has been used to identify regions of interest20,21 and that these zones can be the target for therapeutic interventions, the study of the different parameters provided by this type of analysis could allow for a more rational use of RF ablation by broadening our knowledge of the phenomena involved. Using extracellular electrograms to identify zones with lesions helps to broaden our understanding of the characteristics of myocardial activation during electrical stimulation or arrhythmias. The present study has focused on the analysis of modifications in the signals recorded during VF and, while the analysis of the signals produced during atrial fibrillation is increasingly frequent in electrophysiological studies and during RF ablation procedures, signal recording during VF is less so. This is due to a large degree to the clinical characteristics of the arrhythmia itself. Nevertheless, this type of analysis provides additional information on the substrate and can help us to better understand this type of arrhythmia at a pathophysiological level.
Limitations
The results were obtained in an experimental model using epicardial recordings. This allowed for precise control both when causing the RF lesions and when placing the recording electrodes. However, the sensitivity and specificity cut-points are dependent on the model and the animal species used. For that reason, extrapolating these results to a clinical setting requires additional, specific studies. The results presented were also analyzed in the acute phase after production of the RF lesions. The scarring process, whilst it would not modify the loss of capacity to generate potentials in the necrotized zone, could alter the passive transmission of potentials generated in the undamaged zones. Further studies using chronic models are required to analyze any changes and their consequences.
CONCLUSIONS
During ventricular fibrillation, the spectral parameters associated with spectral power and spectral energy were significantly altered in zones with radiofrequency lesions and could be used to identify those zones. There was no significant change in either the dominant or mean frequency in these zones.
ABBREVIATIONS
DFr: dominant frequency
En: frequency spectrum energy MFr: mean frequency
RF: radio-frequency
RMS: root mean square
VF: ventricular fibrillation
Funding for this study was provided by Instituto de Salud Carlos III, Ministerio de Sanidad y Consumo, PI06/0758, RETIC RD06/0003/0010 (REDINSCOR), and Sociedad Española de Cardiología (grant number 2005).
Correspondence: Dr. F.J. Chorro.
Servicio de Cardiología. Hospital Clínico Universitario. Avda. Blasco Ibáñez, 17. 46010 Valencia.
España. E-mail: Francisco.J.Chorro@uv.es
Received August 27, 2007.
Acepted for publication January 8, 2008.