Keywords
INTRODUCTION
Coronary artery disease (CAD) is a pathology with complex aetiology that involves genetic and environmental factors and the interaction between the two. It is estimated that genetic factors could explain between 40% and 55% of the existing variability among the population (inheritability) in the development of CAD.1 Genome Wide Association (GWA) studies have been carried out over the last 3 years and have consistently identified new genetic variants associated with different complex diseases, including CAD.2-8 Whereas some of these genetic variants are also associated with a classic cardiovascular risk factor (CVRF), others are independent. The discovery of these genetic variants independently associated with CAD could make it possible to identify new aetiopathogenic mechanisms of CAD and new therapeutic targets. Furthermore, these variants could be used as new biomarkers to help improve coronary risk prediction, or to reclassify intermediate-risk individuals by adding new data to the classic risk equations.9 The improvement of risk equations by including new biomarkers is clinically significant since existing risk equation sensitivity is low and a large number of cases affect intermediate-risk patients.10
Recently the American Heart Association (AHA) published recommendations which define the different stages in the evaluation of new risk biomarkers and their subsequent application in clinical practice.11 In the first stage, known as "Proof of Concept," it is necessary to establish whether the level of exposure to the biomarker is different in individuals with and without the disease. In subsequent stages, cohort studies should be carried out to analyze any improvement in ability to discriminate, determine the effect on daily clinical practice and evaluate cost effectiveness.
The aims of this document are: a) to select genetic variants that are associated with CAD and independent of CVRFs; and b) to apply the first stage of a new biomarker evaluation process proposed by the AHA, which establishes the magnitude of the association between an individual genetic risk score, based on the number of accumulated risk alleles that each individual has within a set of selected genetic variants, and the presence of CAD.
METHOD
Study Design
A case-control study with in silico data from the Wellcome Trust Case Control Consortium (WTCCC).8
Study Sample
The cases (n=1988) were selected from the first phase of the WTCCC study.8 As described in the original study, the CAD cases presented a history of myocardial infarction or coronary revascularization (including coronary bypass surgery or coronary angioplasty) before the age of 66. The control subjects were selected from 2 studies included in the WTCCC project: a) 2706 control subjects from a British cohort of people born in 1958 (1958 Birth Cohort Controls [58C])12; and b) 2674 control subjects who were blood donors (UK Blood Services Controls [NBS])8. Although data from 3004 control subjects were presented in the original study,8 recently the individual level genotype data for 5380 control subjects were made available to the scientific community13 and included in this analysis.
Selection of Genetic Variants
The genetic variants were selected from the database of GWA studies (Catalog of GWA Studies) of the National Human Genome Research Institute (NHGRI).14 The selection criteria were that the genetic variants needed to be associated with CAD and be independent of CVRFs according to the data from this catalogue.14 To identify the variants associated with CAD, the following clinical terms were included in the search of the NHGRI Catalog of GWA Studies: Coronary Artery Disease, Coronary Disease, Myocardial Infarction, Early Onset Myocardial Infarction. Variants with a P value >1´10-6 in the variant discovery study were not included. Of the genetic variants associated with one another because of linkage disequilibrium (r2>0.9, HapMap CEU [residents of Utah with ancestors in Northern and Eastern Europe]), only one was selected. In order to exclude variants associated with CVRFs, any possible association between CVRFs and the genetic variant of interest or the chromosomal region where the variant could be found was explored in the NHGRI Catalog of GWA Studies; moreover, variants located within genes associated with CVRFs were excluded, taking into consideration the findings of previous studies (for example: the low density lipoprotein receptor gene [LDL], LDLR).
Quality control methods were applied to the results for all the genetic variants selected, verifying Hardy-Weinberg equilibrium in control subjects and that the frequency of the minority allele was greater than 1%. Quality control methods were also applied to individuals, excluding those participants who had no data for at least one of the genetic variants, as no score could be obtained for all possible risk alleles (19 individuals excluded).
A risk allele was defined for each of the variants, in other words, the nucleotide whose presence confers a higher risk of suffering a coronary event, according to the data provided from the variant discovery study.
Estimation of the Individual Genetic Risk Score
To calculate the genetic risk score, the number of accumulated risk alleles in each individual within the set of selected genetic variants was counted. Each individual might have 0, 1, or 2 risk alleles in each of the variants. By calculating the sum of the accumulated risk alleles within the set of selected variants (n=9), each individual is given a score from 0 to 18. It was assumed that the effect of the different alleles analyzed was similar and therefore they were all weighted the same.
The individual genetic risk score was also calculated, weighting each of the selected variants by the magnitude of their individual effect, which was extracted from the data presented in the variant discovery studies.
Statistical Analysis
In an initial analysis the selected genetic variants were analyzed individually and the association between each variant and the presence of CAD was established using an additive genetic model estimating the OR of the CAD per increase in risk allele frequency.
In order to consider the additive effect of the set of the different genetic variants selected, first the distribution of the number of accumulated risk alleles in cases and controls was analyzed and the difference in the mean genetic risk score between cases and controls was compared using the Student t-test.
Subsequently, logistic regression was used to estimate the association between the genetic risk score and the risk of CAD, and different types of analyses were carried out:
1. Firstly, the genetic risk variable was considered a categorical variable, taking the group of carriers of 7 risk alleles as the reference group, because this is the closest value to the median in controls and this group contains the highest number of individuals, which makes it possible to obtain more accurate risk estimators. The OR was estimated for each genetic risk score category (group of carriers of 8 alleles vs carriers of 7 alleles; carriers of 9 alleles vs 7; carriers of 6 alleles vs 7; and so on).
2. Secondly, the OR per increase in the frequency of risk alleles was calculated, treating this variable as continuous, assuming that risk is constant per increase in the frequency of alleles in the range of values observed; an analysis was carried out to determine whether the association between the number of alleles and the risk of CAD was linear.
3. Thirdly, the analysis described in paragraph 1 of this section was repeated, defining groups based on the genetic risk score quintiles obtained from the control group and using the first quintile as reference.
Any interaction between the genetic variants of interest was also analyzed to establish whether the combined effect of these was greater than the additive effect.
In all the analyses carried out, a P<.05 was considered statistically significant. The analyses were carried out using the R program.15
RESULTS
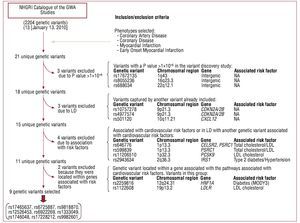
A total of 21 unique genetic variants was identified (Table 1) in the NHGRI Catalog of GWA Studies,14 and in the selected phenotypes. Figure 1 shows a flow diagram of the selection process of the genetic variants of interest in this study. Nine genetic variants associated with CAD independently of the CVRFs were selected using this procedure.


Figure 1. Flow diagram of the selection process of the genetic variants in the study.
Table 2 shows the results of the association of each of the 9 variants selected with CAD in the larger WTCCC sample analyzed in this study. In this analysis, most of the variants were associated with CAD, although there was an association in the expected direction for 2 variables, but did not reach statistical significance.

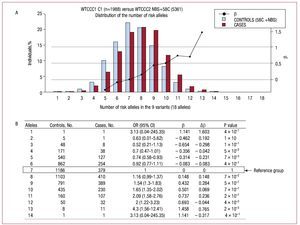
Figure 2A shows the distribution of the number of risk alleles in cases and controls. The distribution follows the same trend for both groups although there is a shift of data toward the right-hand side of the graph indicating the number of alleles in cases (mean risk alleles [typical deviation]: 7.9 (1.8) in cases and 6.8 [1.8] in controls, P value = 2´10-16).

Figure 2.A: the distribution of the percentage of individuals according to the number of risk alleles in the sample of cases and controls analyzed. B: the magnitude of association between the exposure to different categories of the number of risk alleles and the presence of coronary artery disease, defining the group with 7 risk alleles as the reference group. b indicates regression coefficient; Db, difference in the regression coefficient between consecutive categories of the number of risk alleles; OR (95% CI), odds ratio (95% confidence interval); 58C, control subjects in the study: 1958 Birth Cohort Controls8,23; NBS, controls in the study: UK Blood Services Controls.8
In order to establish whether the increased risk was different in the groups defined by the number of alleles, the magnitude of the risk of CAD was calculated for each group, using the group with 7 risk alleles as the reference group (median in controls). Figure 2B shows the OR and the regression coefficient value (b) for each group in relation to the reference group, the difference in value of the regression coefficients (Db) between consecutive categories, and the P value of the Fisher's exact test for differences between cases and controls. Figure 2A shows the regression coefficient values obtained (b) on a graph.
The increased risk per increase in the frequency of alleles seems to be constant within the range of values observed. To quantify this increase per frequency of alleles the variable number of risk alleles was considered as a continuous variable and it was estimated that the OR per increase in the frequency of alleles was 1.18 (95% confidence interval,1.15-1.22; P=2´10-16); this linear model explained 92% of the variability of the b values obtained.
When these analyses were carried out, weighting each of the selected variants according to the magnitude of their individual effect, the results were almost identical (OR per increase in the frequency of alleles = 1.18; 95% CI, 1.14-1.21).
No statistically significant interaction between genetic variants was observed, a result that also supports the additive effect of the variants analyzed.
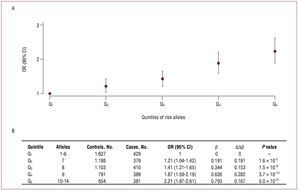
The results of the analyses defining 5 groups according to the quintiles of the number of risk alleles and using the quintile with the lowest number of alleles as reference are shown in figure 3A. The increases in risk (Db) between the consecutive quintiles are similar (mean increase of b, 0.198), and the OR between extreme quintiles is 2.21 (Figure 3B).

Figure 3.A: odds ratio and 95% confidence interval of the association between quintiles of the number of risk alleles and the presence of coronary artery disease, taking the quintile with the lowest number of risk alleles as the reference category. B: the magnitudes of said associations. b indicates regression coefficient; Db, difference in the regression coefficient between contiguous groups; OR (95% CI), odds ratio (95% confidence interval).
DISCUSSION
Nine genetic variants associated with CAD and which, according to current scientific knowledge, are not related to CVRFs were selected for this study. In accordance with the AHA recommendations regarding the evaluation of new risk biomarkers, the data of this study are consistent with the first stage of this evaluation; it has been observed that the number of accumulated risk alleles of these genetic variants is associated with the risk of presenting CAD.
We have demonstrated that the association between the number of risk alleles and the risk of CAD is linear and direct, therefore the higher the number of risk alleles, the greater the probability of presenting CAD. This linear association has been observed in other phenotypes like blood pressure16 and diabetes.17 In this study each allele was considered to be of similar weight and we did not weight the effect of each genetic variant according to the magnitude of its association with CAD, which is defined by the regression coefficient. We weighted the variants according to the coefficients obtained in our analysis in a sensitivity analysis and found that the results were similar to those presented. This similarity in the results obtained once the effect of the various alleles had been analyzed and after weighting them according to the magnitude of their association with CAD has also been observed in other phenotypes, such as diabetes.18
We have observed that the magnitude of the association observed, determined by the regression coefficient, is similar to that observed in some CVRFs included in the risk equations. For example, in the Framingham risk equation and its adaptations,19 the difference in men between the regression coefficient at the extremes of exposure of the cholesterol variable (<160 and ≥280mg/dL) is 1.32 (which corresponds to an OR=3.74) and of the blood pressure variable (optimal and grade I-III hypertension) is 0.62 (OR=1.86). In our analysis, the difference between the regression coefficients of the extreme categories of quintiles of the number of alleles is 0.79, (OR=2.2) which is similar to the blood pressure values; considering the number of alleles and taking the group of 4 and 12 risk alleles as extremes, the difference in the regression coefficients is 1.05 (OR=2.86), which is slightly lower than the cholesterol values. It is important to consider that one of the limitations of this comparison is that we are comparing regression coefficients obtained in case-control studies that tend to slightly overestimate the magnitude of the association.
The next stage in the evaluation of these genetic biomarkers is to examine cohort studies to establish whether they can help to improve coronary risk prediction, or to reclassify individuals, in particular those in the intermediate-risk group.9 There are already some cohort studies that have included a genetic variant of the chromosome 9p21 in the risk equations but have not observed any significant improvement in the discriminating ability of the predictive models,20-22 probably because the magnitude of association of the variant analyzed was small (relative risk, RR<1.3). Other studies have included a genetic risk score based on the number of accumulated risk alleles in an individual,4,23-26 with the aim of increasing the magnitude of the association observed. Among these are 4 cohort studies,23-26 the first of which was based on candidate genes and highlighted that the inclusion of a genetic risk score can improve the predictive ability of classic risk equations.23 Two of them,24-25 which included various polymorphisms in genes involved in lipid metabolism, demonstrated that the genetic risk score was associated with the risk of presenting a cardiovascular event, and even though the predictive ability assessed by the C statistic did not improve, the reclassification of individuals in risk categories did improve slightly. One of the limitations of these studies is that by including markers in risk equations that are associated with variables or factors that are already included, no additional or complementary information is contributed, since no new biological pathways or mechanisms associated with the disease are considered. Of the 21 genetic variants associated with CAD that are included in the NHGRI Catalog of GWA Studies, we have identified 9 that are independent of CVRFs and good candidates for inclusion in a genetic risk score in coronary risk equations. The results of a third cohort study, the Nurse Health Study,26 which followed 19 313 women and had a similar focus to that of our study, have been published recently. More than 100 genetic variants were included in the first analysis, and in the second only 12 were included, the majority of which were independent of CVRFs. These were analyzed to establish whether a genetic score based on the number of risk alleles of these genetic variants would improve predictive ability or the reclassification of coronary risk. The results of this study have been negative, although the external validity of these results is debatable.
One of the limitations of our study is associated with the analysis of the in silico data from the WTCCC8 study, which gave us access to individual-level data about the participant's genotype and whether or not they presented CAD; however, we did not have access to other personal data like age or sex, which would have allowed us to adjust or stratify the results using these kinds of clinical variables. In any case, there are no data to suggest that the association between the selected genetic variants and CAD is different in men than in women.
CONCLUSIONS
The results of this study suggest that this type of genetic risk score for CAD, based on the additive and combined effect of a number of risk alleles in different genetic markers that are independent of CVRFs, is associated with an increased risk of CAD and is consistent with the first stage of the evaluation of a new biomarker proposed by the American Heart Association. It is now necessary to continue with the next stages of the evaluation of this type of biomarker by carrying out population-based cohort studies in order to establish whether there is any improvement in the discriminating ability of the equations used in the primary prevention of CAD, or the reclassification of individuals, especially those belonging to the intermediate-risk group. It is also important to define the relevance of this type of biomarker in clinical practice.
ACKNOWLEDGMENTS
This study included data generated by the Wellcome Trust Case-Control Consortium.8 A complete list of researchers who took part in generating the data can be found at www.wtccc.org.uk.
ABBREVIATIONS
CAD: coronary artery disease
CI: confidence interval
CVRF: classical cardiovascular risk factor
GWA: genome-wide association
OR: odds ratio
SD: standard deviation
WTCCC: Wellcome Trust Case Control Consortium
SEE ARTICLE ON PAGES 890-2
The funds for this project were provided by the Wellcome Trust, under grant number 076113. Furthermore, this analysis was financed by ACC1Ó/FEDER (CIDEM RD08-1-0024), the Spanish Ministry of Science and Innovation, Carlos III Health Institute/FEDER (HERACLES network RD06/0009) and the Health Research Fund (FIS PI061254); G.L. received financial assistance from the Programme Juan de la Cierva (JCI-2009_04684); M.T. received financial assistance from the Commission for Universities and Research from the Department of Innovation, Universities and Business of the Catalonian Government (2007BP-B100068); the Agency for Management of University and Research Grants of the Catalonian Government (2009 SGR 1195).
Conflict of interests: The authors of the Group of Epidemiology and Cardiovascular Genetics declare that they are collaborating with the company Gendiag.exe in the development and validation of a genetic test to improve the predictive capacity of the functions of cardiovascular risk. This collaboration was formalized initially by a contract of institutional collaboration between the Foundation IMIM and Gendiag.exe, and currently recives support from ACC1Ó/FEDER of the autonomous government of Catalonia, a project in which the company Ferrer inCode also participates.
Correspondence: Dr. R. Elosua.
Grupo de Epidemiología y Genética Cardiovascular (EGEC-ULEC). Institut Municipal d'Investigació Mèdica (IMIM-Hospital del Mar).
Dr. Aiguader, 88. 08003 Barcelona. España.
E-mail: relosua@imim.es
Received February 4, 2010.
Accepted for publication April 19, 2010.