Ventricular arrhythmias are important contributors to morbidity and mortality in patients with coronary artery disease. Ventricular fibrillation accounts for the majority of deaths occurring in the acute phase of ischemia, whereas sustained, monomorphic ventricular tachycardia due to reentry generated in the scar tissue develops most often in the setting of healed myocardial infarction, especially in patients with lower left ventricular ejection fraction. Despite determinant advances in population education and myocardial infarction management, the ventricular tachycardia risk in the overall population with coronary artery disease continues to be a major problem in clinical practice. The initial evaluation of a patient presenting with ventricular tachycardia requires a 12-lead electrocardiogram, which can be helpful to confirm the diagnosis, suggest the presence of potential underlying heart disease, and identify the location of the ventricular tachycardia circuit. An invasive electrophysiologic study is usually crucial to determine the mechanism of the arrhythmia once induced and to provide guidance for ablation. The approach for ventricular tachycardia ablation depends on several factors, including inducibility, sustainability, and clinical tolerance of ventricular tachycardia. The paper also reviews other therapeutic options for patients with ventricular tachycardia associated with coronary artery disease, including antiarrhythmic drug therapy, surgical ablation, and current implantable cardioverter-defibrillator indications.
Keywords
.
IntroductionVentricular arrhythmias are among the most feared complications of coronary artery disease (CAD). Ventricular fibrillation (VF) accounts for the majority of deaths occurring in the acute phase of an ischemic event,1 and can be the first manifestation of the disease in more than half of all cases. The incidence of VF complicating an acute myocardial infarction (MI) has been reported to be around 4.7%, and has remained relatively stable over time in long-term observational studies.2 It is estimated that 90% of patients with out-of-hospital VF do not reach the hospital alive.3 Therefore, despite continuous efforts in primary prevention and population education, a great majority of patients with VF do not ever benefit from medical care. Sustained, monomorphic ventricular tachycardia (VT) occurs most frequently in the setting of healed MI, and may appear in the subacute phase or long after the acute ischemic injury.4 The extent of myocardial necrosis and the degree of left ventricular (LV) dysfunction are important determinants of arrhythmia risk following MI. Sustained, monomorphic VT usually develops in patients with more extensive MI who also have lower LV ejection fraction (LVEF).4 The overall incidence of sustained VT following MI was classically established at about 3% to 5%, but has been estimated to decline to 1% in recent years due to major advances in MI management, resulting in smaller infarct scars.4 The VT risk in the overall population, however, has been fairly stable and could in fact be increasing, on account of an improved post-MI survival and the possibility of VT occurrence years after the initial MI, along with a progressively aging population. This paper reviews our current knowledge on the VT associated with CAD, and especially focuses on mechanisms, electrocardiographic and electrophysiological (EP) features, and therapy options. Because recurrent monomorphic VT is a particularly challenging scenario that cardiologists and electrophysiologists are facing progressively more often in clinical practice, special emphasis will be directed to this particular setting.
Mechanisms of ventricular tachycardia associated with coronary artery diseaseThe mechanisms underlying VT initiation and maintenance have been extensively studied for several decades. The bases of our current understanding on CAD-related arrhythmia mechanisms come from parallel research in the animal and EP laboratories initiated more than 20 years ago. CAD embraces a broad spectrum of clinical scenarios where all arrhythmia mechanisms (enhanced automaticity, triggered activity, and reentry) can converge. Whereas the VT associated with MI scarring constitutes the clinical paradigm of reentry,4 focal activation by abnormal automaticity is the main mechanism involved in the VT arising from the ischemic border zone during acute ischemia.5 Focal discharge by calcium overload and triggered activity in the form of delayed or early after-depolarizations is also likely a mechanism of VT initiation during ischemia, but this has not been proven experimentally thus far.6
Acute ischemia activates the adenosine triphosphate-sensitive potassium (KATP) channels, causing an increase in extracellular potassium along with acidosis and hypoxia in the cardiac muscle. Minor increases in extracellular potassium depolarize the myocardiocyte's resting membrane potential, which can increase tissue excitability in early phases of ischemia.5 Further hyperkalemia causes greater resting depolarization, decreased conduction velocity and tissue excitability, and shortening of the action potential duration but not of the effective refractory period, which is prolonged due to postrepolarization refractoriness.5 These changes provide a substrate for an injury current to flow between the ischemic and the nonischemic cells located at the border zone, which might promote focal activity by abnormal automaticity in the normal tissue and initiate VT,7 commonly emerging from the subendocardial Purkinje network.8 A mechanism of microreentry from transmural voltage gradients generated during acute ischemia has also been described.9 In this context, polymorphic VT and VF develop when a single reentrant wave front splits into multiple wavelets, which is more likely to happen in the surrounding nonischemic tissue due to its shorter effective refractory period.10 If coronary perfusion is reestablished, rapid, heterogeneous improvement in tissue excitability might produce focal activation responsible for the occurrence of reperfusion VTs.11
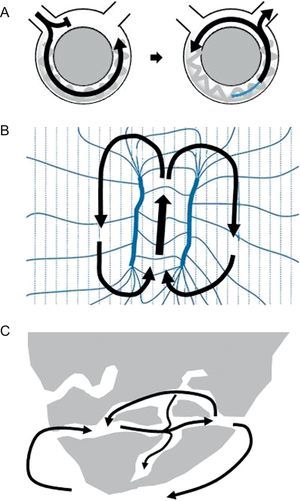
Reentry is the mechanism underlying the VT associated with healed or healing MI in more than 95% of cases.4 Reentry is a self-perpetuating mechanism by which a wave front propagates repetitively throughout a closed rotational circuit long enough to allow the cardiac tissue to be excitable by the time the wave front reaches it (Figure 1A). Two conditions are essential for reentry to occur: a) unidirectional block of conduction (ie, successful conduction in only one direction), and b) a circuit cycle longer than any of the refractory periods throughout the circuit. The circuit length necessary for reentry depends directly on the tissue refractory period, but also on the conduction velocity of the wave front. The unidirectional block of conduction can be anatomical, caused by discontinuities in ventricular muscle,12 branching strands of slow conduction,13, 14 or tissue discontinuation due to gap junction abnormalities15 present in the areas of MI scar. It can also be functional, due to dispersion of refractoriness, a phenomenon that has been described for both the VT associated with healed MI and for the VT complicating acute ischemia.5 Although early studies with canine models supported the concept of a functional “figure 8” reentry circuit (Figure 1B), where according to the original description the main component of block would be an encroachment on refractoriness caused by brief cycle lengths during tachycardia that would dissipate in sinus rhythm (SR), it is now accepted that reentry in the presence of MI mainly originates from surviving bundles of myocardium within the scar, separated by connective tissue, fibrosis and disordered intercellular coupling16 (Figure 1C). Evidence for this hypothesis is found by the fact that fixed areas of slow conduction can be mapped during SR in patients with VT,4 and ablation at these sites can effectively eliminate VT.4 The substrate for VT develops gradually during the first 2 weeks following MI and once established, remains indefinitely. In this setting, spontaneous VT occurs in the presence of appropriate triggers such as surges in autonomic tone, electrolyte imbalance, acute ischemia, or acute heart failure decompensation.4

Figure 1. Examples of reentry circuits. A: Diagram representing a single circuit of reentry that initiates with unidirectional block. The circuit length must be longer than the longest refractory period in the circuit. B: A figure 8, where according to the original idea reentry is established due to dispersion of refractoriness during tachycardia (modified from Lazzara et al. 16 with permission). C: Anatomical labyrinth circuit, created by strands of viable myocardium within the scar, with potential for multiple reentry circuits.
Clinical presentation and non-invasive diagnostic evaluationClinical presentation of patients with CAD who have ventricular arrhythmias is variable. Patients with ventricular arrhythmias complicating acute ischemia might experience palpitations in addition to chest pain if the arrhythmia is stable and clinically tolerated, but more often present with syncope and sudden cardiac death as a result of hemodynamically unstable VT or VF. In the case of ventricular arrhythmias related to an old MI, patients might be asymptomatic when the arrhythmia is slow and stable, but palpitations, dyspnea, or chest discomfort are common symptoms. The clinical tolerance to VT is related to the rate of tachycardia, the presence of retrograde conduction, the baseline ventricular function, and the integrity of peripheral compensatory mechanisms. Incessant VT, even if hemodynamically stable, can lead to hemodynamic deterioration and heart failure.17
Besides a clinical history and a physical exam, the general evaluation of a patient with CAD and suspected or documented ventricular arrhythmias includes performing a 12-lead electrocardiogram (ECG) (see below) and an echocardiogram. Holter monitoring can be useful in certain cases of suspected VT. Other noninvasive tests, such as T-wave alternans, signal-averaged ECG, and heart rate variability, do not provide diagnostic confirmation, but might be helpful in defining arrhythmia risk in patients with CAD.17
Electrocardiographic Findings During Ventricular tachycardiaAs discussed earlier, ventricular arrhythmias in the acute phase of ischemia are usually polymorphic and degenerate rapidly into VF, requiring prompt electrical termination. The recognition of VF is not usually difficult and will not be discussed here. More challenging is the diagnosis of a monomorphic VT, which is to be based on the surface ECG findings. A careful analysis of a single ECG during tachycardia can, in most cases: a) confirm the diagnosis of VT and rule out other possible causes of wide-complex tachycardia (WCT), such as supraventricular tachycardia with aberrant conduction, preexisting bundle branch block, or preexcited tachycardia; b) suggest the presence or not of underlying heart disease, and c) identify the VT origin or the exit of the circuit from where it arises, which is essential when planning an EP study (EPS) for mapping and ablation.
Distinguishing Ventricular Tachycardia From Supraventricular TachycardiaThe ECG diagnosis of a WCT is challenging for the practicing physician, not only for the difficulty in recognizing certain ECG criteria, but also for the circumstances in which WCT presents (often requiring a fast diagnosis), and the consequences of a wrong conclusion, which could be potentially harmful for the patient. When facing a WCT, it is important to remember that VT is the cause in 80% of cases.18 The anamnesis can further support this etiology if there is a history of heart disease such as prior MI, angina, or congestive heart failure.18 A number of classical and recent works have described specific ECG criteria that have been proven to be helpful when present, but their lower sensitivity in most cases has limited their clinical utility.19, 20, 21 Table 1 summarizes the main ECG criteria that have been suggested to distinguish VT from supraventricular tachycardia.
Table 1. Electrocardiographic Criteria of Ventricular Tachycardia in the Differential Diagnosis of Wide-complex Tachycardia
| 1. Atrioventricular relationship | AV dissociation. Includes fusion and capture beats | |
| VA ratio>1 | ||
| 2. QRS duration | RBBB-like morphology with QRS>140 ms | |
| LBBB-like morphology with QRS>160 ms | ||
| QRS narrower than in SR | ||
| 3. QRS axis | Right superior axis (negative concordance in I, II, III) | |
| 4. Specific QRS patterns | In precordial leads:• Negative or positive concordance• Absence of RS in all precordial leads• In the presence of RS complex, an interval from R onset to S nadir >100 ms | |
| Specifically in aVR:• Initial R wave.• Wide (>40 ms) or notched initial forces• vi/vt <1 | ||
| Specifically in V1:• With RBBB-like morphology:– Monophasic R wave– qR or Rs with broad R (>30 ms) | • With LBBB-like morphology:– Broad r wave or deep S wave– QS with slow initial forces (onset to nadir >60 ms) | |
| Specifically in V6:• With RBBB-like morphology:– Monophasic R wave– Deep S wave (QS or rS)– R/S<1 | • With LBBB-like morphology:– Q waves (QR, QS, QrS) | |
AV, atrioventricular; LBBB, left bundle branch block; RBBB, right bundle branch block; SR, sinus rhythm; VA, ventriculo-atrial.
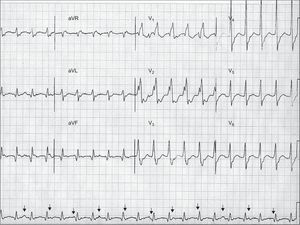
The analysis of the atrioventricular relationship, ie, the relationship between the P waves and the QRS complexes, can provide definite information. The presence of atrioventricular dissociation is a very specific criterion for VT. Atrioventricular dissociation indicates independent atrial and ventricular activity, and is highly indicative of VT (Figure 2). However, it is only seen in 20% to 50% of VTs. The presence of concomitant atrial fibrillation is another limitation of this criterion. The existence of capture or fusion beats, resulting from complete or partial activation of the ventricles from the atria within the tachycardia, implies the presence of atrioventricular dissociation and is therefore diagnostic of VT. The requirements for capture and fusion beats to occur include a slow rate of VT, appropriately timed sinus impulses, lack of retrograde ventriculo-atrial concealed conduction, and excellent antegrade atrioventricular conduction.

Figure 2. An example of wide-complex tachycardia at 130 bpm showing atrioventricular dissociation (arrows pointing to P waves), right bundle branch block-like configuration with QRS complex>140ms (200 ms), presence of RS complexes in precordial leads with R wave onset – S wave nadir>100ms (160 ms), and vi/vt<1 in aVR, all these criteria supporting the diagnosis of ventricular tachycardia. Although not characteristically meeting ventricular tachycardia criteria, the broad R wave in V1 and the deep S wave in V6 also point to ventricular tachycardia. The R/S ratio in V6 is >1, which can be observed in up to 50% of ventricular tachycardias with inferior axis. Further analysis shows Q waves in inferior leads, and wide and notched QRS complexes with slow initial forces, suggesting scar-related ventricular tachycardia, probably in the setting of old myocardial infarction.
Up to 30% of VTs conduct retrogradely to the atria and have a 1:1 ventriculo-atrial relationship, which could be misleading for supraventricular tachycardia. However, different degrees of ventriculo-atrial block can also be encountered, resulting in more QRS complexes than P waves and a ventriculo-atrial ratio>1, another feature 100% specific for VT. In VTs with 1:1 ventriculo-atrial conduction, carotid sinus massage can be useful to make the diagnosis if ventriculo-atrial block is established without affecting the tachycardia.
In the absence of the influence of antiarrhythmic agents, very broad QRS complexes usually indicate VT,19 due to slow activation initiated in the ventricles. The widest QRS complexes are seen in VTs arising from the LV lateral wall, whereas relatively narrower QRS are present in VTs from the interventricular septum or those that rapidly engage the His-Purkinje system. Overall, it has been described that QRS wider than 140ms in a right bundle branch block-like WCT (positive in V1) or wider than 160ms in a left bundle branch block-like WCT (negative in V1) are likely suggestive of VT. It is important to note that all leads should be analyzed in the search for the longest QRS measured, since some VTs may have apparently narrow QRS complexes in some leads and wide QRS complexes in others (Figure 2). Some cases of VT, however, can exhibit relatively narrow QRS complexes such as in VTs arising from the His-Purkinje system. On the other hand, the presence of a QRS that is narrower in tachycardia than in SR indicates abnormal activation sequence during tachycardia and, thus, points to VT.
The remaining ECG criteria concern the QRS axis and morphology. As a general rule, supraventricular tachycardia with aberrant conduction should always display QRS complexes that are compatible with some form of bundle branch block or fascicular block. Otherwise, the diagnosis by default would be VT except for cases of preexcited tachycardia, which are uncommon. In this sense, a QRS with right superior axis, not achievable with any combination of bundle branch block or fascicular block, is highly indicative of VT. Although less specific, a leftward superior axis, in the absence of left anterior fascicular block, is also suggestive of VT.
The main specific morphologic features that could be useful for distinguishing VT from supraventricular tachycardia are listed in Table 1. Although only present in 20% of VTs, the presence of a negative or positive concordant R wave progression pattern (ie, all precordial leads predominantly negative or predominantly positive, respectively) has a >90% specificity for VT.18 The absence of RS in all precordial leads, in most cases showing positive or negative concordance, was found by Brugada et al. to be 100% associated with VT.20 Our own review of 100 cases (personal observations) showed no significant advantage of this feature over the V1-V2 morphology criteria (see below), but the Brugada “precordial RS absent” has significant practical utility when analyzing an ECG. The same authors described that, in the presence of an RS complex in a precordial lead, an interval from the R wave onset to the S wave nadir greater than 100ms was highly specific for VT20 (Figure 2). A recent work by Vereckei et al. proposed a new algorithm for the differential diagnosis of WCT using only the aVR lead.21 According to the authors, the presence of an initial R wave, an initial r or q wave wider than 40ms, and notching on the initial downstroke in aVR were all criteria for VT. If these conditions were absent, a ventricular activation-velocity ratio (vi/vt <1 was diagnostic of VT21 (v1 is the voltage excursion in the initial 40ms of the QRS complex, whereas vt is the voltage excursion in the last 40ms). A ratio<1 would indicate slow initial activation, which is consistent with VT (Figure 2). The last ECG criteria apply to leads V1 and V6 and are distinct for right bundle branch block and left bundle branch block WCT. A right bundle branch block-like WCT is likely VT if it does not display features of typical right bundle branch block such as triphasic V1 (rSR’, rsr’, rR’) or small terminal S waves in V6. Characteristic features of right bundle branch block VT are monophasic or broad R waves in V1 and deep S waves with an R/S ratio<1. However, the R/S ratio criterion is met in 80% of VTs with superior axis, but only in 50% of the VTs with inferior axis.4 Left bundle branch block-like WCTs are likely VT if the initial forces in V1 are broad and slow (indicating slow conduction from the ventricle) and there are Q waves in V6.
Analyzing the Potential Existence of Underlying Heart DiseaseThe existence of an underlying structural heart disease is confirmed in most cases by the clinical history. However, when no information is available, the ECG might be helpful to identify certain markers of cardiac disease or MI. In the setting of an old MI, the ECG during VT is affected by the size of infarction, the region of infarction, the region within the scar where the circuit is located, the proximity to the His-Purkinje system, and the influence of concomitant pharmacological agents. In spite of these constraints, certain ECG features identifiable during tachycardia could suggest the presence of scar and, thus, would favor VT arising from an old MI. These are listed in Table 2.
Table 2. Electrocardiographic Features Suggesting Ventricular Tachycardia Related to Old Myocardial Infarction
| Presence of Q waves (qR, QR or Qr) in related leads |
| Notched or wide QRS complexes |
| Low QRS voltage |
| Multiple ventricular tachycardia morphologies |
| Paroxysmal sustained episodes |
The presence of Q waves during tachycardia points to old MI. Generally, patients with post-MI VT maintain the same Q waves that are present in SR, but prior tracings in SR are not always available. It is important to understand that a QS morphology does not necessarily imply structural damage, but rather an electrical impulse moving away from the recording site. Conversely, Q waves translate a pathological substrate when they appear with a subsequent R wave (qR, QR or Qr) and in two or more related leads (Figure 2).4 Other ECG features refer to the QRS width and initial forces. As a general concept, in MI-related VTs, which typically arise from viable myocardiocytes within the scar tissue, the electrical activation is initiated in diseased tissue with slow conduction. In the surface ECG, this is manifested by slow initial QRS forces, with characteristic notched and wider QRS complexes. Conversely, VTs occurring in the absence of structural heart disease usually display relatively smoother and narrower QRS complexes. A large scar and thus less viable myocardial tissue might generate low voltage QRS complexes in VTs related to old MI, whereas high voltage QRS complexes are often seen in VTs with underlying normal heart. Finally, the presence of multiple morphologies of monomorphic VT appearing in paroxysmal but sustained episodes points to scar-related VT, whereas a single morphology causing isolated PVCs, bigeminy, couplets, or bursts supports VT in a healthy heart.
Identifying the Ventricular Tachycardia OriginThe ECG during VT provides essential information about the origin of the arrhythmia, and thus is the most helpful tool to guide mapping and ablation in a subsequent invasive EP study. It is important to note, however, that in the MI-related VT the surface ECG tends to locate the reentry circuit exit (see below) rather than the VT origin.
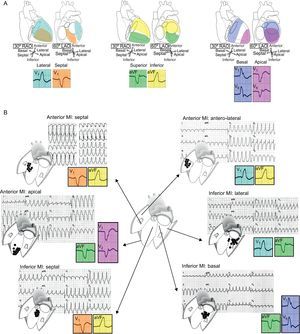
Location should be defined in 3 axes (Figure 3): a) septal vs lateral walls; b) superior vs inferior walls, and c) apical vs basal regions. The bundle branch block pattern is related to the sequence of ventricular activation. VTs arising from the lateral wall show a right bundle branch block-like pattern (positive V1), whereas most septal VTs have typically a left bundle branch block-like configuration (negative V1). Lateral VTs have wider QRS complexes due to sequential activation of both ventricles. Septal VTs, on the contrary, have narrower QRS complexes due to early engagement of the His Purkinje system and parallel activation of both ventricles. The QRS axis in inferior leads indicates the sequence of activation between the superior and inferior walls. Inferior MIs leave an inferior scar that is the origin of a VT with superior axis in 80% of cases. The VTs developing in anterior MIs, on the other hand, can either have a superior axis (55% of cases) or an inferior axis (45% of cases).4 Finally, the predominant polarity of QRS complexes in precordial leads can help discriminate between VTs from the basal or the apical regions. In VTs initiated in the apex, ventricular activation moves away from all precordial leads, which in the ECG is represented by a negative concordant R-wave progression pattern. The opposite happens in VTs arising from basal regions, which are characterized electrocardiographically by a positive concordance in precordial leads.

Figure 3. Electrocardiographic location of ventricular tachycardia origin. A: Location should be assessed based on 3 axes: septal/lateral, superior/inferior, and basal/apical. B: Examples of ventricular tachycardias from different locations arising from scars of anterior and inferior myocardial infarctions. Although complete electrocardiographic assessment requires analysis of all 3 axes, only some representative leads essential for the diagnosis in each case are shown in the colored squares. MI, myocardial infarction; LAO, left anterior oblique; RAO, right anterior oblique.
Several ECG features have been reported to predict an epicardial origin for VTs from the left ventricle.22, 23, 24 Some of these criteria, like the time to earliest rapid deflection in precordial leads (pseudodelta wave)≥34ms, the interval to peak of R wave (intrisecoid deflection time) in lead V2≥85ms, the shortest RS duration≥121ms, and the maximum deflection index≥0.55, are direct or indirect indicators of a slower initial activation of the ventricles when the origin is epicardial.22 Other morphological features are the presence of a Q wave in lead I with no Q waves in inferior leads in VTs arising from superior wall or the presence of Q waves in inferior leads in inferior VTs.23 However, these studies have mostly been performed in nonischemic populations. A recent study establishes that these QRS characteristics fail to reliably identify epicardial VTs in ischemic heart disease,25 where, as previously discussed, slow initial forces and Q waves can be present during tachycardia at the MI scar region.
One specific type of VT with characteristic QRS morphology is the VT due to bundle branch reentry. This occurs in patients with severe cardiac dysfunction and some kind of conduction delay or bundle branch block at baseline. In the setting of CAD, bundle branch reentry VT might occur in patients with large anterior MI and right bundle branch block with left anterior fascicular block or left posterior fascicular block. VT is established by reentry between the bundle branches or the fascicles, and characteristically displays a QRS that is identical to the QRS in SR.
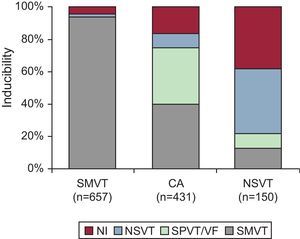
Role of the Electrophysiologic StudyCurrently, EP testing is recommended in the setting of CAD for diagnostic evaluation of patients with remote MI who have symptoms suggestive of ventricular arrhythmias such as palpitations, presyncope, or syncope (class I, level of evidence B); to guide VT ablation once VT has been identified, and assess its efficacy (class I, level of evidence B); and for the diagnostic evaluation of WCT of unclear mechanism (class I, level of evidence C).17 EP testing is also reasonable for risk stratification in patients with remote MI, nonsustained VT, and LVEF≤40% (class IIa, level of evidence B).17 For any of the indications listed above, the first goal of the EPS is to attempt arrhythmia inducibility by programmed electrical stimulation. The type of induced arrhythmia varies according to clinical presentation (Figure 4). Importantly, patients who have had sustained monomorphic VT have a 93% likelihood of inducibility for the same type of tachycardia.4

Figure 4. Inducibility of arrhythmias during electrophysiologic study in relation to clinical presentation. CA, cardiac arrest; NI, noninducible; NSVT, nonsustained ventricular tachycardia; SMVT, sustained monomorphic ventricular tachycardia; SPVT, sustained polymorphic ventricular tachycardia; VF, ventricular fibrillation. Modified from Josephson 4 with permission.
If a VT has been induced, the EPS is crucial for determining the mechanism of the arrhythmia, and will provide essential guidance for ablation. Since the description of the first EPSs more than 30 years ago,26 a series of EP maneuvers have been described to elegantly prove different arrhythmia mechanisms. From these classical works, and supported by the results of experimental models performed in parallel, we know that post-MI VT arises from surviving myocardiocytes within the area of infarction and that reentry is the mechanism in>95% of cases. In agreement with this, intracardiac recordings at the site of VT origin during SR consistently show low-amplitude, multicomponent potentials, representing the activity of surviving myocytes and the abnormally slow, fractionated conduction at this area (Figure 5).4 On the other hand, confirmation of reentry as the responsible mechanism is supplied by the following EP findings (Table 3)4, 27, 28, 29, 30:
1. Ability to reproducibly initiate and terminate the arrhythmia with programmed ventricular stimulation. Reentry requires unidirectional block to occur, which can be achieved when a timed extra-stimulus finds an area of refractory tissue and conduction is established along the surrounding tissue. The VT is then generated by self-perpetuation of the wave front, which reaches the initial area once is no longer refractory and travels indefinitely around the circuit (Figure 6A). In this circumstance, an appropriately timed extra-stimulus could potentially terminate the tachycardia by colliding antegradely with refractory tissue and retrogradely with the activation wave front (Figure 6B). Response to extra-stimulation is specific for reentry. Arrhythmias caused by normal or abnormal automaticity cannot be initiated nor terminated with programmed stimulation, and triggered rhythms caused by delayed afterdepolarizations are usually induced with overdrive pacing and/or catecholamine infusion, and terminated with vagal maneuvers.

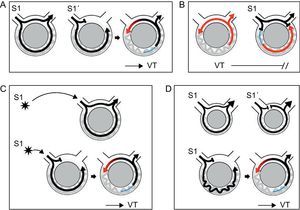
Figure 6. Diagrams depicting different phenomena associated with reentry. Black arrows indicate sinus or stimulated beats. Ventricular tachycardia beats are represented in red. Refractory period is shown in blue. A: Initiation and termination of ventricular tachycardia in response to extra-stimulation: a single extra-stimulus (S1) enters and exits the circuit conducting bidirectionally. A more premature extra-stimulus (S1’) is blocked in the area of fast conduction, which is still refractory, whereas it conducts antegradely along the slow pathway of the circuit. By the time activation reaches retrogradely the area of fast conduction, this is no longer refractory and reentry is established, initiating ventricular tachycardia. B: During ventricular tachycardia, a timed extra-stimulus finds the recently depolarized tissue refractory (indicated in blue). It collides with the retrograde wave front, stopping the reentry circuit and terminating the tachycardia. C: Initiation of ventricular tachycardia is site-specific. In the example, a single extra-stimulus with a given interval initiates ventricular tachycardia only when it is at a distance such that unidirectional block is established when the impulse reaches the circuit. D: Requirement of a critical conduction delay for induction of ventricular tachycardia. In the first example, activation travels fast bidirectionally in a circuit where there is little delay, represented by a small circuit. Even the presence of unidirectional block created by an extra-stimulus might not be enough to create reentry, because the wave front that comes retrogradely finds the tissue still refractory. In the second example, a significant conduction delay facilitates recovery of the retrograde pathway and reentry. VT, ventricular tachycardia.
2. Site-specificity for inducibility and termination. This criterion responds to the same principle than the previous one. Site-specificity only reflects the need for the extra-stimulus to enter the circuit and be blocked unidirectionally. This can be achieved by delivering an extra-stimulus at an appropriate time, or by delivering it from a distance such that, by the time the impulse enters the circuit, unidirectional block is established (Figure 6C). Stimulation site does not modify inducibility in arrhythmias generated by other mechanisms.
3. Inverse relationship of coupling interval or pacing cycle length to the cycle length of the first tachycardia beat. The shorter the S1-S2 or the pacing cycle length, the longer the time to the first tachycardia beat. This is caused because at shorter cycle length or faster pacing rates, slow conduction, a major prerequisite for reentry, becomes more pronounced (Figure 7A). In fact, the demonstration that inducibility and maintenance of VT require a critical degree of slow conduction proves reentry (Figs. Figure 6 and Figure 7). Conversely, in triggered rhythms, coupling interval or pacing cycle length, if anything, relate directly with the cycle length of the first beat of tachycardia, which typically can be accelerated by pacing.

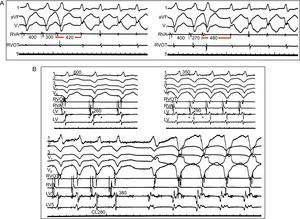
Figure 7. Demonstration of conduction delay in reentrant ventricular tachycardia. A) Inverse relationship of the premature stimuli coupling interval to the interval of the first tachycardia beat. Leads I, VF, and V1 are represented, together with intracardiac recordings from the right ventricular apex and outflow tract. Ventricular extra-stimuli (300 → 270 ms) are delivered from the right ventricular apex at a basic cycle length of 400ms. Conduction delay is more pronounced (420→480 ms) with shorter coupling intervals. B) Requirement of a critical conduction delay for induction of reentrant ventricular tachycardia. Leads I, II, II, V1 and V6 are shown along with intracardiac recordings from the right ventricular apex, right ventricular apex and outflow tract, and 2 different sites in the left ventricle. With faster pacing rates (600→350→280 ms), conduction in the left ventricle is progressively slowed, manifested by longer fractionated potentials in the left ventricular channel (260→290→380 ms) until it reaches a critical delay that can initiate ventricular tachycardia. CL, cycle length; LV, left ventricle; RVA, right ventricular apex; RVOT, right ventricular outflow tract. Modified from Josephson 4 with permission.
4. Resetting during stable tachycardia in response to programmed stimulation.27, 28 In EPS, resetting is the interaction of a premature wave front with a tachycardia resulting in either advancement or delay of the subsequent tachycardia beat. In the specific case of reentry, the premature wave front (usually an extra-stimulus) enters the tachycardia circuit to collide retrogradely with the preceding tachycardia wave front and to conduct antegradely through excitable tissue in the circuit to produce an early complex and a less than a compensatory pause (Figure 7). The return cycle (RC), defined as the interval from the extra-stimulus to the onset of the next beat, corresponds to the time required for the stimulated impulse to reach the circuit, conduct throughout the circuit, and return to the stimulation site. According to the relationship between the coupling interval and the RC, 3 types of resetting responses have been described:
• A flat response is observed when the RC remains stable at decreasing coupling intervals, as long as the stimulation site is the same. A flat response indicates that there is a full excitable gap along the entire circuit (no refractory tissue is encountered at any coupling interval).
• An increasing response is observed when the RC progressively increases as the coupling interval shortens. It indicates that the stimulus encounters refractory tissue in all or part of the reentrant circuit, and this is more pronounced with shorter coupling interval.
• A mixed response is defined by the combination of the two former patterns (an initial flat response that increases with shorter coupling interval).
Resetting does not by itself prove reentry. Automatic arrhythmias might exhibit resetting with a flat response, and triggered rhythms might present a flat or a decreasing resetting response. Increasing or mixed responses are specific for reentry, indicating engagement of a partially refractory tissue. Resetting with fusion (usually seen on the ECG, Figure 8) is virtually diagnostic of reentry, and implies that the entrance in the circuit by the stimulus and the tachycardia exit are separated.27, 28 Resetting with manifest fusion on the ECG occurs in approximately 50% of reentrant VTs due to CAD.4

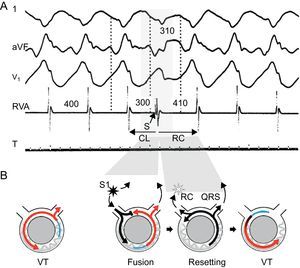
Figure 8. Resetting with fusion is diagnostic of reentrant ventricular tachycardia. Surface electrocardiogram leads I, aVF, and V1 and intracardiac recording from the right ventricular apex are presented (A), together with representative diagrams of the mechanism (B). Tachycardia beats are shown in red, stimulated beats in black, refractory period in blue. Tachycardia cycle length is 400ms. An extra-stimulus is delivered at 300ms from a site that is far away from the exit of the circuit, resulting in a fusion beat, a composite morphology between the paced and the ventricular tachycardia beats. The extra-stimulus penetrates and interacts with the tachycardia, generating the next tachycardia beat. The return cycle of 410ms represents the time required for the stimulated impulse to reach the circuit, conduct throughout the circuit, and return to the stimulation site. CL, cycle length; RC, return cycle; RVA, right ventricular apex; VT, ventricular tachycardia. Panel A is reproduced from Almendral et al. 27 with permission.
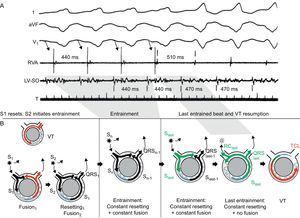
5. Entrainment during stable tachycardia in response to programmed stimulation.29 Entrainment is the response to overdrive pacing, ie, a continuous resetting by a train of stimuli (Figure 9), and provides convincing evidence of a reentrant mechanism. Unlike resetting, entrainment examines a circuit that has been previously reset (by the first extra-stimulus of the train). Entrainment is present when pacing delivered at a rate faster than the VT accelerates all QRS complexes of the VT with the same fusion pattern and termination of pacing results in resumption of the same VT. The classical criteria for recognition of entrainment are the following29:
• Fixed QRS fusion at a given cycle length and site. Except for the first and last stimulation beats, a fixed QRS fusion is observed in the remaining stimulated beats. Once the first stimulus in a train resets the VT, subsequent stimuli reset the reset circuit, producing a fixed pattern of antegrade conduction and retrograde collision with the previous stimulated wave front. This produces a constant QRS fusion at a given pacing cycle length.
• Progressive fusion (increasingly favoring the pacing morphology) with faster pacing cycle lengths.
• Resumption of VT with a captured but not fused beat when pacing stops.

Figure 9. Entrainment of ventricular tachycardia. Surface electrocardiogram leads I, aVF, and V1 and intracardiac recordings from the right ventricular apex and the left ventricular site of origin are presented, together with schematic diagrams representing the mechanism (tachycardia beats presented in red, stimulated beats in black, last paced stimulus in green, refractory period in blue). Tachycardia cycle length is 470ms. During overdrive pacing from the right ventricular apex at 440ms, the tachycardia is transiently accelerated to the pacing rate, and the QRS morphology represents a fusion between paced and ventricular tachycardia beats. When pacing stops, the ventricular tachycardia resumes with an entrained but not fused return beat (represented in green in the diagrams). The return cycle of this last beat (510 ms) provides information about the distance from the stimulation site to the circuit. LV, left ventricular; RC, return cycle; RVA, right ventricular apex; SO, site of origin; TCL, tachycardia cycle length; VT, ventricular tachycardia. A is reproduced from Almendral et al. 29 with permission.


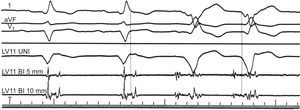
Figure 5. Intracardiac electrogram abnormalities recorded in sinus rhythm and ventricular tachycardia. Leads I, aVF, and V1 of the surface electrocardiogram are shown with 3 intracardiac recordings from a catheter placed in the left ventricular anterior wall. During sinus rhythm (first 2 complexes), a fractionated, multicomponent signal is recorded in the intracardiac electrograms after the end of the QRS complex in the electrocardiogram, indicating delayed endocardial activation. During ventricular tachycardia (last 2 complexes) the electrogram at the same site precedes the QRS complex by 90ms, suggesting a relationship between abnormal, multicomponent potentials and the areas from which ventricular tachycardia originates. BI, bidirectional; LV, left ventricle; UNI, unidirectional. Reproduced from Josephson 4 with permission.
Table 3. Electrophysiologic Features That Prove a Reentrant Mechanism
| 1. Initiation of VT: |
| • Timed extra-stimulation |
| • Site-specificity |
| • Inverse relationship of coupling interval or pacing cycle length to cycle length of first tachycardia beat |
| • Requirement of a critical degree of slow conduction |
| 2. During stable VT: |
| • Resetting with fusion |
| • Resetting with increasing or mixed response |
| • Entrainment |
| 3. Termination of VT: |
| • Timed extra-stimulation |
| • Site-specificity |
VT, ventricular tachycardia.
As in resetting, QRS fusion is evident when the pacing site and the tachycardia exit site are far apart. Entrainment with concealed fusion (ie, no change in QRS morphology) refers to that entrainment performed within the circuit itself, where the stimulated beats leave the circuit through the tachycardia exit and thus exhibit the exact same QRS morphology as those during VT. Entrainment techniques are extremely helpful for mapping during VT ablation procedures (see below).
ManagementTreatment of ventricular arrhythmias associated with CAD usually requires a combined approach, where revascularization and optimal heart failure management are aimed at preventing the development of a potential substrate, antiarrhythmic agents are used for VT suppression or slowing leading to better clinical tolerance, surgical and catheter ablation intend to cure and eliminate the arrhythmia substrate, and implantable cardioverter-defibrillators (ICDs) are the rescue and also the definite treatment in most cases due to the limited efficacy of the former.
Pharmacologic ManagementVT is an important cause of sudden death and morbidity in patients with CAD. Several studies performed in the 1980s and 1990s empirically tested different pharmacological options for VT and sudden cardiac death prevention in patients with CAD, especially those with prior MI. Amiodarone showed limited results, with benefits due to reduction in arrhythmic death (35% in the EMIAT study and 48% in the CAMIAT study) but no effect on all-cause mortality at 24 months.31, 32 However, in a subgroup analysis, patients treated with beta-blockers and amiodarone showed significant reduction in both sudden cardiac death and total mortality.31, 32 A more recent study performed in patients with congestive heart failure demonstrated no favorable survival with amiodarone as compared to placebo.33 Beta-blockers alone were associated with a 19% relative reduction in total mortality compared to placebo in a metaanalysis including 138 trials and 98 000 patients with MI.34 The same study demonstrated limited efficacy with amiodarone, no efficacy with calcium-channel blockers, and increased mortality risk with class I antiarrhythmic agents.34 Sotalol showed a trend to mortality reduction in patients with prior MI, but the difference was not statistically significant.35 In fact, in patients with low LVEF and heart failure following MI, d-sotalol was associated with increased arrhythmic death.36 On the other hand, the DIAMOND trial failed to demonstrate a survival benefit (all-cause mortality, cardiac mortality, or total arrhythmic deaths) with dofetilide in patients with severe LV dysfunction and recent MI.37 Holter-guided antiarrhythmic therapy with encainide and flecainide was evaluated in the CAST trial. The trial evaluated the efficacy of these class Ic agents in patients with prior MI, and was terminated prematurely due to an excess of arrhythmic deaths and deaths due to shock after acute recurrent MI in both antiarrhythmic groups compared to placebo.38 Inducibility on the EPS was also used in several studies for antiarrhythmic drug trials and titration,39 but this approach has been mostly abandoned.
The overall limited efficacy of antiarrhythmic drugs in preventing ventricular arrhythmias post-MI, their common side effects, and their potential for arrhythmogenicity in special contexts, led to consider alternative indications. The OPTIC trial assessed the efficacy of 3 pharmacological treatments (beta-blockers alone, beta-blockers+amiodarone, or sotalol alone) in preventing ventricular arrhythmias (and thus ICD shocks) in patients with an ICD.40 Eighty per cent of the patients in the 3 treatment arms had history of prior MI. Amiodarone plus beta-blocker significantly reduced the risk of shock compared with beta-blocker alone (hazard ratio [HR]=0.27; P<.001) and sotalol (HR=0.43; P=.02). Sotalol tended to reduce shocks compared with beta-blocker alone (HR=0.61; P=.055).
On the basis of these and other trials, current guidelines recommend two options: a) either amiodarone (class IIa, level of evidence B) or sotalol (class IIa, level of evidence C), in combination with beta-blockers if possible, as an adjunctive therapy to reduce symptoms in patients with prior MI, LV dysfunction, and VT unresponsive to beta-blockers alone, and b) amiodarone or sotalol in patients with ICD, prior MI, and LV dysfunction who have frequent ICD shocks (class IIa, level of evidence C); and amiodarone in patients with prior MI, LV dysfunction and hemodynamically stable VT who are not candidates for ICD (class IIa, level of evidence C).17 Prophylactic antiarrhythmic drug therapy is not indicated to reduce mortality, but only to reduce symptoms in patients fulfilling the characteristics above mentioned.1
Implantable Cardioverter-defibrillatorsSince their introduction in clinical practice in the early 1990s, ICDs have become determinant in the global treatment of ventricular arrhythmias associated with CAD. Compared to antiarrhythmic drug therapy, ICD therapy has been associated with mortality reductions of 23% to 55% depending on the trial, with the survival benefit due mostly to a reduction in sudden cardiac death.17
The use of ICDs in patients who have already experienced life-threatening arrhythmias (ie, ICD use for secondary prevention) is unquestioned. Three randomized secondary prevention trials comparing the efficacy of ICDs and antiarrhythmic drug therapy were published between 1997 and 2000 (Table 4).41, 42, 43 All three required a history of cardiac arrest or the documentation of life-threatening arrhythmias, and mostly included patients with CAD. Although only statistically significant for the AVID trial, probably due to a larger sample size, the overall mortality reduction by ICD was similar in the 3 studies (Table 4). Subsequent subgroup analyses of all 3 trials demonstrated that the benefit was greatest among patients with low LVEF (<35%), who also were the ones at highest risk of arrhythmias.50, 51, 52
Table 4. Major Implantable Cardioverter-defibrilator Trials in Patients With Coronary Artery Disease
| Trial | No | Inclusion | CAD, % | EF, % | Control group | Follow-up, months | Mortatity control group | Mortality ICD | HR, ICD |
| AVID 41 | 1016 | CA survivors, Syncopal sust-VT, Symptomatic (nonsyncopal) sust-VT+EF<40% | 81 | 32 | Amiodarone (85%) or sotalol | 18 | 24 | 15.8 | 0.73 |
| CIDS 42 | 659 | CA survivors, documented VF; Syncopal sust-VT, Symptomatic (non-syncopal) or unstable sust-VT+EF<35%Syncope+inducible VT | 82.6 | 34 | Amiodarone | 36 | 20.97 a | 14.75 a | 0.70 a |
| CASH 43 | 288 | CA survivors with documented VF | 73.3 | 46 | Amiodarone or metoprolol (combined vs ICD) b | 57 | 45 | 36 | 0.76 |
| MADIT 44 | 196 | Prior MI with EF≤35%; asymptomatic non-sust VT; inducible, nonsuppressible VT on EPS | 100 | 26 | AAD therapy (amiodarone 74%) | 27 | 39 | 15.8 | 0.46 |
| MUSTT 45 | 704 | CAD and EF≤40%; asymptomatic, non-sust VT; inducible VT on EPS | 100 | 30 | No AAD therapy c | 39 | 28 a | 10 a | 0.55 a |
| CABG-Patch 46 | 900 | Indication for CABG; EF≤35%; abnormal signal-averaged ECG | 100 | 27 | No AAD therapy | 32 | 20.9 | 22.6 | 1.07 |
| MADIT-II 47 | 1232 | Prior MI (>1 month); EF≤30% | 100 | 23 | No AAD therapy | 20 | 19.8 | 14.2 | 0.69 |
| DINAMIT 48 | 674 | Prior MI (within 6-40 days); EF≤35%; depressed HRV or high average HR in 24-h Holter monitoring | 100 | 28 | No AAD therapy | 30 | 17 | 19 | 1.08 |
| SCD-HEFT 33 | 2521 | NYHA class II or III CHF; LVEF≤35% | 52 | 25 | Placebo vs amiodarone vs ICD in addition to HF treatment | 45 | 29 (placebo), 28 (amiodarone) | 22 | 0.77 d |
AAD, antiarrhythmic drugs; CA, cardiac arrest; CABG, Coronary Artery Bypass Graft; CAD, coronary artery disease; CHF, chronic heart failure; ECG, electrocardiogram; EF, ejection fraction; EPS, electrophysiologic study; HF, heart failure; HR, heart rate; HRV, heart rate variability; ICD, implantable cardioverter-defibrilator; LVEF, left ventricular ejection fraction; MI, myocardial infarction; NYHA: New York Heart Association; VF, ventricular fibrillation; VT, ventricular tachycardia.
Data from the original studies and Buxton. 49
a Mortality rates at 2 years.
b A third arm of antiarrhythmic therapy was propafenone, which was prematurely terminated due to excessive mortality.
c Standard heart failure treatment was compared to heart failure treatment+antiarrhythmic therapy (combined group of antiarrhythmic drugs and implantable cardioverter-defibrilator).
d Vs placebo.
Several randomized trials have also assessed the benefit of ICD implant for primary prevention of sudden cardiac death in the setting of CAD.44, 45, 46, 47, 48 Their main characteristics and outcomes are summarized in Table 4. The MADIT and MUSTT trials included patients with CAD, low LVEF, and asymptomatic nonsustained VT that was inducible on EPS. Despite some differences in patient characteristics (MADIT included 100% of patients with true MI), the event rate and survival benefit with ICD was similar in both studies (up to 50% relative mortality reduction with ICD).44, 45 The potential benefit of ICD implantation beyond these indications was first assessed by the CABG-Patch investigators, who examined the hypothesis that ICD would reduce mortality when implanted at the time of clinically indicated coronary artery bypass grafting in patients with LVEF≤35% and abnormal signal-averaged ECG.46 The study failed to demonstrate any benefit with prophylactic ICD in this population.46 The MADIT-II trial was designed to evaluate the effect of ICD in patients with reduced LVEF (≤30%) and a history of MI of at least 1 month without any further risk stratification. Although with lower relative benefit than in the MADIT and MUSTT trials, ICD was again proven to improve survival, with a 31% relative reduction in total mortality rate in the ICD group.47 The potential benefit of ICD in patients with very recent MI was assessed in the DINAMIT trial, which enrolled patients who had an LVEF≤40% following an MI within the 6-40 days prior to inclusion, and impaired cardiac autonomic function. Prophylactic ICD therapy did not reduce overall mortality in this population (18.7% in ICD group vs 17% in conventional therapy group, follow-up period of 30 [13] months), although was associated with a reduction in the rate of arrhythmic death (HR=0.42 in the ICD group) that was offset by an increase in the rate of death from nonarrhythmic causes (HR=1.75 in the ICD group).48 Finally, the SCD-HEFT trial evaluated the benefit of ICD in overall survival among patients with chronic heart failure of any origin and LVEF ≤35%. The study demonstrated a 23% decreased risk of death during a follow-up of 45 months with ICD compared to placebo. Amiodarone was not proven better than placebo. The benefit of ICD was similar for ischemic and nonischemic populations.33
On the basis of these studies, these are the current recommendations for ICD implantation in the setting of CAD17:
1. ICD therapy is indicated in patients resuscitated from VF when coronary revascularization is not possible, and there is evidence of prior MI and significant LV dysfunction (class I, level of evidence A).
2. ICD is recommended in patients with LV dysfunction due to MI who present with hemodynamically unstable VT (class I, level of evidence A).
3. Primary prevention ICD is recommended in patients with LV dysfunction due to prior MI who are at least 40 days post-MI and have an LVEF ≤30%-40% and New York Heart Association class II or III (class I, level of evidence A).
4. Primary prevention ICD is reasonable in patients with LV dysfunction due to prior MI who are at least 40 days post-MI, and have an LVEF ≤30%-35% and New York Heart Association class I (class IIa, level of evidence B).
5. ICD implantation is reasonable in patients with post-MI with normal LV function and recurrent VT (class IIa, level of evidence C).
All the prior recommendations assume that patients are receiving optimal medical therapy and have a reasonable expectation of survival (>1 year). Aggressive attempts to treat heart failure and myocardial ischemia are also class I indications for ventricular arrhythmia management in the setting of CAD.17
AblationIn patients with extensive structural abnormalities, especially those with prior MI, multiple morphologies of VT might develop. As a result, ablation of a single VT morphology does not eliminate the need for ICD or antiarrhythmic therapy. Over follow-up, VT episodes might occur in up to 40% to 60% of patients who have received an ICD for secondary prevention and in 2.5% to 12% of patients with ICD implanted for primary prevention.53 Because antiarrhythmic drug therapy has only modest efficacy (see above), catheter ablation becomes the most attractive option to reduce the frequency of VT episodes in patients with CAD, including patients with incessant VT.17 Ablation is usually indicated in cases of recurrent, monomorphic VT arising from a specific substrate that can be targeted by mapping techniques. The approach to mapping and ablation depends on the type of VT and its mechanism (Table 5). Because reentry is the main mechanism of MI-related VTs, in this section we will review the mapping and ablation techniques of this particular type of VT.
Table 5. Usefulness of Mapping Techniques According to Ventricular Tachycardia Mechanism
| Mapping technique | VT mechanism | ||
| Automatic VT | Triggered VT | Reentrant VT | |
| In SR | |||
| SR mapping of abnormal electrograms | – | – | ++ |
| Pacemapping | +++ | +++ | +/– |
| During VT | |||
| Activation mapping earliest site | +++ | +++ | ++ |
| Entrainment mapping | – | – | +++ |
SR, sinus rhythm; VT, ventricular tachycardia.
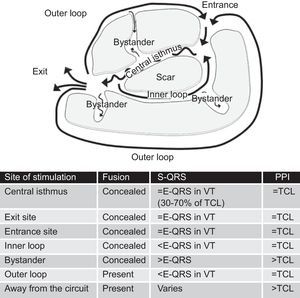
The reentry circuit is usually complex, with multiple paths defined by areas of functional block (more often due to refractoriness) or fixed anatomical block (scar tissue).54, 55 Separation of myocytes by areas of fibrosis results in slow conduction, which is determinant for reentry and VT generation. The main components of the reentry circuit according to the anatomical model are represented in Figure 10. The central isthmus is the common pathway of the circuit and the critical region for reentry. It is depolarized during diastole, and its activity cannot be seen in the surface ECG, but it can be detected by intracardiac recordings, which typically show multicomponent potentials as a reflection of slow conduction. A single central isthmus may participate in more than one clinical or inducible VT.54 The QRS onset occurs after the wave front emerges from the isthmus at an exit site and activation spreads across the ventricles. Outer loops are sheets of myocardium surrounding the scar that drive the impulse back to the circuit through an entrance site. Complex circuits also have inner loops, contained within the scar, and bystanders, sites of slow conduction within the scar that do not participate in the circuit.

Figure 10. Anatomical model of reentry circuit to explain post-myocardial infarction ventricular tachycardia. Characteristics of entrainment mapping according to the site of pacing are summarized in the table. E-QRS: electrogram to QRS interval; TCL, tachycardia cycle length; VT, ventricular tachycardia.
Although the surface ECG can provide important information about arrhythmia location (see above), intracardiac mapping is essential to define the circuit, identify critical portions, and guide ablation. The basis of all current mapping techniques is an extension of the early studies that defined the pathophysiologic substrate of VT in CAD.4, 29
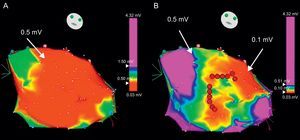
While the patient is in SR, it is sometimes useful to define the arrhythmia circuit by means of a voltage map, a 3-dimensional electroanatomic reconstruction of the ventricle performed by plotting electrogram amplitudes taken at different sites of mapping.55, 56 The areas of scar are defined by voltages lower than 1.5mV. Stricter voltage criteria, like a cut-off value of 0.5mV, helps in further defining the scar and identifying the isthmuses (Figure 11).56 The intracardiac tracings in SR at the sites of interest can show broad signals with multiple components (fractionated electrograms) or potentials immediately after the QRS complex (late potentials) in areas with abnormal conduction, which are typically associated with reentry. Pacing from the mapping catheter during SR (known as pace-mapping) can reproduce the QRS morphology of the tachycardia if the catheter is located near the exit of the reentry circuit, although this technique can be misleading in reentrant VT, in contrast to focal VT. In fact, the same QRS morphology as in VT is unlikely to be produced by stimulation from the isthmus of the circuit, which would produce simultaneous antidromic and orthodromic activation of the ventricles in contrast to VT, where activation is only orthodromic along the isthmus. Pacing can also help define the areas of electrically unexcitable scar, in which the pacing threshold is>10mA.55 Three-dimensional plots of unexcitable areas can delineate scars and isthmuses between them, and facilitate the identification of potential sites for ablation. Pacing from the sites of interest usually shows slow conduction, manifested by a delay greater than 40ms between the stimulus and the QRS onset in all 12 leads of the ECG.55 Three-dimensional electroanatomical reconstructions during SR and paced rhythm for scar characterization (known as substrate mapping) facilitate ablation in the case of multiple VTs, pleomorphic VTs, or VTs that are unmappeable because they are hemodynamically unstable or not inducible during programmed electrical stimulation.57 Even for stable VTs, substrate mapping can be helpful in limiting entrainment mapping to the region of interest.57

Figure 11. Voltage electroanatomical map to identify areas of scar. A: a huge left ventricular scar is obtained when the cut-off value is set at <0.5mV (red area). By modifying the color scale (B), different areas within the scar can be identified: very low voltage areas (<0.1 mV) corresponding to true scar and corridors between them with slightly greater voltage (in green and yellow) constituting the isthmuses that are target for ablation (red dots).
During stable and tolerated VT, evaluation of intracardiac signals and response to pacing maneuvers during tachycardia are extremely helpful for successful ablation. Electrograms in scar-related VT might show presystolic and diastolic activity in form of low-amplitude potentials. Presystolic activation is found at the circuit exit, with activity preceding the QRS onset by 50ms or more, in contrast to focal VTs, where presystolic activity is usually found at –15ms. Importantly, in reentrant VT diastolic activity is not specific for isthmus location; it can also be found at bystander sites.58 Continuous activity might be present.
More determinant for mapping and ablation is the response of the VT to entrainment. The mechanisms were described on a temporal basis by Almendral et al.4, 29 and subsequently on an anatomical model by Stevenson et al.59 The following parameters should be analyzed:
1. QRS fusion. As discussed before, QRS fusion during entrainment is caused by simultaneous activation of the ventricles from pacing and VT. Entrainment without noticeable change in QRS morphology is referred to as entrainment with concealed fusion, and indicates that pacing is being delivered from somewhere in the scar, generating an activation front that uses the same circuit exit as the VT. This could be due to pacing from the isthmus or from a bystander connected to the isthmus.
2. Stimulus to QRS interval (S-QRS) is an indicator of the conduction time from the pacing site to the circuit exit. S-QRS is shortest at the circuit exit, and becomes progressively longer from exit site to distal, central, and proximal portions of the isthmus, and finally to entrance site, because in these areas the stimulus faces a progressively longer slow conduction area before it exits the circuit. It has been established that the S-QRS interval in the isthmus is between 30% and 70% of the tachycardia cycle length.59 The S-QRS interval equals the electrogram-QRS (E-QRS) interval during VT if pacing is delivered from somewhere in the circuit and produces only orthodromic activation, because in this case the pacing stimulus follows the exact same path as the VT. When pacing from inner and outer loops, the stimulus might travel bidirectionally (ortho- and antidromically) and produce a S-QRS that is shorter than the E-QRS during VT, where there is only orthodromic conduction. Pacing from bystander sites, in contrast, gets a longer S-QRS than the E-QRS interval during VT (Figure 10).
3. Post-pacing interval, or RC, in relation to the tachycardia cycle length. The post-pacing interval is measured from the last stimulus that entrains the VT to the next depolarization at the pacing site (Figure 9).60 As mentioned before, the RC in a reentry circuit represents the time required for the impulse to travel from the pacing site to the circuit, the time throughout the circuit, and the time back to the pacing site. As such, the post-pacing interval should equal the tachycardia cycle length (within 30 ms) if pacing is delivered from anywhere in the reentry circuit. Pacing from sites distant to the circuit or pacing from bystander sites inside the scar would result in longer post-pacing intervals, exceeding the tachycardia cycle length by more than 30ms.60 It is advisable to perform pacing at rates only slightly faster than the tachycardia cycle length, to avoid false post-pacing interval prolongation due to slowing conduction generated by very fast pacing. Far-field electrograms might be an important source of error when measuring the post-pacing interval. Far-field electrograms are present also during pacing, indicating that they are the result of a depolarized tissue that is remote from the catheter, whereas the local potential cannot be identified during pacing.
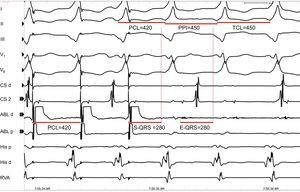
A good target site for ablation is characterized by concealed entrainment where the S-QRS interval equals the E-QRS and the post-pacing interval interval equals the tachycardia cycle length (Figure 12). Reproducible termination of VT by pacing stimuli that capture but fail to produce a QRS complex also indicates that the site is likely to be an isthmus.

Figure 12. Entrainment for identification of potential sites for ablation. Leads I, II, II, V1, and V6 of the surface electrocardiogram are shown together with intracardiacs from the coronary sinus, ablation, His and right ventricular apex catheters. The figure shows a potential good site for ablation, as there is concealed fusion during entrainment of ventricular tachycardia, with a stimulus to QRS interval=electrogram to QRS interval and post-pacing interval=tachycardia cycle length. ABL, ablation; CS, coronary sinus; E-QRS, electrogram to QRS interval; PCL, pacing cycle length; PPI, post-pacing interval; RVA, right ventricular apex; S-QRS, stimulus to QRS interval; TCL, tachycardia cycle length.
The end points for ablation in patients with post-MI VT are the following: a) noninducibility of the clinical VT; b) modification of the induced VT cycle length, and c) noninducibility of any VT.57 Overall, ablation is acutely successful, abolishing one or more scar-related monomorphic VTs in 77% to 95% of patients with post-MI VT.61 However, VT of the same or, more often, different morphology, might recur in 12% to 50% of patients, and new ablation procedures may be required in the follow-up. Epicardial ablation, through percutaneous access to the pericardial space under fluoroscopic guidance and contrast injection, is usually needed in 10% to 30% of post-MI VTs.62
SurgeryInitially developed in the late 1970s, surgery was later displaced by other therapies (especially ICD) due to the complexity of the procedure and a relatively high operative mortality rate (10%-15%).4 Currently, direct surgical ablation or resection of the arrhythmogenic substrate is still an option in experienced centers. In the setting of CAD, the candidates for surgery are usually patients with prior MI who already have an ICD and present recurrent VT refractory to drugs and percutaneous ablation. The procedure requires accurate intraoperative mapping, and either map-guided (subendocardial resection, focal cryoablation) or substrate-guided (aneurysmectomy, encircling cryoablation, encircling endocardial ventriculotomy) ablation techniques have been described, with a success rate between 60% and 100%.4
Conflicts of interestDr. Benito has no conflicts of interest to declare. Dr. Josephson is a consultant to Medtronic and receives honoraria for education from Medtronic and Biotronik.
Corresponding author: Cardiology Division, Harvard Medical School, 185 Pilgrim Road, Baker 4, Boston, MA 02215, United States. mjoseph2@bidmc.harvard.edu