Patients with congenital long QT syndrome (LQTS) have an abnormal QT adaptation to sudden changes in heart rate provoked by standing. The present study sought to evaluate the standing test in a cohort of LQTS patients and to assess if this QT maladaptation phenomenon is ameliorated by beta-blocker therapy.
MethodsElectrographic assessments were performed at baseline and immediately after standing in 36 LQTS patients (6 LQT1 [17%], 20 LQT2 [56%], 3 LQT7 [8%], 7 unidentified-genotype patients [19%]) and 41 controls. The corrected QT interval (QTc) was measured at baseline (QTcsupine) and immediately after standing (QTcstanding); the QTc change from baseline (ΔQTc) was calculated as QTcstanding – QTcsupine. The test was repeated in 26 patients receiving beta-blocker therapy.
ResultsBoth QTcstanding and ΔQTc were significantly higher in the LQTS group than in controls (QTcstanding, 528 ± 46ms vs 420 ± 15ms, P < .0001; ΔQTc, 78 ± 40ms vs 8 ± 13ms, P < .0001). No significant differences were noted between LQT1 and LQT2 patients. Typical ST-T wave patterns appeared after standing in LQTS patients. Receiver operating characteristic curves of QTcstanding and ΔQTc showed a significant increase in diagnostic value compared with the QTcsupine (area under the curve for both, 0.99 vs 0.85; P < .001). Beta-blockers attenuated the response to standing in LQTS patients (QTcstanding, 440 ± 32ms, P < .0001; ΔQTc, 14 ± 16ms, P < .0001).
ConclusionsEvaluation of the QTc after the simple maneuver of standing shows a high diagnostic performance and could be important for monitoring the effects of beta-blocker therapy in LQTS patients.
Keywords
Although long QT syndrome (LQTS) is a highly treatable channelopathy, its diagnosis remains a challenge for clinicians for a number of reasons: first, there is considerable overlap in the QT interval distribution between otherwise healthy individuals and patients with genetically confirmed LQTS1,2; second, arrhythmic episodes are uncommon and usually occur in unmonitored settings; and third, a negative genetic test cannot unequivocally exclude the diagnosis of LQTS by itself and it is sometimes difficult to distinguish pathogenic mutations from innocuous rare variants.3
Patients with suspected LQTS are often subjected to additional diagnostic studies such as exercise stress testing, 24-hour Holter monitoring, and epinephrine tests.4 The ideal diagnostic tool for this life-threatening disease should be simple to perform and interpret so that treatment can be started immediately without diagnostic delays. Long QT syndrome patients have recently been described5,6 to have an insufficient QT interval shortening to the tachycardia provoked by standing because they have an abnormal response to heart rate (HR) acceleration and because standing produces sudden changes in autonomic nervous system tone. Thus, beta-adrenergic stimulation fails to increase the net outward repolarizing current in LQTS patients with a defect in currents that are sensitive to sympathetic stimulation (IKs, IKr, and IK1).7–9
The objectives of this study were to a) corroborate the previous results of the standing test in our cohort of LQTS patients and controls, b) describe changes in ST-T wave patterns that could be used to identify genotypes, and c) evaluate whether beta-blocker (BB) treatment of LQTS patients improves the corrected QT interval (QTc) shortening response to abrupt standing.
METHODSStudy PopulationWe consecutively enrolled 36 newly diagnosed LQTS patients from Arrixaca University Hospital (Murcia, Spain) and La Fe Polytechnic and University Hospital (Valencia, Spain). Diagnosis of LQTS was based on the presence of a Schwartz score punctuation10 ≥ 4 and/or a pathogenic mutation in LQTS genes.
A causal mutation was found in 29 patients (80.5%). The remaining 7 patients had congenital deafness (n = 2), syncope (n = 4), QTc 4th minute of recovery from exercise stress test ≥ 480ms (n = 5), notched T waves (n = 5), and unexplained sudden cardiac death younger than age 30 among immediate family members (n = 2).
The control group consisted of 41 healthy asymptomatic relatives of patients with LQTS not carrying the familial mutation. Control individuals with electrocardiogram (ECG) abnormalities were excluded. The protocol was performed in all LQTS patients before treatment initiation with BBs and after the optimal BB dose in 26 patients. The study was approved by the Human Research Ethics Committees of the participating centers and was conducted in compliance with the Declaration of Helsinki. All patients provided written informed consent.
Protocol and MeasurementsStandard 12-lead-ECG was recorded at a paper speed of 25mm/s with a gain of 10mm/mV. We used the “bedside stand-up test” previously described by Viskin et al.5 Patients and controls underwent baseline ECG after resting supine for 10minutes; during continuous ECG recording, they were then asked to get up quickly. We simplified the “Viskin protocol”: QTc measurements were only performed a) before standing (QTcsupine), and b) immediately after standing-related artifacts disappeared (QTcstanding). Electrocardiograms recorded more than 10seconds after standing were excluded. The QTc change from baseline (ΔQTc) was obtained by subtracting the QTcsupine from the QTcstanding. QT intervals were manually measured from the onset of the QRS complex to the end of the T wave, and the end of the T wave was defined as the intersection point of the tangent line of the maximal slope on the terminal T wave and the isoelectric line. The QT interval was measured in II and V5 and was corrected by using Bazett's and Fridericia's formulae. Measurements of the QT interval were performed by an investigator who was blinded to the genetic and clinical information. ECG measurements were repeated 3 times and the average value was used in the statistical analysis.
In the protocol described by Viskin et al.,5 electrocardiographic recording was performed within a 30-second period after standing to calculate the QTc in 3 stages: maximal HR, maximal QT interval, and maximal QT interval stretching. In our study, we propose a new way to measure the QTc. This method involves a single measurement, is easier, faster, and accessible to any professional, and solves the difficulty of accurately measuring the maximal QT stretching and the shortest RR interval outside an electrophysiology laboratory.
Supine and standing ECGs of LQTS patients were classified as normal morphology repolarization or typical ST-T patterns. We used the ST-T morphologies described for Zhang et al.,11 distinguishing 2 typical type 1 LQTS (LQT1) patterns: a) a broad-based T wave, and b) a late-onset normal-appearing T wave; and 2 subtypes of bifid T waves in type 2 LQTS (LQT2): a) a subtle bifid T wave, and b) an obvious bifid T wave. Patients with type 7 LQTS (LQT7) and unidentified-genotype patients were also classified according to these morphologies.
Statistical AnalysisFor the statistical analysis, we used SPSS statistical software version 15.0 (SPSS, Chicago, United States). Continuous variables were tested for normal distribution using the Kolmogorov-Smirnov test and were expressed as mean ± standard deviation. Qualitative variables were expressed as absolute values and percentages. A 2-tailed t test, chi-square test, or Fisher exact test was used to compare group data as appropriate. Receiver operating characteristic curves were constructed to determine the area under the curve and to calculate the specificity of QTcsupine, QTcstanding, and ΔQTc to identify LQTS patients at the predefined sensitivity of 90%. The DeLong and DeLong method was used to compare the receiver operating characteristic curves of different measurements. Comparisons of QTc intervals before and after treatment with BB were done by using the Wilcoxon test. All P values < .05 were considered statistically significant.
RESULTSBaseline Clinical and Electrocardiographic CharacteristicsAmong the LQTS patients, 6 (17%) had LQT1, 20 (56%) had LQT2, 3 (8%) had LQT7, and 7 (19%) had an unidentified genotype. As expected, QT and QTc intervals were significantly longer in LQTS patients than in control individuals. Age, sex distribution, resting HR, and standing HR were similar in the LQTS and control groups (Table 1).
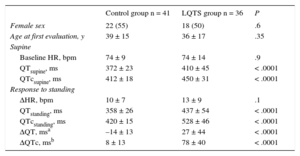
Baseline Characteristics and Response to Standing of Long QT Syndrome and Control Individuals
| Control group n = 41 | LQTS group n = 36 | P | |
|---|---|---|---|
| Female sex | 22 (55) | 18 (50) | .6 |
| Age at first evaluation, y | 39 ± 15 | 36 ± 17 | .35 |
| Supine | |||
| Baseline HR, bpm | 74 ± 9 | 74 ± 14 | .9 |
| QTsupine, ms | 372 ± 23 | 410 ± 45 | < .0001 |
| QTcsupine, ms | 412 ± 18 | 450 ± 31 | < .0001 |
| Response to standing | |||
| ΔHR, bpm | 10 ± 7 | 13 ± 9 | .1 |
| QTstanding, ms | 358 ± 26 | 437 ± 54 | < .0001 |
| QTcstanding, ms | 420 ± 15 | 528 ± 46 | < .0001 |
| ΔQT, msa | –14 ± 13 | 27 ± 44 | < .0001 |
| ΔQTc, msb | 8 ± 13 | 78 ± 40 | < .0001 |
Δ, increase; HR, heart rate; LQTS, long QT syndrome; QTc, corrected QT interval (Bazett's formula).
Values refer to number of patients (%) or mean ± standard deviation.
We observed no difference in HR acceleration in response to standing between the 2 groups. In the control group, the QTc increased slightly after standing (QTcsupine vs QTcstanding, 412 ± 18ms vs 420 ± 15ms; P < .0001) because there was a slower shortening of the QT interval than the RR interval during standing-induced tachycardia. However, the QT interval response to standing was markedly different in the LQTS group. There was a significant increase in QT and QTc intervals immediately after standing vs baseline (QTsupine vs QTstanding, 410 ± 45ms vs 437 ± 54ms, P = .001; QTcsupine vs QTcstanding, 450 ± 31ms vs 528 ± 46ms, P < .0001), and this change was significantly different from that shown by the control group (ΔQT in the LQTS group vs ΔQT in the control group, 27 ± 44ms vs –14 ± 13ms, P < .0001; ΔQTc in the LQTS group vs ΔQTc in the control group, 78 ± 40ms vs 8 ± 13ms, P < .0001) (Table 1). The difference in the QTc between LQTS patients and control individuals remained significant when Fridericia's formula was used and for both leads V5 and II.
No significant difference was noted in the increase in the QTc between LQTS males and females (ΔQTc in females vs ΔQTc in males, 85 ± 43ms vs 71 ± 37ms, P = .3).
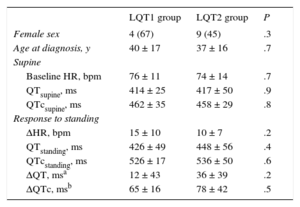
LQT1 and LQT2 patients had similar baseline characteristics, including QT and QTc intervals (Table 2). There was a trend to higher QTc prolongation with standing in LQT2 patients, but the difference was not statistically significant.
Comparison of Type 1 Long QT Syndrome and Type 2 Long QT Syndrome Groups
| LQT1 group | LQT2 group | P | |
|---|---|---|---|
| Female sex | 4 (67) | 9 (45) | .3 |
| Age at diagnosis, y | 40 ± 17 | 37 ± 16 | .7 |
| Supine | |||
| Baseline HR, bpm | 76 ± 11 | 74 ± 14 | .7 |
| QTsupine, ms | 414 ± 25 | 417 ± 50 | .9 |
| QTcsupine, ms | 462 ± 35 | 458 ± 29 | .8 |
| Response to standing | |||
| ΔHR, bpm | 15 ± 10 | 10 ± 7 | .2 |
| QTstanding, ms | 426 ± 49 | 448 ± 56 | .4 |
| QTcstanding, ms | 526 ± 17 | 536 ± 50 | .6 |
| ΔQT, msa | 12 ± 43 | 36 ± 39 | .2 |
| ΔQTc, msb | 65 ± 16 | 78 ± 42 | .5 |
Δ, increase; HR, heart rate; LQT1, type 1 long QT syndrome; LQT2, type 2 long QT syndrome; QTc, corrected QT interval (Bazett's formula).
Values refer to number of patients (%) or mean ± standard deviation.
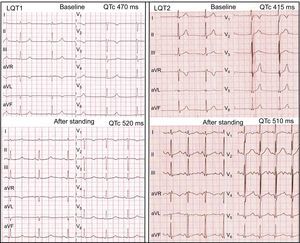
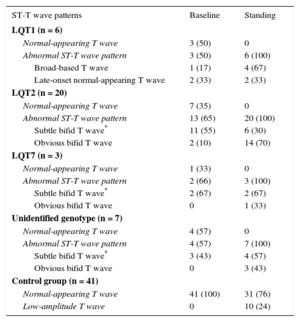
Morphologic ST-T wave characteristics at baseline and immediately after standing are shown in Table 3. Three LQT1 patients (50%) had normal-appearing T waves, but all LQT1 patients showed abnormal T wave patterns in the standing position (4 [67%] broad-based T waves and 2 [33%] late-onset normal-appearing T waves) (Figure 1). In the LQT2 group, 7 patients (35%) had normal repolarization and all patients developed bifid T waves in response to brisk standing, with marked bifid T waves visible in 14 (70%) (Figure 1). Furthermore, none of the LQT7 and genotype-negative LQTS patients showed normal T waves immediately after standing. In contrast, in most individuals of the control group, the normal T waves of the supine position remained unchanged with standing, and only 10 controls (24%) developed low-amplitude T waves with the postural change.
ST-T Wave Patterns in the Supine Position and After Standing
| ST-T wave patterns | Baseline | Standing |
|---|---|---|
| LQT1 (n = 6) | ||
| Normal-appearing T wave | 3 (50) | 0 |
| Abnormal ST-T wave pattern | 3 (50) | 6 (100) |
| Broad-based T wave | 1 (17) | 4 (67) |
| Late-onset normal-appearing T wave | 2 (33) | 2 (33) |
| LQT2 (n = 20) | ||
| Normal-appearing T wave | 7 (35) | 0 |
| Abnormal ST-T wave pattern | 13 (65) | 20 (100) |
| Subtle bifid T wave* | 11 (55) | 6 (30) |
| Obvious bifid T wave | 2 (10) | 14 (70) |
| LQT7 (n = 3) | ||
| Normal-appearing T wave | 1 (33) | 0 |
| Abnormal ST-T wave pattern | 2 (66) | 3 (100) |
| Subtle bifid T wave* | 2 (67) | 2 (67) |
| Obvious bifid T wave | 0 | 1 (33) |
| Unidentified genotype (n = 7) | ||
| Normal-appearing T wave | 4 (57) | 0 |
| Abnormal ST-T wave pattern | 4 (57) | 7 (100) |
| Subtle bifid T wave* | 3 (43) | 4 (57) |
| Obvious bifid T wave | 0 | 3 (43) |
| Control group (n = 41) | ||
| Normal-appearing T wave | 41 (100) | 31 (76) |
| Low-amplitude T wave | 0 | 10 (24) |
LQT1, type 1 long QT syndrome; LQT2, type 2 long QT syndrome; LQT7, type 7 long QT syndrome.
Values refer to number of patients (%).

Left panel: standing test in an LQT1 patient. At baseline, the HR is 50 bpm, QT interval is 515ms, and QTc is 470ms. After standing, the HR is 75 bpm, QT interval is 465ms, and QTc is 520ms. A late-onset normal-appearing T wave pattern is noted after standing. Right panel: standing test in an LQT2 patient. At baseline, the HR is 60 bpm, QT interval is 415ms, and QTc is 415ms and subtle bifid T waves are noted in V2-V3. After standing, the HR is 106 bpm, QT interval is 384ms, and QTc is 510ms and obvious bifid T waves have developed in all leads. HR, heart rate; LQT1, long QT syndrome type 1; LQT2, long QT syndrome type 2; QTc, corrected QT interval.
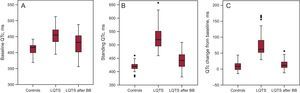
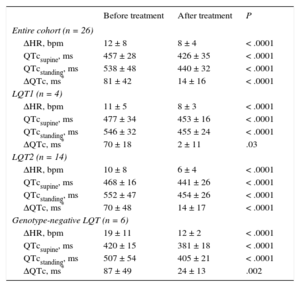
We analyzed the effect of BB therapy on the QT response to brisk standing in a subgroup of patients (Table 4). As expected, the increase in HR with standing was significantly lower under BB therapy. In addition, we observed that QTcstanding and ΔQTc decreased significantly under BB therapy, reaching similar values to the control group (Figure 2). Furthermore, this “normalization” of QT response to standing was evident in the LQT1 group, LQT2 group, and LQT group with an unidentified genotype. Two patients in the LQT7 group received BB therapy; these patients also showed a decrease in QT measurements after standing. Similar results were obtained using Fridericia's formula.
Effects of Beta-blockers on the QT Response to Standing in Long QT Syndrome Patients
| Before treatment | After treatment | P | |
|---|---|---|---|
| Entire cohort (n = 26) | |||
| ΔHR, bpm | 12 ± 8 | 8 ± 4 | < .0001 |
| QTcsupine, ms | 457 ± 28 | 426 ± 35 | < .0001 |
| QTcstanding, ms | 538 ± 48 | 440 ± 32 | < .0001 |
| ΔQTc, ms* | 81 ± 42 | 14 ± 16 | < .0001 |
| LQT1 (n = 4) | |||
| ΔHR, bpm | 11 ± 5 | 8 ± 3 | < .0001 |
| QTcsupine, ms | 477 ± 34 | 453 ± 16 | < .0001 |
| QTcstanding, ms | 546 ± 32 | 455 ± 24 | < .0001 |
| ΔQTc, ms* | 70 ± 18 | 2 ± 11 | .03 |
| LQT2 (n = 14) | |||
| ΔHR, bpm | 10 ± 8 | 6 ± 4 | < .0001 |
| QTcsupine, ms | 468 ± 16 | 441 ± 26 | < .0001 |
| QTcstanding, ms | 552 ± 47 | 454 ± 26 | < .0001 |
| ΔQTc, ms* | 70 ± 48 | 14 ± 17 | < .0001 |
| Genotype-negative LQT (n = 6) | |||
| ΔHR, bpm | 19 ± 11 | 12 ± 2 | < .0001 |
| QTcsupine, ms | 420 ± 15 | 381 ± 18 | < .0001 |
| QTcstanding, ms | 507 ± 54 | 405 ± 21 | < .0001 |
| ΔQTc, ms* | 87 ± 49 | 24 ± 13 | .002 |
Δ, increase; HR, heart rate; LQT1, type 1 long QT syndrome; LQT2, type 2 long QT syndrome; QTc, corrected QT interval (Bazett's formula).
Values refer to number of patients (%).
. BB, beta-blocker; LQTS, long QT syndrome; QTc, corrected QT interval.")
Box plots of QT measurements in LQTS patients and controls. The central box represents the values from the 25th to 75th percentile, the middle line represents the median, and the vertical line extends from the minimum to the maximum value, excluding outside and far out values (displayed as separate points). BB, beta-blocker; LQTS, long QT syndrome; QTc, corrected QT interval.
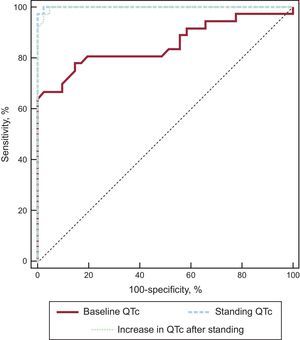
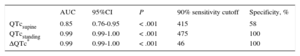
The receiver operating characteristic curves of QTcstanding and ΔQTc showed an incremental diagnostic value with respect to QTcsupine (Figure 3, Table 5). We observed that for a cutoff of 90% sensitivity, the specificity increased from 58% for QTcsupine to 100% for both QTcstanding and ΔQTc. Comparisons of curves revealed that the QTcstanding and ΔQTc were significantly better than the QTcsupine interval for the diagnosis of LQTS patients (P = .001 and P = .002, respectively).

Receiver Operating Characteristic Curve Analysis of Variables
| AUC | 95%CI | P | 90% sensitivity cutoff | Specificity, % | |
|---|---|---|---|---|---|
| QTcsupine | 0.85 | 0.76-0.95 | < .001 | 415 | 58 |
| QTcstanding | 0.99 | 0.99-1.00 | < .001 | 475 | 100 |
| ΔQTc* | 0.99 | 0.99-1.00 | < .001 | 46 | 100 |
Δ, increase; 95%CI, 95% confidence interval; AUC, area under the curve; QTc, corrected QT interval (Bazett's formula).
In response to a sudden HR acceleration, the QT interval decreases more slowly than the RR interval.12 Thus, after abrupt changes in the pacing rate in patients with complete heart block, approximately 2minutes of progressive QT interval shortening are required before a new steady-state is reached; the length of this interval is independent of the magnitude of the rate change and the baseline HR.13,14 Another study showed that when the pacing cycle length is suddenly decreased, the first action potential duration shortens abruptly and several minutes are required for the final steady-state adaptation.15 Based on these findings and considering that a) sympathetic stimulation associated with standing affects the QT interval independently of the HR15; b) the abrupt change in HR is more important than the maximal HR achieved, and c) a relatively long time elapses before the QT steady-state adaptation is achieved, we tried to corroborate the previous results of Viskin et al.5 by using a single ECG recording on standing immediately after the disappearance of movement-related artifacts. In the Viskin study,5 the maximal HR acceleration occurred within 15seconds of standing, whereas the ECG was recorded before 10seconds in our protocol. Thus, it is likely that, in some patients, the ECG was conducted prior to the maximal HR, underlying the importance of sympathetic stimulation and the sudden change in HR mentioned above.
In our control group, the QTc prolongation in response to standing was less than that previously reported.6,7 However, the speed with which the QT interval adapts to HR changes is highly individual.12 In contrast, LQTS patients had a marked defect in the QT interval adaptation to changes in HR compared with controls. Provocative testing using catecholamine infusion, exercise testing, and the response to brisk standing may reveal this maladaptation, being all of these approaches useful in unmasking concealed forms of this potentially fatal disease.15 Under normal conditions, beta-adrenergic stimulation is expected to increase the net outward repolarizing current, including the Ca2+-activated slow component of the delayed rectifier potassium current (IKs) more than that of an inward current, the Na+/Ca2+ exchange current (INa-Ca), resulting in shortening of the action potential duration and QT interval. In LQT1, a defect in IKs could account for the failure of beta-adrenergic stimulation to abbreviate the action potential duration and QT interval, resulting in a persistent and paradoxical QT prolongation under sympathetic stimulation.7 Beta-adrenergic stimulation in LQT2 patients was reported to initially prolong but then abbreviate action potential duration and QT, probably because of an initial augmentation of the INa-Ca with a concomitant defect in the rapidly activating delayed rectifier potassium channel (IKr) and subsequent stimulation of the IKs.16 Thus, the QT interval immediately after standing would be equivalent to the initial phase of the epinephrine test of the Shimizu protocol when both LQT1 and LQT2 patients could show an abnormal QT interval response.4 Previous studies have reported than LQT2 patients develop greater QT prolongation than LQT1 patients.5,6 Although the differences between LQTS groups were less marked in our cohort, we also observed this trend, which is congruent with the high frequency of arrhythmias related to sudden HR acceleration in LQT2 patients (arousal).17 We hypothesized that the rapid activation of IKr compared with IKs could explain the trend to a higher QT prolongation of LQT2 patients. IKs is not completely activated immediately after a HR change in healthy individuals, and therefore a defect in this channel may not be completely evident in LQT1 patients. However, we showed that the degree of IKs activation immediately after standing would be enough to indicate an inadequate QT adaptation in LQT1.
The inward rectifier potassium channel (IK1), which is responsible for LQT7, is also sensitive to sympathetic stimulation.18 The LQT7 (Andersen-Tawil syndrome), a rare clinical disorder consisting of potassium-sensitive periodic paralysis, a long QT interval, and dysmorphic features, has been linked to defects in KCNJ2, the gene encoding for IK1. The IK1 defect produces homogeneous prolongation of the action potential duration of the 3 ventricular cell types (epicardial, endocardial, and M cells) and thereby prolongs the QT interval without increasing the transmural dispersion of repolarization.9 Isoproterenol in the presence of IK1 inhibition causes an abbreviation of the action potential duration of the 3 cell types that starts to be significant after 3minutes of infusion,9 so that LQT7 patients could have QT interval prolongation with standing. However, studies with larger populations are necessary to establish the LQT7 response to standing.
Typical ST-T wave patterns are frequently present in LQTS patients and can help cardiologists to identify the genotype. Moss et al.19 and Dausse et al.20 initially reported an association of specific T wave patterns with LQT1 and LQT2. Later, Zhang et al.11 analyzed 284 gene LQTS carriers to determine which ST-T wave patterns were more common in each type of LQTS. The pathophysiological explanation for this phenomenon resides in the prolongation of the action potential duration in epicardial, endocardial, and M cells, which are different for each type of LQTS. We noted that ST-T wave abnormalities became more marked in patients with morphologic alterations at baseline and that those patients with normal T morphology at baseline developed abnormalities with standing. Consequently, all LQTS patients, including unidentified-genotype patients, had some degree of morphological T wave alterations in response to standing. In contrast, although 25% of controls presented a low-amplitude T wave with standing, none of them showed the typical ST-T waves abnormalities described in LQTS patients.
We observed a slightly lower increase in the QTc after standing than previous studies, especially in the control group.5,6 This difference could be explained by differences in study methodologies, such as a single ECG that does not always correspond with the QT during maximal QT interval stretching. Thus, in our cohort, a cutoff of 475ms for QTcstanding and 46ms for ΔQTc showed a specificity of 100% with a high sensitivity. The higher specificity compared with the study by Viskin et al.5 is probably due to the lower increase in the QTc observed in our control group.
As stated above, activation of the sympathetic nervous system in LQTS causes QT prolongation, transmural dispersion of repolarization, and ventricular arrhythmias. Linker et al.21 reported that in LQTS patients with impaired QTc adaptation, a normalization of QT dynamics occurs after beta-adrenergic blockade. Subsequent studies showed that the beta-adrenergic blockade slightly reduced the mean QTc in LQTS patients but markedly suppressed the increase in the QTc provoked by standing, probably by decreasing the spatial dispersion of ventricular repolarization.22–24 Specifically, Walker et al.24 reported that in treadmill exercise testing, the postural change in the QTc was attenuated in a group of 11 patients with LQT2. In this study, we support the hypothesis that QTc adaptation to sudden changes in HR becomes nearly normal after BB therapy in LQTS patients and show for the first time that this effect is consistent for the different types of LQTS involving channels sensitive to sympathetic stimulation (IKs, IKr, and IK1). The effects of BBs in LQTS are secondary to several mechanisms, such as direct modulation of potassium channels, inhibition of early afterdepolarizations, reduction of HR acceleration and sudden HR changes, and suppression of catecholamine-mediated action potential prolongation, especially in the M cell layer, which reduces action potential duration.24,25 Furthermore, beta-adrenergic blockade blocks the influence of epinephrine on the T wave morphology.25 In this context, we observed that sudden standing produced similar changes in ST-T wave morphology to that observed in other provocative tests and that these changes returned to normal after BB therapy.
Because some patients cannot tolerate maximum BB doses due to adverse effects, we do not know if the prescribed dose is safe to prevent arrhythmic events. Although BB therapy can slightly reduce the resting QTc in LQTS patients,22–24 it is difficult to know its effective dose, especially in asymptomatic patients and in patients with a normal QT interval. A significant prolongation of the QTc with standing reflects an increased dispersion of repolarization that could increase arrhythmic risk. In this sense, a nonpathological response to standing under BB therapy would be associated with higher electrical stability and could therefore mean that the received dose is appropriate. In contrast, an increased BB dose would be reasonable in patients with pathological prolongation of the QTc with standing. However, larger studies should be conducted to determine the association between the response to the standing test and arrhythmic events in follow-up.
Study LimitationsLimitations to the study include the relatively small number of patients evaluated and the significant proportion of LQTS patients with an unidentified genotype. Another potential limitation is that all measurements of the QT interval were performed by a single investigator.
Although LQT3 is associated with defects in cardiac sodium channels, further studies are required to establish the response to standing of this type of LQTS. Finally, long-term follow-up studies are vital to determine if patients receiving BB therapy and with normal QTc adaptation to abrupt standing have fewer cardiac events.
CONCLUSIONSThere is an abnormal QTc adaptation to the sudden HR change provoked by standing in LQTS patients. Both the QTc after standing and the ΔQTc show high sensitivity and specificity for the identification of LQTS patients. In addition, typical ST-T wave patterns after standing could be useful for the genotype identification of LQTS patients. Finally, beta-adrenergic blockade suppresses the abnormal QTc increase after standing shown by LQTS patients before treatment.
CONFLICTS OF INTERESTNone declared.
- –
LQTS diagnosis remains a clinical challenge. Although genetic testing can confirm the diagnosis, the study is time consuming and failure to identify a mutation does not preclude the presence of LQTS. Moreover, LQTS patients often have a borderline or slightly prolonged QTc that is not considered diagnostic.
- –
Patients with congenital LQTS have an abnormal adaptation of the QT interval to the brisk tachycardia induced by standing.
- –
Our study shows that the standing test might be useful in the diagnosis of LQTS patients with defects in repolarizing currents that are sensitive to sympathetic stimulation (IKs, IKr, and IK1).
- –
Both QTcstanding and ΔQTc show high sensitivity and specificity for the identification of LQTS patients.
- –
Typical ST-T wave patterns are frequently seen after standing in LQTS patients and could provide important information for the diagnosis and genotype identification of these patients.
- –
We also describe that beta-adrenergic blockade suppresses the abnormal QTc response to standing in different types of LQTS involving channels sensitive to sympathetic stimulation.
This study has been funded partly by a national grant of FIS (PI11/02459) and by the Cardiovascular Research Network (RIC, RD12/0042/0049,29) from the Carlos III Health Institute-Unión Europea, Fondo Europeo de Desarrollo Regional, «Una manera de hacer Europa».
The investigators are part of a cardiovascular research network, Red de Investigación Cardiovascular (RIC RD12/0042/0049), and an Instituto Murciano de Investigación Biosanitaria (IMIB), both of which are from the Carlos III Health Institute. J.R. Gimeno Blanes is part of the clinical group CIBERER (GCV14/ER/1).