In a recent article published in Revista Española de Cardiología, we discussed cost-effectiveness analyses: why, when, for what reason, and how they can be used.1 As decision-making is of utmost importance in modern cardiology, we will present 2 articles on this subject, discussing how to improve this activity. In this first article, we analyze clinical and management decisions, and the ways to prioritize the medical technology we finance and use, with a view toward minimizing harm and maximizing effectiveness, safety, and efficiency.
CLINICAL DECISIONS AND QUALITY OF CAREBefore making a preventive, diagnostic, therapeutic, or organizational decision, it is imperative to estimate and compare the costs and consequences (risks, benefits, expected health outcomes) of all the available options. When resources are limited, (and they are, because we are unable to pay for all we want to do), we have to give priority to the “best” choices. The best are those that provide the greatest benefits to the largest number of patients and are detrimental to the fewest (ie, the most effective and safest ones) per unit of resources consumed, while considering the patients’ expectations and preferences, and those of society as a whole.2–5
In addition to clinical knowledge, estimation and comparison of benefits, risks, and costs requires technical and analytical knowledge in epidemiology, statistics, and economics. Often, desirable scientific evidence is lacking on the performance and cost of the options; in many cases, we do not have data or do not know how to rigorously evaluate what data there are. With regard to the latter, we should make a differential diagnosis between medical uncertainty and medical ignorance. In a narrow sense, there is uncertainty when information is lacking or insufficient (eg, treatment for cardiac angiosarcoma or pancreatic adenocarcinoma). There is ignorance when one is unaware of existing scientific evidence (sometimes manifesting as inappropriate diagnoses or treatments).6–8
Clinical decisions incorporate social value judgements (of an ethical, moral, emotional, and even religious nature), which concern everyone and express our preferences and expectations regarding health, medical care, and how to assign and manage the available resources. To incorporate these preferences into our decision-making, we must deliberate beyond metrics and complex analyses.9–13
In addition, the quality of the studies carried out to generate scientific evidence varies, as does their interpretation. We do not all have the same opinions and preferences, or declare the same value judgements. There is also considerable variation, often with marked discrepancies, in the way clinicians incorporate and process all this data in their medical decisions, and in the way health care managers and policy makers reach decisions, allocate resources, and establish priorities. Judging by health outcomes, some teams do this in a technically better and socially more desirable manner than others.7
The above-described situation is only a problem if it leads to clinical decisions that produce differing health outcomes: improvements to varying degrees in some patients and unjustified and avoidable harm in others. The detrimental effects associated with underdiagnosis, overdiagnosis, undertreatment, and overtreatment exemplify the undesirable consequences of these unwarranted variations. Atlases of variations in medical practice quantify, describe, and illustrate these differences. Why, for example, are the age-, sex-, and caseload-adjusted utilization rates of computed tomography, magnetic resonance imaging, positron-emission tomography, interventional cardiology, hip arthroplasty, antibiotic consumption, and cesarean deliveries 10 to 20 times higher in some areas than others of the same country?7,14
WHO IS AFFECTED BY INDIVIDUAL CLINICAL DECISIONS?Individual clinical decisions affect us all. Let us imagine that a decision is taken to treat the first 5 young patients with acute lymphoblastic leukemia by administration of tisagenlecleucel, the first authorized treatment (Food and Drug Administration in August 2017) with CAR-T cells (T-lymphocytes with chimeric antigen receptors). The price of the single infusion of this drug is 475,000 dollars. Although this therapy seemed effective in the first clinical trials conducted (with small numbers of patients), there is now considerable uncertainty about its safety and effectiveness.15,16 Let us also imagine that 2 hospital departments require remodeling, the Intensive Care Unit wishes to incorporate extracorporeal membrane oxygenation (ECMO), General Surgery wants to include cytoreduction and hyperthermia to treat peritoneal carcinomatosis, and Urology is asking for a robotic surgery system. In addition, all these changes require specialized personnel and expenditure for training and maintenance. However, the spending rule says that the hospital budget cannot increase. If a decision is made to incorporate this new technology, how much and what activity should be reduced to cover this amount, if Cardiology and other departments are asked to reduce spending? Hematologists, intensive care specialists, and cardiologists want to offer the best care available to their patients, and they do not want these decisions to negatively affect them.
We have to offer the greatest health improvement to the largest number of patients with the available resources. Right now, there are hospitalized patients who could benefit from these treatments. Furthermore, people who are healthy now could be in a similar situation in the near future; in fact, we could be among them. The rule prevents spending more than the allocated budget. Hence, the decision of an individual physician for a single patient has an impact on the others that are treated today and will be treated tomorrow, as well as on the patients that other physicians are treating today and will treat in the future. If resources are allocated to pay for new technologies whose cost is relatively disproportionate to their therapeutic value (ie, with scant incremental effectiveness) or those that are less effective than existing options, it will be detrimental to patients today and the individuals who will be patients tomorrow. Resources that are destined for one purpose cease to be available for another.
David M. Eddy called this quandary “the conflict”, the individual in conflict with society: that is, between this individual patient mentioned (Eddy called it “the first position”), the other patients currently in the care of this and other physicians, and the remaining members of society, who are healthy today and will be patients of these physicians in the future (“the second position”).17,18 This last group and the future spending are hardly visible. They tend to be reduced to statistics, which diminishes our perception of the harm our current decisions can produce tomorrow. Perhaps these decisions would change if we were to reflect deeply on these facts.
WHAT IF WE CANNOT PAY FOR ALL WE WANT TO DO?When the available resources are insufficient to satisfy all the justified needs, we should set priorities. Ideally, from the macro perspective, we have to guarantee people's pensions, subsidize schools, pay for new drugs for hepatitis C infection and many others, build the Mediterranean railway corridor, repair infrastructure that has deteriorated with the passage of time, buy weapons for defense, finance the debt, help developing countries, invest in R&D, and a lengthy etcetera. As the available resources do not suffice for it all, we have to prioritize, and prioritize well, if we want to maximize the health and well-being of the largest number of people with the available resources.
Nobody will argue that the ultimate objective of public health (and other similar sectors) is to increase the health of the entire population and thereby contribute to improving social well-being. The needs of all segments of the population “compete” to be satisfied. We want it all, but that is not possible; nor are all the perceived needs actually real or urgent. We also agree that we should give priority to a condition which, with the available resources, can be managed in a way to provide a maximum of benefits for the most patients without being detrimental or providing small benefits to only a few. The problem is how to do it.
Health needs are a priority for the population and they should not be left unattended to satisfy other needs. If we invest in new infrastructures, resources will not be available for health or other sectors because the budget is limited. The same occurs at the meso and micro levels. If we equip our hospital with 2 robotic surgery systems, a proton accelerator, and ECMO, the resources used will not be available to finance, for example, endovascular treatment for mitral paraprosthetic leak, leadless pacemakers, or new activity in other hospital departments.
One of the keys to this macro, meso, and micro challenge lies in considering the opportunity cost of our priority decisions: the benefits we would obtain if, instead of increasing spending (for example) in infrastructure, we were to do so for the best alternative available, be it in health, in the environment, in R&D, or in combat aircraft. Every decision has an opportunity cost, and if we omit this factor from the decision-making process, sooner or later we may have problems that compromise overall well-being; in this case, the cost is always health gained or lost.5,13,19,20
Keeping in mind the health needs at each time point, a fixed budget, spending rules, and the above-mentioned aspects, we can conclude that the decision to incorporate new medical technology (eg, drugs, instruments, diagnostic tests, surgical interventions, health programs, new departmental organization models, new data processing systems, or centers to evaluate results) within the set of services provided by the publically-funded national health system also has an opportunity cost.
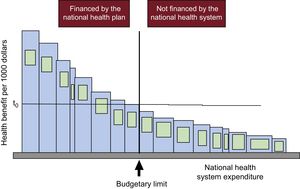
Let us have a look at Figure 1, from an article by one of the fathers of health economics, Anthony J. Culyer, who presents his model (the bookshelf guide) to explain the significance and use of cost-effectiveness threshholds.13,20 Each bar represents a type of technology (drugs, diagnostic tests, strategies, programs, including those in public health, veterinary medicine, environment, etc.) When referring to a health system, the width of each bar signifies a combination of the cost of the technology, the cost of associated technology (eg, the electrocardiogram, stress test, and coronary angiography prior to stent placement, and the subsequent medication and follow-up) and the number of patients treated in a specific period. The height of the bar is its effectiveness per each 1000 euros (or the currency corresponding to each country) spent on it, the inverse of its cost-effectiveness ratio. It could also express the quality-adjusted life-years (QALY) gained for each 1000 euros invested; that is, the inverse of its cost-utility ratio, defined in the preceding article.1 The bars are arranged in descending order from left to right, according to their effectiveness-cost. The more to the left, the greater the health produced per 1000 euros spent; the more to the right, the less health per 1000 euros. The central vertical line indicates the available budget and separates the items that are financed (to the left) from those that are not (to the right). There are no further resources to finance the items to the right of this line. The area of each bar is the health generated by each technology for this level of expenditure. The area of the entire set of bars to the left of the budget line is the total health produced by the health system with the care financed with this budget.
 separating technologies that are financed from those that are not financed by a national health system and the cost-effectiveness threshold (t0). Reproduced with the permission of Culyer et al.12")
Budgetary limit (vertical) separating technologies that are financed from those that are not financed by a national health system and the cost-effectiveness threshold (t0). Reproduced with the permission of Culyer et al.12
In this case, there is no doubt that setting priorities for financing medical technology has maximized the health that can be generated with this budget. None of the items that have not been financed (to the right of the vertical line) are more cost-effective than those that have been financed; that is, none to the right of the budget have a larger bar.
It is also evident in this example that if the system decides to finance an additional item, that is, to incorporate to the left of the budget line one of the previously unfunded technologies, first we would be obliged to reinvest. As there is no further budget, we would have to stop financing one of the previously funded items to free up resources for the new item.13,20 Second, the decision will inevitably imply a loss of health because the area of any of the bars of unfunded technologies that would shift to the left of the budget line is smaller than the least cost-effective of the financed ones (the one adjacent to the vertical on the left, which produces the least health per 1000 euros).
These unfunded technologies are not ineffective or noncost-effective; they are simply less cost-effective than any of the financed ones are, even the least cost-effective one. Hence, this specific health system is efficient. The horizontal line on the figure indicates the cost-effectiveness threshold (t0). This limit is the cost-effectiveness or cost-utility ratio of the least cost-effective technology of all those financed with that budget in that period. This explains the meaning of the cost-effectiveness threshold as a measure to prioritize from the supply side; that is, to determine which services and benefits the health system can finance with the available budget. Up to the threshold value, an item is financed, but above the threshold and budget, it is not.1 If the threshold is, for example, 24 000 euros per QALY and the incremental cost-effectiveness ratio of the new technology is 22 500 euros per QALY, it would be financed, but if it were 28 000 euros per QALY, it would not. When the system operates in this manner, it is efficient. It provides maximum clinical effectiveness and safety per each 1000 euros spent; always, let us not forget, within a limited budget.
Therefore, to finance new technology using this model, the absolute effectiveness of the technology (compared with a placebo) does not matter; what is important is the relative or incremental effectiveness (compared with the best available alternative option). Nor does the relative cost alone matter. What is decisive is the cost-effectiveness ratio or the incremental cost-utility ratio: the value that results from dividing the difference between the cost of the new technology and that of the best alternative by the difference between the effectiveness (or utility) of the technology and that of the alternative. As the health system used as an example employs the threshold (and some actually do use it), the decision to prioritize and finance resides in comparing the incremental cost-effectiveness ratio of the new candidate technology with that of the threshold. Remember, up to the threshold and within the available budget, the item is financed; above the threshold and budget, it is not.1 By so doing, the system is efficient.
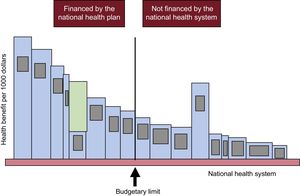
The meaning of the threshold is also illustrated in Figure 2.3,20 If we pay for technologies that are less cost-effective (fifth bar counting from left to right in the financed group) than some that are more cost-effective but not financed (like the one with the largest area to the right of the threshold),1 we are losing health in an amount represented by the green area in the fifth bar from the left. (For example, if we finance computed tomography scans for all patients with suspected pyelonephritis, perform esophageal surgery, and install a catheterization laboratory in all hospitals; incorporate a cardiac surgery unit for every 300 000 inhabitants; perform colonoscopy every 2 years in all men and women, a mammogram in all women older than 50 years, and transurethral ultrasound and biopsy in all those with a prostate-specific antigen result of 6; or open a liver transplant unit for every 500 000 inhabitants). This green area would be the exact opportunity cost of financing this technology: the health gain we would achieve (or the health loss we would avert) if we replace its funding with that of the largest area to the right of the budget limit.

Loss of health due to inadequate selection of technologies financed by a national health system. Reproduced with the permission of Culyer et al.12
When new technologies are financed, health will be gained if, and only if, 2 conditions are met: first, if they are more cost-effective than the least cost-effective financed (ie, more than the threshold) and second, if other, less cost-effective items cease to be financed to free up resources and accommodate the more effective options in the fixed budget.
CAN WE PRIORITIZE WITHOUT HARM?It is possible to set priorities without harm. It has been estimated that 20% to 30% of the medical technologies used worldwide are of low clinical value. They are not safe and effective or they are less safe, effective, and cost-effective in all patients or in subgroups than the least safe, effective, and cost-effective option within the services portfolio; this also includes those that are cost-effective but are used improperly, or cause harm.21–24 These low-value technologies are recognized and have led to initiatives by physicians in prestigious scientific institutions and societies. Among these, there are lists such as “Do not Do” from the National Institute for Health and Care Excellence (NICE) in Britain or “Choosing Wisely” from the American Board of Internal Medicine (ABIM) foundation, those appearing in journals such as Annals of Internal Medicine listing diagnostic tests and interventions having low value, and the atlases of variations in clinical practice (which can indicate unjustified underuse or overuse). These last publications also contain variations in the use of low-value technologies and lists of candidate technologies for “reinvestment” from several countries, all with their correlates already established by various medical societies and the Ministry of Health Social Services, and Equality in Spain.25–28
Considering reinvestment as simply cutting back indicates a lack of understanding. Strictly speaking, disinvestment or reinvestment is an explicit process by which low-value medications, devices, instruments or procedures (ie, those that are not clinically effective, those that are not cost-effective, and those whose effectiveness or efficiency are markedly marginal or inferior to that of other available options) cease to be financed, while (and this is the key semantic expansion) other options having greater clinical value are promoted and the freed-up resources are used to finance them.21 Reinversion has to consider that some technologies are only cost-effective in certain patient subgroups.
What, then, is the problem? That, for several known reasons, which we will not deal with in this article, these recommendations are met only in part or not at all. This also occurs in many countries with recommendations from evaluation agencies, scientific societies, ministries, prominent university research centers, and clinical practice guidelines.
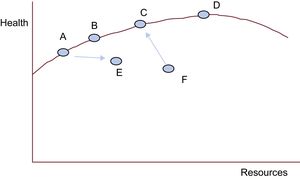
Can We Do More With Less? It DependsLet us look at the following health care production function (Figure 3).29 This is a representation of a model we consider useful to intuitively situate our health center on a function of efficient performance and to analyze the validity of a statement that is sometimes used without grounds: “More is less.”

Healthcare production function. Adapted from Chandra et al.29
The x-axis represents the total resources used by a national health system, a autonomous service, a hospital department, or a health care center (each point) to produce the health quantified on the y-axis (eg, increases in survival, quality of life, and life expectancy, or reductions in mortality, morbidity, complications, and disability). The red curve is known as the production possibility frontier. It represents the points in which the health systems, services, departments, or centers are the most efficient in producing health (y) for each level of resources available (x).
F produces less health than it should be able to generate with its resources. With better management and the same amount of resources, it could ascend toward the frontier, produce more health, and in short, be more efficient. In addition, F could do more with fewer resources (shifting a bit toward the left and toward C, as the arrow indicates). We cannot ask more of A, B, C, and D with the resources they have (in these cases, less is not more). They show maximum efficiency in health production with their management model and available resources. A and B would only be able to increase their health production if they had more resources and maintained their efficiency (more is more). D, like C, is also on the frontier. Nonetheless, although D has far greater resources than C, its production increase is relatively small. This means that C is more cost-effective than D. If A were to shift toward E, it would also be less cost-effective (consuming more resources and producing less health). If D receives more resources, it will enter into diminishing marginal returns: the more resources it consumes, the less health it will produce. In this case, more is indeed less.
Prioritizing can be done in many ways. Some do it in an arbitrary manner. Others use the described tools, which can help to minimize harm and maximize the effectiveness, safety, and efficiency of health care with the available resources, always while under the guarantee of adequate use of medical technologies. In the next article, we will see how what we have characterized as socially advisable for clinical decisions can be made individually attractive for clinicians.30
CONFLICTS OF INTERESTNone declared.