
The United Kingdom Prospective Diabetes Study (UKPDS) risk score has limited value for predicting coronary artery disease (CAD) events. We investigated the additive value of coronary computed tomography angiography (CCTA) on top of the UKPDS risk score in predicting 10-year adverse cardiac events in asymptomatic patients with type 2 diabetes.
MethodsWe evaluated 589 asymptomatic diabetic patients without a history of CAD who underwent CCTA. The primary outcome was a composite of cardiac death, nonfatal myocardial infarction, unstable angina requiring hospitalization, and revascularization. We estimated the discrimination and reclassification ability for the prediction models, which included combinations of the UKPDS category, severity of stenosis, and coronary artery calcium score by CCTA.
ResultsThe incidence of the primary outcome was 12.4%. During 10 years of follow-up, patients without plaque by CCTA tended to have a low CAD event rate, while those with obstructive CAD tended to have a high event rate, irrespective of the baseline UKPDS risk category. The model that included only the UKPDS category had a Harrell's c-index of 0.658; adding the degree of stenosis to the model significantly increased the c-index by 0.066 (P=.004), while adding coronary artery calcium score increased the c-index by only 0.039 (P=.056). Overall, CCTA information in addition to the UKPDS risk category improved the reclassification rate for predicting the primary outcome.
ConclusionsIn asymptomatic patients with type 2 diabetes, CCTA information for CAD provided significant incremental discriminatory power beyond the UKPDS risk score category for predicting 10-year adverse coronary events.
Keywords
Long-standing diabetes or diabetes target-organ damage is regarded to confer a similar degree of risk as coronary artery disease (CAD) for coronary events based on the observations that adverse coronary event rates in diabetic individuals with high-risk features and without known CAD are as high as those in nondiabetic individuals with prior CAD.1–3 This finding indicates that diabetic patients may have various degrees of subclinical CAD until the onset of myocardial infarction or death.4,5 Clinical risk score systems, including the United Kingdom Prospective Diabetes Study (UKPDS) risk score, are used to predict the occurrence of CAD events using clinical parameters; however, their performance in risk prediction is limited.6
Coronary computed tomography angiography (CCTA) is a reliable, noninvasive modality that can detect the presence, extent, and severity of CAD,7,8 and has independent value for event prediction and guiding the treatment strategy in patients with suspected CAD.9,10 Since CAD is the leading cause of death in patients with diabetes11 and risk score systems were solely based on clinical parameters that did not include anatomical information, the application of CCTA may have clinical value, particularly in asymptomatic diabetic patients at at least intermediate risk. Although the predictive role of CCTA in asymptomatic diabetic patients has been suggested by previous studies,12–14 its performance over a very long-term follow-up period has not been elucidated. In this study, we sought to evaluate the additwho ive value of CCTA findings in addition to the UKPDS risk score in predicting 10-year adverse cardiovascular outcomes in asymptomatic diabetic patients without a history of CAD.
METHODSStudy design and participantsThe study design, detailed entry criteria, and endpoints have been previously described.8,12 Briefly, this retrospective study comprised consecutive patients who were diagnosed with type 2 diabetes, had no cardiac symptoms or objective evidence of myocardial ischemia, and who underwent CCTA at the Diabetes Center of Asan Medical Center (Seoul, South Korea). The study excluded patients with abnormal findings on electrocardiography, renal insufficiency (creatinine ≥ 1.5mg/dL), history of coronary revascularization, myocardial infarction, heart failure, or uncontrolled arrhythmia, history of allergy to contrast media, pregnancy, or women of childbearing age who were not using contraceptives. A total of 578 out of 591 patients have been previously reported in a study on the long-term prognostic value of CCTA, and the current study additionally included the remaining 11 patients who had available follow-up data.12 Baseline demographic data were obtained by reviewing the patients’ medical records and the baseline laboratory data were measured. Microvascular complications of diabetes were classified into retinopathy confirmed by fundoscopic examination, neuropathy by a vibration sensory threshold test with a barely noticeable difference of just> 15 in the hands or> 20 in the feet, and nephropathy defined as> 20 μg/min of albuminuria. For the purposes of the study, the patients were categorized into 3 groups according to the 10-year risk of CAD by the UKPDS risk score system: low-risk group (< 10%), intermediate-risk group (10%-20%), and high-risk group (> 20%).15,16
Multidetector CCTA was performed using a dual-source scanner (Somatom Definition, Siemens, Germany). Image acquisition parameters have been previously reported.8 All CCTA scans were analyzed by 2 experienced cardiovascular radiologists blinded to the clinical information. A 16-segment coronary artery tree model was used according to the guidelines of the Society of Cardiovascular Computed Tomography.17 Coronary artery calcification was quantified, and patients were categorized into 2 groups based on a coronary artery calcium score (CACS) of 100.18 The contrast-enhanced portion of the coronary lumen was traced at the site of maximal stenosis. The stenosis diameter was calculated by comparing the diameter at the point of maximal stenosis with the mean diameter of the proximal and distal reference sites. Based on the diameter of the stenosis, the patients were classified into 3 groups: no CAD group, nonobstructive CAD group (stenosis diameter<50%), and obstructive CAD group (stenosis diameter ≥ 50%). The study was conducted in compliance with the Declaration of Helsinki and the study protocol was approved by the Institutional Review Board of Asan Medical Center (Seoul, Korea).
Outcomes and follow-upThe primary outcome for the between-group comparison was a composite of cardiac death, nonfatal myocardial infarction, unstable angina requiring hospitalization, and revascularization. Death was considered as cardiac unless an apparent noncardiac cause was established. Myocardial infarction was defined as documentation of a new pathologic Q-wave or an elevation of creatine kinase-myocardial band isoenzyme to at least 3 times the upper limit of the normal range with symptoms or signs of ischemia. Revascularization was defined as receiving either percutaneous coronary intervention or coronary artery bypass graft surgery at least 3 months after the CCTA evaluation. Complete information on vital status and date of death was obtained from the National Population Registry of the Korea National Statistics Office by using the unique 13-digit personal identification numbers assigned to all Korean citizens. The specific cause of death was verified by a review of medical records or telephone interviews.
Statistical analysisContinuous variables were compared using 1-way analysis of variance or the Kruskal-Wallis test, and categorical variables were compared with the chi-square test or the Fisher exact test, as appropriate. Time-to-event outcomes were estimated by the Kaplan-Meier method and compared using the log-rank test. Cox proportional hazard regression analysis was performed to examine the impact of the UKPDS scoring system, stenosis diameter assessed by the CCTA, and CACS on predicting the primary outcome, adjusted for age, sex, duration of diabetes, smoking, glycosylated hemoglobin, systolic blood pressure, microalbuminuria, and total cholesterol/high-density lipoprotein cholesterol. The discrimination and reclassification ability of the prediction models were estimated using the Harrell c-index, net reclassification index (NRI), and integrated discrimination index (IDI).19 Risk percentile cutoffs for NRI were 8.8% and 17.2% according to the approximate 20th and 80th percentiles of predicted risk based on model 0 (ie, the model that included only the UKPDS category). All reported P values are 2-sided, and those less than 0.05 were considered statistically significant. All statistical analyses were performed using the IBM SPSS Statistics for Windows, version 22.0 (IBM Corp, Armonk, NY, United States) and R software version 4.0.4 using packages rms, nricens, and survIDINRI.
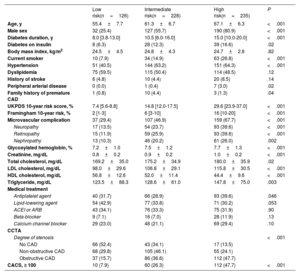
RESULTSBaseline characteristicsAfter excluding 2 patients whose UKPDS risk scores could not be calculated due to missing information on the smoking status or cholesterol level, we included 589 patients who had documented medical records of at least 1 follow-up visit 3 months after CCTA in the present analysis. Based on the UKPDS risk category, 126, 228, and 235 patients were categorized into low-, intermediate-, and high-risk groups, respectively. The baseline characteristics of the 3 groups are presented in table 1 and status of medical therapy at 5 years in table 1 of the supplementary data. Overall, the cohort was composed of 349 (59.3%) men, with a mean age of 62.4 years, and a 10-year median UKPDS risk of 17.3% (interquartile range [IQR], 12.6%-26.1%). Compared with those in the low- or intermediate-risk groups, patients in the high-risk group were generally older, had a higher proportion of male patients, and had a higher frequency of comorbidities or microvascular comorbidities. The degree of stenosis and CACS assessed by CCTA proportionally increased according to the UKPDS risk level; however, 13.5% of the low-risk group had obstructive CAD and 15.7% of the high-risk group had normal coronary arteries. Patients who were found to have CAD on CCTA received more intense medical therapy, particularly antiplatelet and lipid-lowering agents (table 2 of the supplementary data).
Baseline characteristics of the patients according to the UKPDS risk category
| Low risk(n=126) | Intermediate risk(n=228) | High risk(n=235) | P | |
|---|---|---|---|---|
| Age, y | 55.4±7.7 | 61.3±6.7 | 67.1±6.3 | <.001 |
| Male sex | 32 (25.4) | 127 (55.7) | 190 (80.9) | <.001 |
| Diabetes duration, y | 8.0 [3.8-13.0] | 10.5 [6.0-16.0] | 15.0 [10.0-20.0] | <.001 |
| Diabetes on insulin | 8 (6.3) | 28 (12.3) | 39 (16.6) | .02 |
| Body mass index, kg/m2 | 24.5±4.5 | 24.8±4.3 | 24.7±2.8 | .82 |
| Current smoker | 10 (7.9) | 34 (14.9) | 63 (26.8) | <.001 |
| Hypertension | 51 (40.5) | 144 (63.2) | 151 (64.3) | <.001 |
| Dyslipidemia | 75 (59.5) | 115 (50.4) | 114 (48.5) | .12 |
| History of stroke | 6 (4.8) | 10 (4.4) | 20 (8.5) | .14 |
| Peripheral arterial disease | 0 (0.0) | 1 (0.4) | 7 (3.0) | .02 |
| Family history of premature CAD | 1 (0.8) | 10 (4.4) | 3 (1.3) | .04 |
| UKPDS 10-year risk score, % | 7.4 [5.6-8.8] | 14.8 [12.0-17.5] | 29.6 [23.9-37.0] | <.001 |
| Framingham 10-year risk, % | 2 [1-3] | 6 [3-10] | 16 [10-20] | <.001 |
| Microvascular complication | 37 (29.4) | 107 (46.9) | 159 (67.7) | <.001 |
| Neuropathy | 17 (13.5) | 54 (23.7) | 93 (39.6) | <.001 |
| Retinopathy | 15 (11.9) | 59 (25.9) | 93 (39.6) | <.001 |
| Nephropathy | 13 (10.3) | 46 (20.2) | 61 (26.0) | .002 |
| Glycosylated hemoglobin, % | 7.2±1.0 | 7.5±1.2 | 7.7±1.3 | <.001 |
| Creatinine, mg/dL | 0.8±0.2 | 0.9±0.2 | 1.0±0.2 | <.001 |
| Total cholesterol, mg/dL | 169.2±35.0 | 175.2±34.9 | 180.0±35.9 | .02 |
| LDL cholesterol, mg/dL | 98.0±29.6 | 106.8±29.1 | 115.8±30.5 | <.001 |
| HDL cholesterol, mg/dL | 56.8±12.6 | 52.0±11.4 | 44.4±9.6 | <.001 |
| Triglyceride, mg/dL | 123.5±88.3 | 128.6±61.0 | 147.8±75.0 | .003 |
| Medical treatment | ||||
| Antiplatelet agent | 40 (31.7) | 66 (28.9) | 93 (39.6) | .046 |
| Lipid-lowering agent | 54 (42.9) | 77 (33.8) | 71 (30.2) | .053 |
| ACEI or ARB | 43 (34.1) | 76 (33.3) | 75 (31.9) | .90 |
| Beta-blocker | 9 (7.1) | 16 (7.0) | 28 (11.9) | .13 |
| Calcium channel blocker | 29 (23.0) | 48 (21.1) | 69 (29.4) | .10 |
| CCTA | ||||
| Degree of stenosis | <.001 | |||
| No CAD | 66 (52.4) | 43 (34.1) | 17 (13.5) | |
| Non-obstructive CAD | 68 (29.8) | 105 (46.1) | 55 (24.1) | |
| Obstructive CAD | 37 (15.7) | 86 (36.6) | 112 (47.7) | |
| CACS, ≥ 100 | 10 (7.9) | 60 (26.3) | 112 (47.7) | <.001 |
ACEI, angiotensin converting enzyme inhibitor; ARB, angiotensin receptor blocker; CACS, coronary artery calcium score; CAD, coronary artery disease; CCTA, coronary computed tomography angiography; HDL, high-density lipoprotein; LDL, low-density lipoprotein; UKPDS, UK Prospective Diabetes Study.
Values are expressed as No. (%), mean±standard deviation, or median [interquartile range].
The median length of follow-up was 10.0 years [IQR, 5.8-11.0] and 497 (84.4%) and 450 (76.4%) were followed up for more than 5 years and 8 years, respectively. During follow-up, 67 (11.4%) patients died, of whom 36 died of a cardiac cause. A total of 16 patients had acute coronary syndrome. Coronary revascularization was performed in 37 (6.3%) patients, of whom 9 underwent coronary artery bypass graft surgery.
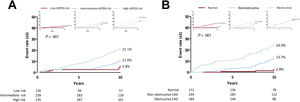
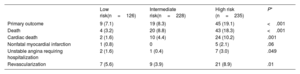
The Kaplan-Meier 10-year survival estimates for the primary outcome and its components are shown in table 2 and figure 1. The incidence of the primary outcome was 12.4% in the overall cohort and was significantly higher in the high-risk group than in the other groups. Of note, the observed 10-year event rate of the adverse composite outcome was comparable to the event rate predicted by the UKPDS risk score system in the low-risk group (5.8% and 7.1%) but was lower in the intermediate- (11.0% and 14.8%) and high-risk groups (21.0% and 32.3%) (figure 1A). Comparative rates of the predicted and actual adverse events according to the UKPDS risk, Framingham risk, Globorisk score systems are presented in figure 1 of the supplementary data, and the additive value of CCTA measurements on these risk score systems is presented in figures 2-3 of the supplementary data. When the patients were categorized according to the stenosis diameter by CCTA, the 10-year incidence of the primary outcome was significantly higher in the obstructive CAD group than in the nonobstructive group or no CAD (normal) group (figure 1B). In contrast to the trend observed in the groups stratified according to the UKPDS risk category, the observed 10-year event rates in the no CAD (2.8% and 14.7%) and nonobstructive CAD (13.7% and 19.6%) groups were substantially lower than the predicted event rate by the UKPDS risk score system, whereas the obstructive CAD group (24.0% and 25.8%) showed a comparable event rate. After adjustment for clinical variables constituting the UKPDS risk score, the degree of stenosis or CACS assessed by CCTA were independently associated with the 10-year risk of adverse cardiac events (table 3).
Event rates according to the UKPDS risk category
| Low risk(n=126) | Intermediate risk(n=228) | High risk (n=235) | P* | |
|---|---|---|---|---|
| Primary outcome | 9 (7.1) | 19 (8.3) | 45 (19.1) | <.001 |
| Death | 4 (3.2) | 20 (8.8) | 43 (18.3) | <.001 |
| Cardiac death | 2 (1.6) | 10 (4.4) | 24 (10.2) | .001 |
| Nonfatal myocardial infarction | 1 (0.8) | 0 | 5 (2.1) | .06 |
| Unstable angina requiring hospitalization | 2 (1.6) | 1 (0.4) | 7 (3.0) | .049 |
| Revascularization | 7 (5.6) | 9 (3.9) | 21 (8.9) | .01 |
Values are expressed as No. (%).
 the UKPDS Risk Group and (B) the degree of stenosis by CCTA. The small graphs on either side show the observed (line) and predicted (dot) risks by the UKPDS score within groups divided according to (A) the UKPDS risk and (B) the degree of stenosis on CCTA. CAD, coronary artery disease; CCTA, coronary computed tomography angiography; UKPDS, United Kingdom Prospective Diabetes Study.")
Actual and predicted event curves for the composite outcome of cardiac death, myocardial infarction, unstable angina requiring hospitalization, and revascularization according to (A) the UKPDS Risk Group and (B) the degree of stenosis by CCTA. The small graphs on either side show the observed (line) and predicted (dot) risks by the UKPDS score within groups divided according to (A) the UKPDS risk and (B) the degree of stenosis on CCTA.
CAD, coronary artery disease; CCTA, coronary computed tomography angiography; UKPDS, United Kingdom Prospective Diabetes Study.
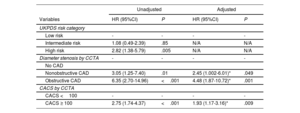
Risks for the primary outcome according to the UKPDS risk category and findings of coronary computed tomography angiography
| Unadjusted | Adjusted | |||
|---|---|---|---|---|
| Variables | HR (95%CI) | P | HR (95%CI) | P |
| UKPDS risk category | ||||
| Low risk | - | - | - | - |
| Intermediate risk | 1.08 (0.49-2.39) | .85 | N/A | N/A |
| High risk | 2.82 (1.38-5.79) | .005 | N/A | N/A |
| Diameter stenosis by CCTA | - | - | - | - |
| No CAD | ||||
| Nonobstructive CAD | 3.05 (1.25-7.40) | .01 | 2.45 (1.002-6.01)* | .049 |
| Obstructive CAD | 6.35 (2.70-14.96) | <.001 | 4.48 (1.87-10.72)* | .001 |
| CACS by CCTA | ||||
| CACS <100 | - | - | - | - |
| CACS ≥ 100 | 2.75 (1.74-4.37) | <.001 | 1.93 (1.17-3.16)* | .009 |
CACS, coronary artery calcium score; CAD, coronary artery disease; CCTA, coronary computed tomography angiography; CI, confidence interval; HDL, high-density lipoprotein; HR, hazard ratio; UKPDS, United Kingdom Prospective Diabetes Study.
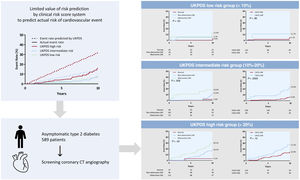
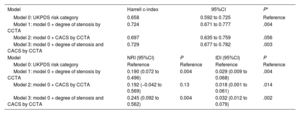
The cumulative incidence of the primary outcome according to the CCTA findings within each UKPDS risk category is shown in figure 2. Overall, the primary outcome rate consistently showed a substantial difference according to the CCTA findings within the intermediate- and high-risk UKPDS categories. The Harrell c-index of the final model, including only the UKPDS category, was 0.658 (95% confidence interval [CI], 0.597-0.678). Adding the degree of stenosis significantly increased the c-index by 0.066 (P=.004), while adding CACS increased the c-index by only 0.039 (P=.056). Compared with UKPDS risk category alone (model 0 in table 4), the NRIs and IDIs for the UKPDS risk category plus the degree of stenosis (model 1) were 0.190 (P=.004) and 0.029 (P=.004), respectively, and those for the UKPDS risk category plus CACS (model 2) were 0.192 (P=.128) and 0.018 (P=.014), respectively. Adding the degree of stenosis and CACS (model 3) further increased the NRI and IDI by 0.245 (P=.004) and 0.032 (P=.002), respectively (table 4). Overall, adding the CCTA information on top of the UKPDS risk category improved the reclassification rate for predicting the primary outcome. Additive values of CCTA measures on top of the Framingham risk and Globorisk score are shown in table 3 of the supplementary data.
, intermediate (middle), and high risk (lower). Left graphs show the event curve according to the severity of CAD on CCTA. Right graphs show the event curve according to the CACS category. CAD, coronary artery disease; CACS, coronary artery calcium score; CCTA, coronary computed tomography angiography; CT, computed tomography; UKPDS, United Kingdom Prospective Diabetes Study.")
Central illustration. Event curves for the composite outcome of cardiac death, myocardial infarction, unstable angina requiring hospitalization, and revascularization according to the UKPDS risk category and severity of coronary artery disease or the CACS category on CCTA. CCTA information can provide prognostic value on top of the clinical risk score system. Overall graphs are divided according to the UKPDS risk group; low (upper), intermediate (middle), and high risk (lower). Left graphs show the event curve according to the severity of CAD on CCTA. Right graphs show the event curve according to the CACS category.
CAD, coronary artery disease; CACS, coronary artery calcium score; CCTA, coronary computed tomography angiography; CT, computed tomography; UKPDS, United Kingdom Prospective Diabetes Study.
Harrell c-index, net reclassification index, and integrated discrimination index for the primary outcome
| Model | Harrell c-index | 95%CI | P* | |
|---|---|---|---|---|
| Model 0: UKPDS risk category | 0.658 | 0.592 to 0.725 | Reference | |
| Model 1: model 0 + degree of stenosis by CCTA | 0.724 | 0.671 to 0.777 | .004 | |
| Model 2: model 0 + CACS by CCTA | 0.697 | 0.635 to 0.759 | .056 | |
| Model 3: model 0 + degree of stenosis and CACS by CCTA | 0.729 | 0.677 to 0.782 | .003 | |
| Model | NRI (95%CI) | P | IDI (95%CI) | P |
| Model 0: UKPDS risk category | Reference | Reference | Reference | Reference |
| Model 1: model 0 + degree of stenosis by CCTA | 0.190 (0.072 to 0.496) | 0.004 | 0.029 (0.009 to 0.068) | .004 |
| Model 2: model 0 + CACS by CCTA | 0.192 (−0.042 to 0.569) | 0.13 | 0.018 (0.001 to 0.061) | .014 |
| Model 3: model 0 + degree of stenosis and CACS by CCTA | 0.245 (0.092 to 0.562) | 0.004 | 0.032 (0.012 to 0.079) | .002 |
CACS, coronary artery calcium score; CCTA, coronary computed tomography angiography; CI, confidence interval; IDI, integrated discrimination index; UKPDS, United Kingdom Prospective Diabetes Study.
The present extended follow-up CCTA study showed that information from CCTA provided incremental prognostic power beyond the clinical UKPDS risk score category for 10-year adverse coronary events in asymptomatic patients with type 2 diabetes. Patients with obstructive CAD assessed by CCTA had observed 10-year event rates similar to those with high-risk UKPDS category. Of note, stenosis diameter or CACS information from CCTA, rather than the clinical UKPDS risk score category, were independently associated with 10-year adverse coronary events. These findings suggest that CCTA could be used to estimate the coronary risk of diabetic patients, which could help guide the preventive strategy for these patients.
Coronary events in diabetic patients have been estimated using the UKPDS risk engine, a type 2 diabetes-specific risk calculator.6 However, several contemporary validation studies reported that the UKPDS system has modest discriminatory ability, generally overestimating the absolute risk of CAD, as shown in our analysis.6,20,21 Given that the amount and/or instability of coronary plaque causes adverse coronary events,22 the suboptimal performance of the UKPDS system may be explained by the discrepancy between the risk calculated by clinical factors and the patient's actual coronary disease. Indeed, in our cohort, 15.7% of patients categorized as low risk by the UKPDS scoring system had obstructive CAD, while 13.5% of those who were categorized as high risk had normal coronary arteries without any plaque. Accordingly, during the 10 years of follow-up, patients without plaque on CCTA tended to have a low CAD event rate and those with plaque on CCTA had a high CAD event rate, irrespective of the baseline UKPDS risk category. Thus, CCTA, which is the only noninvasive imaging tool that ascertains the overall extent and severity of CAD, has the potential to benefit diabetic patients, a population with a high risk of atherosclerosis.23
The present study was intended to assess whether the added prognostic value of CCTA on long-term coronary outcomes justifies its use as a complementary study for prediction purposes. Our data support such use of CCTA based on the findings that information on the stenosis diameter and CACS markedly improved the predictive ability of clinical data alone for outcome prediction. Each CCTA measurement provided ∼19% of net reclassification improvement, and the addition of both measurements showed ∼25% of reclassification improvement beyond the UKPDS risk score category. However, as expected, CACS alone had lesser discrimination ability than the degree of stenosis as reflected by the c-index and CI of NRI (model 2 in table 4). Of note, the outcome differentiation by CCTA seemed to be prominent in the intermediate- and high-risk groups according to UKPDS, suggesting its usefulness in specific subgroups of diabetic patients.
Nevertheless, our study does not necessarily support the use of CCTA as a screening test to improve prognosis in asymptomatic diabetic patients. The FACTOR-64 (Screening for Asymptomatic Obstructive Coronary Artery Disease Among High-Risk Diabetic Patients Using CT Angiography, Following Core 64) randomized trial evaluated whether systematic screening for CAD using CCTA would reduce adverse coronary events compared with standard treatment, and showed that subsequent medical and procedural management based on the findings of CCTA failed to significantly improve the prognosis during the 4 years of follow-up.24 Although the FACTOR-64 trial suggested that medical prevention is more important than cardiac imaging in asymptomatic patients with diabetes, it also left unresolved an issue regarding the selection of appropriate candidates for CCTA evaluation. The FACTOR-64 trial enrolled participants simply based on age and duration of diabetes and excluded those with prior extracardiac atherosclerotic disease, which eventually led to failure to include the intended “high risk” diabetic patients and resulted in an event rate of one-quarter of that predicted. Considering the high 10-year event rate observed in those with obstructive CAD and higher UKPDS risks in our cohort, further research to explore practical strategies for better risk prediction is warranted to identify patients who could derive the greatest benefit from CCTA screening.25
LimitationsOur study has several limitations. First, CCTA was performed at the discretion of each attending endocrinologist, which indicates potential selection bias in the study population. Second, this was an observational study based on a single-center experience, and the results may not be applicable to other centers with different CCTA scanners and sequences. Third, the long-term outcome could have been influenced by differences in modes of preventive care (ie, glycemic control or lipid management) and medications. Fourth, because clinical events were assessed by reviewing medical records or telephone interviews, the possibility of unrecognized events cannot be excluded. Last, our study excluded diabetic patients with creatinine ≥ 1.5 mg/dL to minimize safety issues relevant to contrast use. However, patients with renal dysfunction may derive greater advantage from the prediction of adverse coronary events by CCTA. Therefore, the results of the current study may not necessarily represent all diabetic patients.
CONCLUSIONSIn this extended follow-up study of asymptomatic patients with type 2 diabetes, CCTA information for CAD provided additional discriminative value beyond the clinical UKPDS risk score category for predicting the 10-year adverse coronary event. Further studies are needed to establish strategies to identify diabetic patients who could benefit from CCTA screening.
FUNDINGThis study was supported by a grant (2019IE7054) from the Asan Institute for Life Sciences, Asan Medical Center, Seoul, Korea.
AUTHORS’ CONTRIBUTIONSJ. Hyun, P.H. Lee, and S.W. Lee contributed to the study design and revision of the manuscript. J. Hyun and J.S. Lee contributed to the statistical analysis. All authors contributed to the data collection and interpretation of the study results. All authors have read and approved the final version of the manuscript.
CONFLICTS OF INTERESTNone reported.
Adverse coronary events are common in patients with diabetes and clinical risk score systems are used to predict the occurrence. CCTA is noninvasive method to detect CAD and information from CCTA including severity, extent of CAD, and CACS can reliably predict the prognosis.
WHAT DOES THIS STUDY ADD?A discrepancy between the observed and predicted 10-year incidence of adverse coronary events was noted according to the UKPDS risk category. The degree of stenosis and CACS assessed by baseline CCTA discriminated patients for 10-year adverse events, particularly in the intermediate- and high-UKPDS risk category. Adding CCTA information on top of the UKPDS risk category improved the reclassification rate for predicting the 10-year adverse coronary outcomes.