In the last few decades, there has been a continuous process of improvement in medical treatment and secondary prevention measures after ST-segment elevation myocardial infarction (STEMI). Patients older than 65 years are at increased risk of death due to this event. Our aim was to determine whether patients aged less than 65 years and 65 years and older experiencing a STEMI can recover a life expectancy similar to that of the general population of the same age, sex, and geographical region.
MethodsWe included all patients experiencing a STEMI at our institution during a 6-year period in an observational-study (SurviSTEMI: survival in STEMI). We calculated their observed survival, expected survival, and excess mortality. We repeated all analyses for survivors of the acute event stratifying by 65 years.
ResultsFor patients aged <65 years who survived the STEMI, observed survival at 3 and 5 years of follow-up was 97.68% (95%CI, 96.05%-98.64%) and 94.14% (95%CI, 90.89%-96.25%), respectively. Expected survival at 3 and 5 years was 98.12% and 96.61%. For patients ≥ 65 years who survived the STEMI, observed survival at 3 and 5 years was 85.52% (95%CI, 82.23%-88.24%) and 75.43% (95%CI, 70.26%-79.83%), respectively. Expected survival at 3 and 5 years was 86.48% and 76.56%, respectively.
ConclusionsFor survivors of the acute event, life expectancy is fairly similar to that of the general population of the same age, sex, and geographical region.
Keywords
Acute coronary syndrome represents one of the most relevant cardiovascular disorders worldwide and its prevalence is growing in elderly individuals. Coronary ischemic heart disease affects older adults disproportionately; in fact, it is estimated that more than 60% of ST-segment elevation myocardial infarctions (STEMIs) occur in patients aged 65 years or older.1 In addition, age is one of the most important factors related to short- and long-term survival. More than 80% of all deaths associated with myocardial infarction occur in patients older than 65 years.2 However, older patients are often underrepresented in clinical trials and long-term outcomes after STEMI have not been thoroughly studied.3 Delays in the diagnosis of STEMI have been well documented in older adults and delay appropriate therapy. Several characteristics such as atypical onset, left bundle branch block and concomitant acute heart failure are much more common in patients aged 65 years or older. This particular profile could explain the higher in-hospital mortality rate in this group of patients.3,4
In the current era, short- and long-term mortality following STEMI has been improved with the widely standardized use of emergent reperfusion therapies, especially primary percutaneous coronary intervention (PCI), contemporary antithrombotic regimens, and intensive secondary prevention measures.3–5 Nevertheless, mortality caused by STEMI remains relevant, with 1 year mortality being up to 10%.6,7 Furthermore, the 30-day mortality rate is crucial within the first year of follow-up, consistently showing the highest death rates during this period.8
Despite the clear influence of age on long-term survival after STEMI,9 prospective longitudinal studies rarely follow patients beyond the first year after the event.3 It is unknown whether patients experiencing a STEMI could have a life expectancy similar to that of the general population of the same age, sex, and geographical region. Studying life expectancy is complex since it depends on social, economic, and geographical factors that could explain variations even among developed countries.10
The main objective of the SurviSTEMI (Survival in STEMI) study was to analyze whether patients with STEMI treated with primary PCI have a life expectancy similar to that of the general population for the same age, sex, and geographical area focusing on differences between 2 age groups (< 65 and ≥ 65 years).
METHODSSelection of the STEMI sample and matching with the general populationAll patients experiencing a STEMI and treated with primary PCI at our institution from March 2014 to March 2020 were included in the SurviSTEMI study. More than 250 patients with STEMI are usually treated at our institution by a team of interventional cardiologists with more than 10 years of experience.
The reference population was constructed using the mortality tables provided by the National Institute of Statistics (INE).11 These tables can be consulted for different age ranges, sex and regions and are available on the official INE website. To compare survival in patients with STEMI with that in the general population, we used the INE data to match all patients in our sample with people of the same age, sex, and geographical area. More information about this process can be consulted in the section about the statistical process.
Data collectionFor this retrospective study, baseline characteristics, in-hospital data and treatments at hospital discharge were collected from a prospectively collected database. One of the researchers collected the data on the follow-up. All hospitals and clinics in our region are connected by intranet, so all medical records of each patient can be easily consulted from our institution. As a general rule, patients were treated at discharge following optimal medical treatment according to European Society of Cardiology Guidelines.3
Causes of death were defined according to the Academic Research Consortium consensus guidelines.12
This investigation was approved by the local Ethics Committee the Hospital Universitario Central de Asturias with the reference number 2020.184.
Primary endpoints- a)
To compare survival of patients aged less than 65 years who experienced a STEMI with that of the general population of the same age, sex, and geographical region.
- b)
To compare survival of patients aged 65 years or older experiencing a STEMI with that of the general population of the same age, sex, and geographical region.
To compare survival of patients older than 80 years experiencing a STEMI with that of the general population of the same age, sex, and geographical region.
Statistical processQuantitative and categorical variables are expressed as mean±standard deviation and No. (%).
To compare survival of patients experiencing a STEMI with that of the general population of the same sex, age and region, we calculated the following estimates: a) observed survival, b) expected survival and c) excess mortality due to the disease.13–16
- a)
Observed survival is the survival of our sample estimated with the usual actuarial method. This estimate is presented with its 95%CI.
- b)
Expected survival is the survival of the general population for the same age, sex, and geographical region. In other words, the expected survival is the survival that this sample would have had if they had not had the STEMI. This measure uses mortality tables of the National Institute of Statistics representing the people in our geographical region with the same age and sex. It is calculated with the Ederer II method, which is the method of choice.13 This allows matching of a sample of individuals with aggregated data of the general population. Since data come from all the people of the region, the expected survival has no sampling error and thus no confidence interval is estimated. If the expected survival is not included in the 95%CI of the observed survival, there is a statistically significant difference.
- c)
Excess mortality is the mortality that the patients of the sample show due only to the event or its consequences. In other words, it is the mortality that they would have in the theoretical assumption that they could only die from this event or its consequences. Therefore, an excess mortality of 5% indicates that 5% of the patients have died from STEMI. An excess mortality of 0% indicates that no patients have died due to the event and therefore that all deaths were from other causes. This estimation is 1 – relative survival.13,14,17,18 The relative survival is the survival in the theoretical assumption that the patients could only die from the disease. Unlike competing risk analysis, which needs to know the causes of death, the relative survival approach does not need to know the causes of death. Causes of death are unknown or unreliable in many observational studies, probably including our own. It uses the expected survival of a group of the general population matched by age, sex, and year and provides a measure of the excess mortality experienced by patients experiencing a STEMI, regardless of whether this mortality is directly or indirectly (complications of the primary PCI such as thrombosis, restenosis, etc) attributable to the STEMI.19 The system compares the incidence of death during a given year in the sample with that of the general population, taking into account that it may change from one year to another. The excess mortality is followed by its 95% confidence interval (95%CI). A statistically significant excess mortality is considered to exist when the 95%CI does not include the value 0%.
All analyses were performed with STATA v.15.1 (STATA Corp, United States). The “strs” command19 was used to calculate the observed survival, expected survival, and excess mortality.
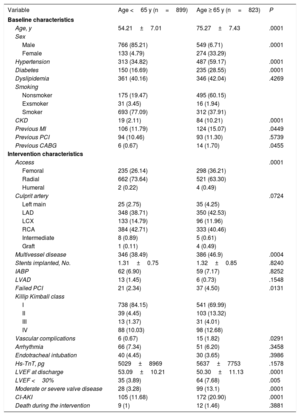
RESULTSBaseline and characteristics of the procedureDuring the study period, we included 1722 patients, 1315 (76.36%) patients were male and the mean age was 64.76±13.24 years. Patients in the group aged less than 65 years had a lower prevalence of comorbidities, with lower rates of hypertension, diabetes, dyslipidemia, chronic kidney disease, and previous coronary artery disease. Conversely, patients in the group aged 65 years and older had a lower prevalence of smoking. Details of the baseline characteristics can be seen in table 1.
Baseline characteristics and intervention characteristics
| Variable | Age <65 y (n=899) | Age ≥ 65 y (n=823) | P |
|---|---|---|---|
| Baseline characteristics | |||
| Age, y | 54.21±7.01 | 75.27±7.43 | .0001 |
| Sex | |||
| Male | 766 (85.21) | 549 (6.71) | .0001 |
| Female | 133 (4.79) | 274 (33.29) | |
| Hypertension | 313 (34.82) | 487 (59.17) | .0001 |
| Diabetes | 150 (16.69) | 235 (28.55) | .0001 |
| Dyslipidemia | 361 (40.16) | 346 (42.04) | .4269 |
| Smoking | |||
| Nonsmoker | 175 (19.47) | 495 (60.15) | |
| Exsmoker | 31 (3.45) | 16 (1.94) | |
| Smoker | 693 (77.09) | 312 (37.91) | |
| CKD | 19 (2.11) | 84 (10.21) | .0001 |
| Previous MI | 106 (11.79) | 124 (15.07) | .0449 |
| Previous PCI | 94 (10.46) | 93 (11.30) | .5739 |
| Previous CABG | 6 (0.67) | 14 (1.70) | .0455 |
| Intervention characteristics | |||
| Access | .0001 | ||
| Femoral | 235 (26.14) | 298 (36.21) | |
| Radial | 662 (73.64) | 521 (63.30) | |
| Humeral | 2 (0.22) | 4 (0.49) | |
| Culprit artery | .0724 | ||
| Left main | 25 (2.75) | 35 (4.25) | |
| LAD | 348 (38.71) | 350 (42.53) | |
| LCX | 133 (14.79) | 96 (11.96) | |
| RCA | 384 (42.71) | 333 (40.46) | |
| Intermediate | 8 (0.89) | 5 (0.61) | |
| Graft | 1 (0.11) | 4 (0.49) | |
| Multivessel disease | 346 (38.49) | 386 (46.9) | .0004 |
| Stents implanted, No. | 1.31±0.75 | 1.32±0.85 | .8240 |
| IABP | 62 (6.90) | 59 (7.17) | .8252 |
| LVAD | 13 (1.45) | 6 (0.73) | .1548 |
| Failed PCI | 21 (2.34) | 37 (4.50) | .0131 |
| Killip Kimball class | |||
| I | 738 (84.15) | 541 (69.99) | |
| II | 39 (4.45) | 103 (13.32) | |
| III | 13 (1.37) | 31 (4.01) | |
| IV | 88 (10.03) | 98 (12.68) | |
| Vascular complications | 6 (0.67) | 15 (1.82) | .0291 |
| Arrhythmia | 66 (7.34) | 51 (6.20) | .3458 |
| Endotracheal intubation | 40 (4.45) | 30 (3.65) | .3986 |
| Hs-TnT, pg | 5029±8969 | 5637±7753 | .1578 |
| LVEF at discharge | 53.09±10.21 | 50.30±11.13 | .0001 |
| LVEF <30% | 35 (3.89) | 64 (7.68) | .005 |
| Moderate or severe valve disease | 28 (3.28) | 99 (13.1) | .0001 |
| CI-AKI | 105 (11.68) | 172 (20.90) | .0001 |
| Death during the intervention | 9 (1) | 12 (1.46) | .3881 |
CABG, coronary artery bypass grafting; CI-AKI, contrast-induced acute kidney injury; CKD, chronic kidney disease; Hs-TnT, high-sensitivity troponin T; IABP, intra-aortic balloon pump; LAD, Left anterior descendant artery; LCX, left circumflex artery; LVAD, left ventricular assist device; LVEF, left ventricular ejection fraction; MI, myocardial infarction; PCI, percutaneous coronary intervention; RCA, Right coronary artery.
The data are expressed as No. (%) or mean±standard deviation.
The radial approach was the preferred vascular access in 1183 patients (68.7%). The most frequent vessel affected was the right coronary artery in 717 patients (41.64%) followed by the left anterior descending artery in 698 (40.53%) patients. Most patients presented in Killip Kimball class I, with 1279 (77.52%) patients.
There were 161 (9.35%) intraprocedural complications, 21 (1.22%) patients had vascular complications, 117 (6.79%) had arrhythmic complications, 70 (4.07%) required mechanical ventilation, and 21 (1.22%) died during the procedure. There were 146 (8.48%) deaths during admission or the first 30 days; among them, 35 patients (23.97%) had left ventricular ejection fraction <30%.
Detailed procedural and discharge data can be seen in table 1.
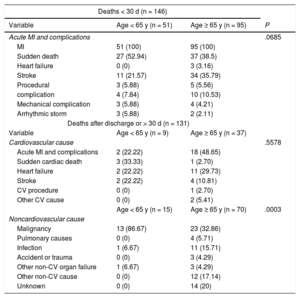
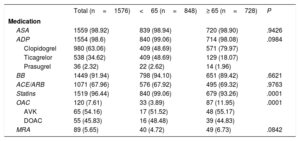
Causes of death can be consulted in table 2. Medical treatments at discharge are detailed in table 3.
Causes of death
| Deaths < 30 d (n = 146) | |||
|---|---|---|---|
| Variable | Age < 65 y (n = 51) | Age ≥ 65 y (n = 95) | P |
| Acute MI and complications | .0685 | ||
| MI | 51 (100) | 95 (100) | |
| Sudden death | 27 (52.94) | 37 (38.5) | |
| Heart failure | 0 (0) | 3 (3.16) | |
| Stroke | 11 (21.57) | 34 (35.79) | |
| Procedural | 3 (5.88) | 5 (5.56) | |
| complication | 4 (7.84) | 10 (10.53) | |
| Mechanical complication | 3 (5.88) | 4 (4.21) | |
| Arrhythmic storm | 3 (5.88) | 2 (2.11) | |
| Deaths after discharge or > 30 d (n = 131) | |||
| Variable | Age < 65 y (n = 9) | Age ≥ 65 y (n = 37) | |
| Cardiovascular cause | .5578 | ||
| Acute MI and complications | 2 (22.22) | 18 (48.65) | |
| Sudden cardiac death | 3 (33.33) | 1 (2.70) | |
| Heart failure | 2 (22.22) | 11 (29.73) | |
| Stroke | 2 (22.22) | 4 (10.81) | |
| CV procedure | 0 (0) | 1 (2.70) | |
| Other CV cause | 0 (0) | 2 (5.41) | |
| Age < 65 y (n = 15) | Age ≥ 65 y (n = 70) | .0003 | |
| Noncardiovascular cause | |||
| Malignancy | 13 (86.67) | 23 (32.86) | |
| Pulmonary causes | 0 (0) | 4 (5.71) | |
| Infection | 1 (6.67) | 11 (15.71) | |
| Accident or trauma | 0 (0) | 3 (4.29) | |
| Other non-CV organ failure | 1 (6.67) | 3 (4.29) | |
| Other non-CV cause | 0 (0) | 12 (17.14) | |
| Unknown | 0 (0) | 14 (20) | |
CV, cardiovascular; MI, myocardial infarction.
The data are expressed as No. (%).
Medication at discharge
| Total (n=1576) | <65 (n=848) | ≥ 65 (n=728) | P | |
|---|---|---|---|---|
| Medication | ||||
| ASA | 1559 (98.92) | 839 (98.94) | 720 (98.90) | .9426 |
| ADP | 1554 (98.6) | 840 (99.06) | 714 (98.08) | .0984 |
| Clopidogrel | 980 (63.06) | 409 (48.69) | 571 (79.97) | |
| Ticagrelor | 538 (34.62) | 409 (48.69) | 129 (18.07) | |
| Prasugrel | 36 (2.32) | 22 (2.62) | 14 (1.96) | |
| BB | 1449 (91.94) | 798 (94.10) | 651 (89.42) | .6621 |
| ACE/ARB | 1071 (67.96) | 576 (67.92) | 495 (69.32) | .9763 |
| Statins | 1519 (96.44) | 840 (99.06) | 679 (93.26) | .0001 |
| OAC | 120 (7.61) | 33 (3.89) | 87 (11.95) | .0001 |
| AVK | 65 (54.16) | 17 (51.52) | 48 (55.17) | |
| DOAC | 55 (45.83) | 16 (48.48) | 39 (44.83) | |
| MRA | 89 (5.65) | 40 (4.72) | 49 (6.73) | .0842 |
ACE, angiotensin converting enzyme inhibitors; ADP, adenosine diphosphate receptor antagonists; ARB, angiotensin II receptor blockers; ASA, acetylsalicylic acid; AVK, anti-Vitamin K; BB, beta-blockers; DOAC, direct oral anticoagulants; MRA, mineralocorticoid receptor antagonists; OAC, oral anticoagulants.
The data are expressed as No. (%).
There were 899 (52.21%) patients younger than 65 years. The mean age was 54.21±7.01 years and 133 (14.79%) were women. Mean follow-up of the censored observations was 34.89±20.84 months. Minimum and maximum follow-up was 1.38 and 72.15 months. There were 75 (9.11%) deaths. Causes of death can be consulted in table 2.
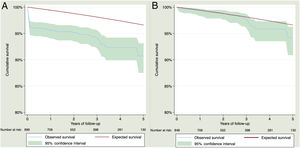
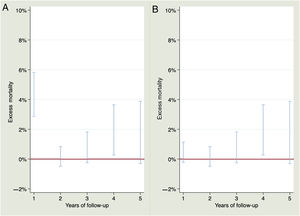
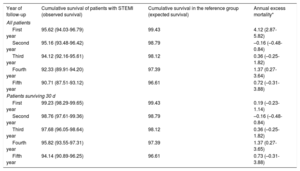
Observed survival at 1, 2, 3, 4 and 5 years of follow-up was 95.62% (95%CI, 94.03%-96.79%), 95.16% (95%CI, 93.48%-96.42%), 94.12% (95%CI, 92.16%-95.61%), 92.33% (95%CI, 89.91%-94.20%) and 90.71% (95%CI, 87.51%-93.12%) while expected survival was 99.43%, 98.79%, 98.12%, 97.39% and 96.61%. Observed and expected survival curves can be consulted in figure 1A. There was statistically significant excess mortality during the first year of 4.12% (95%CI, 2.87%-5.82%). For the second year, there was no excess mortality –0.16% (95%CI, –0.48-0.84%). For the third, fourth and fifth years of follow-up, the excess mortality was 0.36% (95%CI, –0.25%-1.82%), 1.37% (95%CI, 0.27%-3.64%) and 0.72% (95%CI, –0.31%-3.88%), respectively. A visual representation of the excess mortality can be consulted in figure 2A.


For patients who survived 30 days after STEMI, observed survival at 1, 2, 3, 4 and 5 years of follow-up was 99.23% (95%CI, 98.29%-99.65%), 98.76% (95%CI, 97.61%-99.36%), 97.68% (95%CI, 96.05%-98.64%), 95.82% (95%CI, 93.55%-97.31%), and 94.14% (95%CI, 90.89%-96.25%), respectively. Expected survival for 1, 2, 3, 4 and 5 years was 99.43%, 98.79%, 98.12%, 97.39%, and 96.61%, respectively. Observed and expected survival curves can be consulted in figure 1B. The excess mortality during the first year disappeared 0.19% (95%CI, –0.23%-1.14%). For the second, third, fourth and fifth year of follow-up, there was no excess of mortality, –0.16% (95%CI, –0.48%-0.84%), 0.36% (95%CI, –0.25%-1.82%), 1.37% (95%CI, 0.27%-3.65%) and 0.73% (95%CI, –0.31%-3.88%), respectively. A visual representation of the excess mortality can be consulted in figure 2B.
Table 4 shows observed survival, expected survival and annual excess mortality for patients younger than 65 years after STEMI.
Observed and expected survival during the follow-up of patients younger than 65 years. Excess mortality by annual intervals are also calculated
| Year of follow-up | Cumulative survival of patients with STEMI (observed survival) | Cumulative survival in the reference group (expected survival) | Annual excess mortality* |
|---|---|---|---|
| All patients | |||
| First year | 95.62 (94.03-96.79) | 99.43 | 4.12 (2.87-5.82) |
| Second year | 95.16 (93.48-96.42) | 98.79 | –0.16 (–0.48-0.84) |
| Third year | 94.12 (92.16-95.61) | 98.12 | 0.36 (–0.25-1.82) |
| Fourth year | 92.33 (89.91-94.20) | 97.39 | 1.37 (0.27-3.64) |
| Fifth year | 90.71 (87.51-93.12) | 96.61 | 0.72 (–0.31-3.88) |
| Patients surviving 30 d | |||
| First year | 99.23 (98.29-99.65) | 99.43 | 0.19 (–0.23-1.14) |
| Second year | 98.76 (97.61-99.36) | 98.79 | –0.16 (–0.48-0.84) |
| Third year | 97.68 (96.05-98.64) | 98.12 | 0.36 (–0.25-1.82) |
| Fourth year | 95.82 (93.55-97.31) | 97.39 | 1.37 (0.27-3.65) |
| Fifth year | 94.14 (90.89-96.25) | 96.61 | 0.73 (–0.31-3.88) |
STEMI, ST-segment elevation myocardial infarction.
The data are expressed as percentage (95%CI).
There were 823 (47.79%) patients older than 65 years. The mean age was 75.27±7.43 years and 274 (33.29%) were women. Mean follow-up of censored observations was 34.27±21.06 months. Minimum and maximum follow-up was 1.58 and 72.28 months. There were 202 (24.54%) deaths. Causes of death can be consulted in table 2.
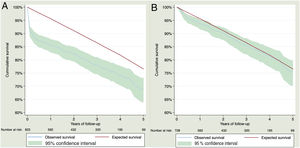
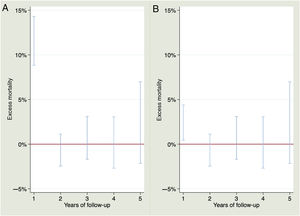
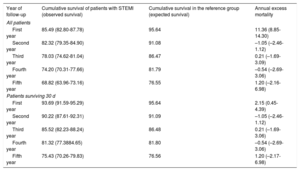
Observed survival at 1, 2, 3, 4 and 5 years of follow-up was 85.49% (95%CI, 82.80%-87.78%), 82.32% (95%CI, 79.35%-84.90%), 78.03% (95%CI, 74.62%-81.04%), 74.20% (95%CI, 70.31%-77.66%), and 68.82% (95%CI, 63.96%-73.16%), while expected survival was 95.64%, 91.08%, 86.47%, 81.79%, and 76.55%%. Observed and expected survival curves can be consulted in figure 3A. There was an excess mortality of 11.36% (95%CI, 8.85%-14.30%). There was no excess mortality for the rest of the years. For the second, third, fourth and fifth years of follow-up, the excess mortality was –1.05% (95%CI, –2.46%-1.12%), 0.21% (95%CI, –1.69%-3.09%), –0.54% (95%CI, –2.69%-3.06%) and 1.20% (95%CI, –2.16%-6.98%), respectively. A visual representation of the excess of mortality can be consulted in the figure 4A.


For patients who survived 30 days after the STEMI, observed survival at 1, 2, 3, 4 and 5 years of follow-up was 93.69% (95%CI, 91.59%-95.29%), 90.22% (95%CI, 87.61%-92.31%), 85.52% (95%CI, 82.23%-88.24%), 81.32% (95%CI, 77.38%-84.65%) and 75.43% (95%CI, 70.26%-79.83%), respectively. Expected survival for 1, 2, 3, 4 and 5 years was 95.64%, 91.09%, 86.48%, 81.80%, and 76.56%, respectively. Observed and expected survival curves can be consulted in figure 4A. The excess mortality during the first year was low but did not disappear, being 2.15% (95%CI, 0.45%-4.39%). For the second, third, fourth and fifth year of follow-up, there was no excess mortality, –1.05% (95%CI, –2.46%-1.12%), 0.21% (95%CI, –1.69%-3.06%), –0.54% (95%CI, –2.69%-3.06%) and 1.20% (95%CI, –2.17%-6.98%), respectively. A visual representation of the excess mortality can be consulted in figure 4B.
Table 5 shows observed survival, expected survival and annual excess mortality for patients ≥ 65 years after STEMI.
Observed and expected survival for patients 65 years or older. Excess mortality by annual intervals are also calculated
| Year of follow-up | Cumulative survival of patients with STEMI (observed survival) | Cumulative survival in the reference group (expected survival) | Annual excess mortality |
|---|---|---|---|
| All patients | |||
| First year | 85.49 (82.80-87.78) | 95.64 | 11.36 (8.85-14.30) |
| Second year | 82.32 (79.35-84.90) | 91.08 | –1.05 (–2.46-1.12) |
| Third year | 78.03 (74.62-81.04) | 86.47 | 0.21 (–1.69-3.09) |
| Fourth year | 74.20 (70.31-77.66) | 81.79 | –0.54 (–2.69-3.06) |
| Fifth year | 68.82 (63.96-73.16) | 76.55 | 1.20 (–2.16-6.98) |
| Patients surviving 30 d | |||
| First year | 93.69 (91.59-95.29) | 95.64 | 2.15 (0.45-4.39) |
| Second year | 90.22 (87.61-92.31) | 91.09 | –1.05 (–2.46-1.12) |
| Third year | 85.52 (82.23-88.24) | 86.48 | 0.21 (–1.69-3.06) |
| Fourth year | 81.32 (77.3884.65) | 81.80 | –0.54 (–2.69-3.06) |
| Fifth year | 75.43 (70.26-79.83) | 76.56 | 1.20 (–2.17-6.98) |
STEMI, ST-segment elevation myocardial infarctions. The data are expressed as percentage (95%CI).
There were 303 (17.60%) patients older than 80 years. The mean age was 84.75±3.67 years. Observed survival at 1, 2, 3, 4 and 5 years was 78.30 (95%CI, 73.03%-82.66%), 72.79% (95%CI, 66.97%-77.76%), 67.10% (95%CI, 60.68%-72.71%), 60.53% (95%CI, 53.37%-66.94%), and 53.82% (95%CI, 45.59%-61.35%), respectively. Expected survival was 91.58%, 83.01%, 75.04%, 67.41%, and 59.35%).
Excess mortality during the first year was 15.65% (95%CI, 10.70%-21.61%) but disappeared for the rest of the years. For the second, third, fourth and fifth year of follow-up, the excess mortality was –2.67% (95%CI, –5.95%-2.86%), –2.39% (95%CI, –6.18%-4.31%), –0.46% (95%CI, –5.49%-8.54%), and –0.52% (95%CI, –7.47%-13.38%).
DISCUSSIONThe main finding of SurviSTEMI study was that patients aged 65 years and older had a significant risk of death during the first 30 days after STEMI. Nevertheless, patients surviving the first year enjoyed a life expectancy similar to that of the general population of the same age, sex, and geographical region. Young patients (younger than 65 years) had a lower risk during the first 30 days. However, these patients maintained a small risk of death during the years following the STEMI.
Many studies have analyzed the effect of age on the long-term survival of patients experiencing a STEMI. The roles of emergent revascularization and intense secondary prevention therapies in improving survival have also been extensively investigated.3,19–22 Our study provides additional and original information on this setting, as to date, it has been unknown whether long-term mortality of these patients remains elevated compared with that of the general population after the initial critical period.
We took advantage of a large cohort of STEMI patients treated in an experienced center, which is the referral center of the region. To directly compare their life expectancy with that of the general population, we used data provided by the Spanish National Statistics Institute, matching by the same age, sex, and geographical region.11 Our series shows a real-life cohort of STEMI patients treated with primary PCI at a high-volume center by experienced operators and with high rate of guideline-directed secondary prevention treatments.3,21,22
Patients younger than 65 yearsFor patients younger than 65 years who experienced a STEMI and underwent primary PCI, there was excess mortality, mainly during the first year. During this year, almost 5% of the patients died due to the event or its consequences, mainly within the first 30 days after the event. These data are in consonance with those reported in randomized clinical trials and large national contemporary registries.23,24 In young patients, 30-day mortality is the most influential factor in long-term outcomes. After the first year, our study showed a trend toward excess mortality but it was much lower. The excess mortality for these years was less than 1.5%. Interestingly, despite the excess mortality in young patients during the first month after the STEMI, if these patients survived this initial period, the excess mortality in the first year disappeared and the observed and expected survival curves were similar. Therefore, the life expectancy of patients surviving the first 30 days was similar to that of the general population of the same age, sex, and geographical region. Only a few reports have compared long-term survival of young patients after a myocardial infarction with that of the general population. Whereas our study assessed STEMI patients, previous studies included not only STEMI but also non-STEMI patients. This is very relevant when analyzing long-term outcomes because of the different prognosis of the 2 entities.25–27
Because of the long-life expectancy of young patients, direct comparison with the general population is highly relevant. The impact of a potentially fatal event such as a STEMI in a young patient has severe consequences in terms of potential years of life lost. The potential recovery of life expectancy in young patients surviving the first year, emphasizes the relevance of new treatments for secondary prevention.
Patients older than 65 yearsDespite undergoing primary PCI, patients older than 65 years with a STEMI had high mortality (more than 10%) due to the event during the first year. However, there was no excess mortality during the remaining years. This excess of mortality during the first year did not disappear but it was highly reduced for patients who survived the first 30 days after the STEMI. Observed and expected survival became similar after the second year of follow-up.
Little is known regarding the long-term outcomes in elderly people after a STEMI because the underrepresentation of this group of patients in randomized clinical trials and the lack of data regarding long-term observational studies.3 High mortality rates during the first year after myocardial infarction was reported by Kochar et al., in a series of STEMI and non-STEMI patients with an indirect comparison with general population without matching. This study showed a significant excess of mortality in these patients when comparing with the general population with an impaired survival of up to 10 years in 65-69 year-old patients. In a very similar way to our data, when the sample was divided, STEMI patients showed a mortality rate of 30% at 5 years of follow-up.9
Patients older than 80 yearsOutcomes of very elderly patients (older than 80 years) were fairly similar to those of patients older than 65 years. With an excess mortality of more than 15%, the event had a strong impact during the first year. However, after the first year, the risk of death was similar to that of the general population of the same age and sex. De la Torre et al.28 reported a 30-day and 2-year mortality of 12.2% and 24.2%, respectively, in patients older than 75 years with STEMI treated with primary PCI. Mortality in very elderly patients (octogenarians and nonagenarians) after a STEMI was reported by Antonsen. et al., 29 with rates of about 18% during the first month, 27% in the first year, and 41% during the following 5 years. However, our study is the first to perform a direct comparison with the general population.
LimitationsThis is a retrospective analysis with the limitations inherent to an observational single-center study, limited to a single geographical area. Because we recruited patients until March 2020, the minimum value of follow-up is low, translating into high dispersion.
CONCLUSIONSCurrently, patients with STEMI still have a reduced life expectancy. The life expectancy of these patients depends mainly on their chances of survival during the first 30 days. Observed and expected survival of patients surviving this period are fairly similar to those of participants of the same age, sex, and geographical area.
Despite recent advances in primary PCI, patients younger than 65 years have an excess mortality of almost 5% during the first year. For the following years, mortality due to the event is much lower but does not completely disappear. In patients older than 65 years, excess mortality is more than double that of younger patients during the first year, around 10%. However, in the following years, the risk of death is similar to that of the general population.
CONFLICTS OF INTERESTThe authors declare no conflicts of interest.
- –
Treatment and secondary prevention measures after STEMI are continuously being improved.
- –
Patients older than 65 years are an identified group with a high risk of short- and long-term mortality after experiencing this event.
- –
Elderly patients have a significant risk of death during the first 30 days after the event. Currently, patients surviving the first year enjoy a life expectancy similar to that of the general population of the same age, sex, and geographical region.
- –
Young patients have a lower risk during the first 30 days. However, these patients maintain a small risk of death during the years following the STEMI.