This article presents the data corresponding to automated implantable cardioverter-defibrillator (ICD) implants in Spain reported to the Spanish Registry in 2018.
MethodsThe data in this registry include both primary implants and generator replacements and were gathered from a data collection sheet voluntarily completed by implantation centers.
ResultsIn 2018, 6421 implant sheets were received compared with 7077 reported by Eucomed (European Confederation of Medical Suppliers Associations). This represents data on 90.7% of the devices implanted in Spain. Compliance ranged between 99.6% for the field “name of the implanting hospital” and 12.4% for “population of residence”. A total of 173 hospitals reported their data to the registry, representing a slight decrease compared with hospitals participating in 2017 (n=181).
ConclusionsAfter the reduction in ICD implants in 2017, the number of implants increased in 2018, with the highest number of ICDs implanted in Spain. The total number of implants remains much lower than the European Union average, with substantial differences between autonomous communities.
Keywords
Implantable cardioverter-defibrillator (ICD) placement is a highly effective treatment for controlling ventricular arrhythmias and the most effective treatment for preventing sudden cardiac death. ICDs continually monitor cardiac rhythm and administer a shock upon detection of tachycardia meeting the established heart rate and duration criteria. Various clinical practice guidelines list the indications for ICD therapy in patients with ventricular arrhythmias or at risk of developing them and include both primary and secondary prevention measures for sudden cardiac death.1–3 Sudden cardiac death has a huge socioeconomic impact. Although its current incidence in Spain is unknown, the estimated incidence in Europe is 400 000 deaths per year,4 with 40% occurring in individuals younger than 65 years.
The Electrophysiology and Arrhythmias Section of the Spanish Society of Cardiology (SEC) has published the Spanish Implantable Cardioverter-defibrillator Registry since 2005.5–7 This report presents the data on ICD implantation corresponding to 2018. Most Spanish centers implanting ICDs have contributed to the registry. As in other years, this article reviews the patients’ indications and clinical characteristics, implantation data, device type and programming, and procedure-related complications.
METHODSThe registry is based on information voluntarily collected by the participating centers during device implantation and concerns both first implantations and replacements. The information was entered in a database by a team comprising a technician, a SEC computer scientist, and a member of the Electrophysiology and Arrhythmias Section of the SEC. Data cleaning was performed by the technician and the first author, and all authors of this article analyzed the data and are responsible for this publication.
The census data for the calculation of rates, both national and by autonomous community and province, were obtained from the Spanish National Institute of Statistics as of January 1, 2019.8 The data from the present registry were compared with those provided by the European Confederation of Medical Suppliers Associations (Eucomed).
The percentages of each of the variables analyzed were calculated by taking into account the total number of implantations with available information on the parameter. Only the most serious condition was included if various types of arrhythmias were recorded.
Statistical AnalysisResults are expressed as mean±standard deviation or median [interquartile range], depending on the distribution of the variable. Continuous quantitative variables were analyzed using analysis of variance or the Kruskal-Wallis test, while qualitative variables were analyzed using the chi-square test. Linear regression models were used to analyze the number of implantations and devices implanted per million population, the total number of implantations, and the number of implantations for primary prevention in each center.
RESULTSA total of 6421 implantation forms were received but 7077 procedures were reported by Eucomed; hence, data were collected on 90.7% of devices implanted in Spain. Compliance ranged from 99.6% for the field name of implantation hospital to 12.4% for the variable town of residence.
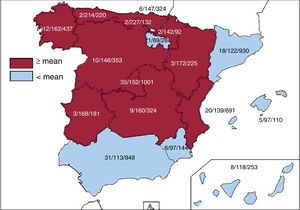
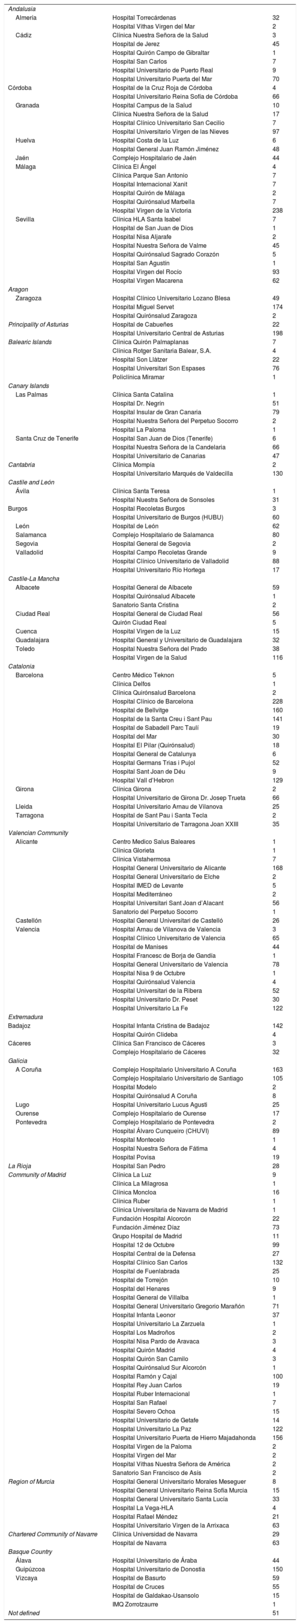
Implantation CentersIn total, 173 hospitals participated, which is a slight decrease vs 2017 (181). Data from the 173 hospitals are shown in table 1; 77 were publicly-funded health centers. Figure 1 shows the total number of implantation centers, the rate per million population, and the total number of implantations per autonomous community. In 2018, 19 centers implanted ≥ 100 devices; 82, ≤ 10; and 23, only 1.
Implantations by Autonomous Community, Province, and Hospital
| Andalusia | ||
| Almería | Hospital Torrecárdenas | 32 |
| Hospital Vithas Virgen del Mar | 2 | |
| Cádiz | Clínica Nuestra Señora de la Salud | 3 |
| Hospital de Jerez | 45 | |
| Hospital Quirón Campo de Gibraltar | 1 | |
| Hospital San Carlos | 7 | |
| Hospital Universitario de Puerto Real | 9 | |
| Hospital Universitario Puerta del Mar | 70 | |
| Córdoba | Hospital de la Cruz Roja de Córdoba | 4 |
| Hospital Universitario Reina Sofía de Córdoba | 66 | |
| Granada | Hospital Campus de la Salud | 10 |
| Clínica Nuestra Señora de la Salud | 17 | |
| Hospital Clínico Universitario San Cecilio | 7 | |
| Hospital Universitario Virgen de las Nieves | 97 | |
| Huelva | Hospital Costa de la Luz | 6 |
| Hospital General Juan Ramón Jiménez | 48 | |
| Jaén | Complejo Hospitalario de Jaén | 44 |
| Málaga | Clínica El Ángel | 4 |
| Clínica Parque San Antonio | 7 | |
| Hospital Internacional Xanit | 7 | |
| Hospital Quirón de Málaga | 2 | |
| Hospital Quirónsalud Marbella | 7 | |
| Hospital Virgen de la Victoria | 238 | |
| Sevilla | Clínica HLA Santa Isabel | 7 |
| Hospital de San Juan de Dios | 1 | |
| Hospital Nisa Aljarafe | 2 | |
| Hospital Nuestra Señora de Valme | 45 | |
| Hospital Quirónsalud Sagrado Corazón | 5 | |
| Hospital San Agustín | 1 | |
| Hospital Virgen del Rocío | 93 | |
| Hospital Virgen Macarena | 62 | |
| Aragon | ||
| Zaragoza | Hospital Clínico Universitario Lozano Blesa | 49 |
| Hospital Miguel Servet | 174 | |
| Hospital Quirónsalud Zaragoza | 2 | |
| Principality of Asturias | Hospital de Cabueñes | 22 |
| Hospital Universitario Central de Asturias | 198 | |
| Balearic Islands | Clinica Quirón Palmaplanas | 7 |
| Clínica Rotger Sanitaria Balear, S.A. | 4 | |
| Hospital Son Llàtzer | 22 | |
| Hospital Universitari Son Espases | 76 | |
| Policlínica Miramar | 1 | |
| Canary Islands | ||
| Las Palmas | Clínica Santa Catalina | 1 |
| Hospital Dr. Negrín | 51 | |
| Hospital Insular de Gran Canaria | 79 | |
| Hospital Nuestra Señora del Perpetuo Socorro | 2 | |
| Hospital La Paloma | 1 | |
| Santa Cruz de Tenerife | Hospital San Juan de Dios (Tenerife) | 6 |
| Hospital Nuestra Señora de la Candelaria | 66 | |
| Hospital Universitario de Canarias | 47 | |
| Cantabria | Clínica Mompía | 2 |
| Hospital Universitario Marqués de Valdecilla | 130 | |
| Castile and León | ||
| Ávila | Clínica Santa Teresa | 1 |
| Hospital Nuestra Señora de Sonsoles | 31 | |
| Burgos | Hospital Recoletas Burgos | 3 |
| Hospital Universitario de Burgos (HUBU) | 60 | |
| León | Hospital de León | 62 |
| Salamanca | Complejo Hospitalario de Salamanca | 80 |
| Segovia | Hospital General de Segovia | 2 |
| Valladolid | Hospital Campo Recoletas Grande | 9 |
| Hospital Clínico Universitario de Valladolid | 88 | |
| Hospital Universitario Río Hortega | 17 | |
| Castile-La Mancha | ||
| Albacete | Hospital General de Albacete | 59 |
| Hospital Quirónsalud Albacete | 1 | |
| Sanatorio Santa Cristina | 2 | |
| Ciudad Real | Hospital General de Ciudad Real | 56 |
| Quirón Ciudad Real | 5 | |
| Cuenca | Hospital Virgen de la Luz | 15 |
| Guadalajara | Hospital General y Universitario de Guadalajara | 32 |
| Toledo | Hospital Nuestra Señora del Prado | 38 |
| Hospital Virgen de la Salud | 116 | |
| Catalonia | ||
| Barcelona | Centro Médico Teknon | 5 |
| Clínica Delfos | 1 | |
| Clínica Quirónsalud Barcelona | 2 | |
| Hospital Clínico de Barcelona | 228 | |
| Hospital de Bellvitge | 160 | |
| Hospital de la Santa Creu i Sant Pau | 141 | |
| Hospital de Sabadell Parc Taulí | 19 | |
| Hospital del Mar | 30 | |
| Hospital El Pilar (Quirónsalud) | 18 | |
| Hospital General de Catalunya | 6 | |
| Hospital Germans Trias i Pujol | 52 | |
| Hospital Sant Joan de Déu | 9 | |
| Hospital Vall d’Hebron | 129 | |
| Girona | Clínica Girona | 2 |
| Hospital Universitario de Girona Dr. Josep Trueta | 66 | |
| Lleida | Hospital Universitario Arnau de Vilanova | 25 |
| Tarragona | Hospital de Sant Pau i Santa Tecla | 2 |
| Hospital Universitario de Tarragona Joan XXIII | 35 | |
| Valencian Community | ||
| Alicante | Centro Medico Salus Baleares | 1 |
| Clínica Glorieta | 1 | |
| Clínica Vistahermosa | 7 | |
| Hospital General Universitario de Alicante | 168 | |
| Hospital General Universitario de Elche | 2 | |
| Hospital IMED de Levante | 5 | |
| Hospital Mediterráneo | 2 | |
| Hospital Universitari Sant Joan d’Alacant | 56 | |
| Sanatorio del Perpetuo Socorro | 1 | |
| Castellón | Hospital General Universitari de Castelló | 26 |
| Valencia | Hospital Arnau de Vilanova de Valencia | 3 |
| Hospital Clínico Universitario de Valencia | 65 | |
| Hospital de Manises | 44 | |
| Hospital Francesc de Borja de Gandía | 1 | |
| Hospital General Universitario de Valencia | 78 | |
| Hospital Nisa 9 de Octubre | 1 | |
| Hospital Quirónsalud Valencia | 4 | |
| Hospital Universitari de la Ribera | 52 | |
| Hospital Universitario Dr. Peset | 30 | |
| Hospital Universitario La Fe | 122 | |
| Extremadura | ||
| Badajoz | Hospital Infanta Cristina de Badajoz | 142 |
| Hospital Quirón Clideba | 4 | |
| Cáceres | Clínica San Francisco de Cáceres | 3 |
| Complejo Hospitalario de Cáceres | 32 | |
| Galicia | ||
| A Coruña | Complejo Hospitalario Universitario A Coruña | 163 |
| Complejo Hospitalario Universitario de Santiago | 105 | |
| Hospital Modelo | 2 | |
| Hospital Quirónsalud A Coruña | 8 | |
| Lugo | Hospital Universitario Lucus Agusti | 25 |
| Ourense | Complejo Hospitalario de Ourense | 17 |
| Pontevedra | Complejo Hospitalario de Pontevedra | 2 |
| Hospital Álvaro Cunqueiro (CHUVI) | 89 | |
| Hospital Montecelo | 1 | |
| Hospital Nuestra Señora de Fátima | 4 | |
| Hospital Povisa | 19 | |
| La Rioja | Hospital San Pedro | 28 |
| Community of Madrid | Clínica La Luz | 9 |
| Clínica La Milagrosa | 1 | |
| Clínica Moncloa | 16 | |
| Clínica Ruber | 1 | |
| Clínica Universitaria de Navarra de Madrid | 1 | |
| Fundación Hospital Alcorcón | 22 | |
| Fundación Jiménez Díaz | 73 | |
| Grupo Hospital de Madrid | 11 | |
| Hospital 12 de Octubre | 99 | |
| Hospital Central de la Defensa | 27 | |
| Hospital Clínico San Carlos | 132 | |
| Hospital de Fuenlabrada | 25 | |
| Hospital de Torrejón | 10 | |
| Hospital del Henares | 9 | |
| Hospital General de Villalba | 1 | |
| Hospital General Universitario Gregorio Marañón | 71 | |
| Hospital Infanta Leonor | 37 | |
| Hospital Universitario La Zarzuela | 1 | |
| Hospital Los Madroños | 2 | |
| Hospital Nisa Pardo de Aravaca | 3 | |
| Hospital Quirón Madrid | 4 | |
| Hospital Quirón San Camilo | 3 | |
| Hospital Quirónsalud Sur Alcorcón | 1 | |
| Hospital Ramón y Cajal | 100 | |
| Hospital Rey Juan Carlos | 19 | |
| Hospital Ruber Internacional | 1 | |
| Hospital San Rafael | 7 | |
| Hospital Severo Ochoa | 15 | |
| Hospital Universitario de Getafe | 14 | |
| Hospital Universitario La Paz | 122 | |
| Hospital Universitario Puerta de Hierro Majadahonda | 156 | |
| Hospital Virgen de la Paloma | 2 | |
| Hospital Virgen del Mar | 2 | |
| Hospital Vithas Nuestra Señora de América | 2 | |
| Sanatorio San Francisco de Asís | 2 | |
| Region of Murcia | Hospital General Universitario Morales Meseguer | 8 |
| Hospital General Universitario Reina Sofía Murcia | 15 | |
| Hospital General Universitario Santa Lucía | 33 | |
| Hospital La Vega-HLA | 4 | |
| Hospital Rafael Méndez | 21 | |
| Hospital Universitario Virgen de la Arrixaca | 63 | |
| Chartered Community of Navarre | Clínica Universidad de Navarra | 29 |
| Hospital de Navarra | 63 | |
| Basque Country | ||
| Álava | Hospital Universitario de Áraba | 44 |
| Guipúzcoa | Hospital Universitario de Donostia | 150 |
| Vizcaya | Hospital de Basurto | 59 |
| Hospital de Cruces | 55 | |
| Hospital de Galdakao-Usansolo | 15 | |
| IMQ Zorrotzaurre | 1 | |
| Not defined | 51 | |

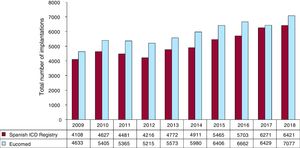
In 2018, the total number of implantations (first and replacements) was 6421, representing an increase vs 2017 (6273). The total number of implantations reported to the registry and those estimated by Eucomed in the last 10 years are shown in figure 2. The data for 2018 show a marked increase in the number of ICD implantations in Spain vs the previous year (7077 in 2018 and 6429 in 2017 according to Eucomed data).

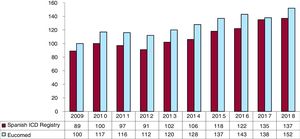
The overall implantation rate was 137/million population for the registry but 152/million population according to Eucomed data. This figure is similar to that of the previous year (135/million population in 2017) but much lower than the mean ICD implantation rate in Europe (306/million population in 2018); nonetheless, the rate in Europe has fallen for the first time. Changes in the implantation rate per million population during the last 10 years according to registry and Eucomed data are shown in figure 3.

The name of the hospital performing the procedure was recorded in 99.6% of forms (table 1). Most procedures (5693, 92%) were performed in publicly-funded health centers.
First Implantations vs ReplacementsThis information was available in 5451 forms (83%). First implantations comprised 3899, representing 71.5% of the total (71.4% in 2017, 66.8% in 2016, 71.8% in 2015, and 72.6% in 2014). The rate of first implantations per million population was 83.4 (76.5 in 2017, 65.5 in 2016, 75.1 in 2015, and 79.0 in 2014).
Age and SexThe mean age of all patients was 62.4±13.55 (7-97) years in 2018 vs 62.6±13.4 (6-90) years in 2017, 62.7±13.4 (6-90) years in 2016, 62.8±13.3 (6-89) years in 2015, and 61.8±13.7 (7-94) years in 2014. The mean patient age was 61.2±13.3 years for first implantations. Most patients were men: they represented 82.0% of all patients and 82.4% of first implantation patients.
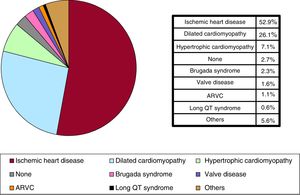
Underlying Heart Disease, Left Ventricular Ejection Fraction, Functional Class, and Baseline RhythmThe most frequent underlying cardiac condition in first implantation patients was ischemic heart disease (52.9%), followed by dilated cardiomyopathy (26.1%), hypertrophy (7.1%), primary conduction abnormalities (Brugada syndrome and long QT syndrome) (2.9%), valve diseases (1.6%), and arrhythmogenic right ventricular cardiomyopathy (1.1%) (figure 4).
. ARVC, arrhythmogenic right ventricular cardiomyopathy; Others, patients with more than 1 diagnosis.")
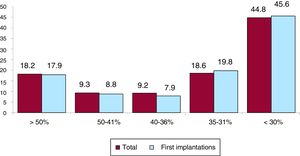
Systolic function data were provided in 66.5% of forms. In this group, left ventricular ejection fraction was> 50% in 18.2% of patients, from 41% to 50% in 9.3%, from 36% to 40% in 9.2%, from 31% to 35% in 18.6%, and ≤ 30% in 44.8% (figure 5). The distribution was similar when it was grouped by first implantations and by replacements.
.")
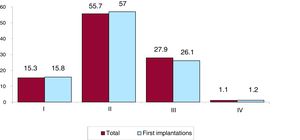
The New York Heart Association (NYHA) functional class was recorded in 45.2% of forms. Most patients were in NYHA class II (55.7%), followed by NYHA III (27.9%), NYHA I (15.3%), and NYHA IV (1.1%). The distribution for this variable was also similar in the overall and first implantation groups (figure 6).

Based on data from 69.4% of forms, the baseline cardiac rhythm was primarily sinus rhythm (77.1%), followed by atrial fibrillation (18.0%) and pacemaker rhythm (4.4%). The remaining patients had other rhythms (eg, atrial flutter and other arrhythmias).
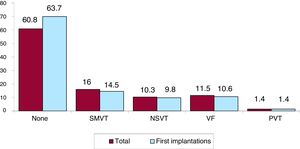
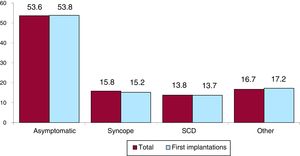
Clinical Arrhythmia Prompting Implantation, Its Form of Presentation, and the Arrhythmia Induced in the Electrophysiological StudyThe clinical arrhythmia prompting device implantation was reported in 69.9% of forms submitted to the registry. For first implantations, most patients had no documented clinical arrhythmia (63.7%), while 14.5% showed sustained monomorphic ventricular tachycardia, 9.8% had nonsustained ventricular tachycardia, and 10.6% had ventricular fibrillation. In total, patients with no documented clinical arrhythmia comprised 63.7% (figure 7). The most frequent presentation in both the total implantation group and the first implantation patients (56.1% of completed responses) was asymptomatic, followed by syncope, sudden cardiac death, and other symptoms (figure 8).
. NSVT, nonsustained ventricular tachycardia; PVT, polymorphic ventricular tachycardia; SMVT, sustained monomorphic ventricular tachycardia; VF, ventricular fibrillation.")
. SCD, sudden cardiac death.")
Information on the electrophysiological studies performed was provided in 57.5% of forms. These studies were carried out in 312 patients (8.5%), mainly those with ischemic heart disease and dilated cardiomyopathy, and in 33.5% of patients with Brugada syndrome. Sustained monomorphic ventricular tachycardia was the most common induced arrhythmia (27.6%), followed by nonsustained ventricular tachycardia (16.8%), ventricular fibrillation (14.1%), and, to a lesser extent, other arrhythmias (4.6%). No arrhythmia was induced in 36.9% of the electrophysiological studies.
Clinical HistoryInformation on clinical history was provided in 38.6% of forms. Hypertension was present in 57% of patients, as well as hypercholesterolemia in 48%, smoking in 35%, diabetes mellitus in 30%, history of atrial fibrillation in 27%, family history of sudden cardiac death in 9%, renal failure in 15%, and history of stroke in 6%.
The QRS interval was reported for 43.5% of first implantations (mean, 124ms). In 39% of the patients, it was> 140ms, and 88.7% of these patients had a resynchronization-defibrillator device (ICD-cardiac resynchronization therapy [CRT]).
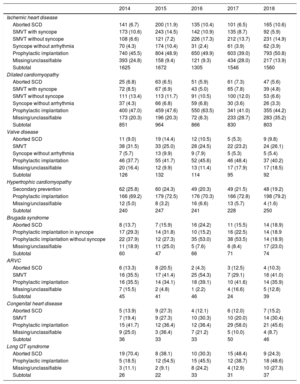
IndicationsDevice indications in recent years are shown in table 2. These data were provided in 62.6% of forms in 2018. Ischemic heart disease was the most frequent reason for ICD implantation, accounting for 53.8% of first implantations in 2018. Among ischemic heart disease patients, the most common indication was primary prevention (39%). The second most common reason was dilated cardiomyopathy (29% of all first implantations). For the less common heart diseases, the most frequent indication was primary prevention.
Number of First Implantations According to Type of Heart Disease, Type of Clinical Arrhythmia, and Form of Presentation From 2014 to 2018
| 2014 | 2015 | 2016 | 2017 | 2018 | |
|---|---|---|---|---|---|
| Ischemic heart disease | |||||
| Aborted SCD | 141 (6.7) | 200 (11.9) | 135 (10.4) | 101 (6.5) | 165 (10.6) |
| SMVT with syncope | 173 (10.6) | 243 (14.5) | 142 (10.9) | 135 (8.7) | 92 (5.9) |
| SMVT without syncope | 108 (6.6) | 121 (7.2) | 226 (17.3) | 212 (13.7) | 231 (14.9) |
| Syncope without arrhythmia | 70 (4.3) | 174 (10.4) | 31 (2.4) | 61 (3.9) | 62 (3.9) |
| Prophylactic implantation | 740 (45.5) | 804 (48.9) | 650 (49.9) | 603 (39.0) | 793 (50.8) |
| Missing/unclassifiable | 393 (24.8) | 158 (9.4) | 121 (9.3) | 434 (28.0) | 217 (13.9) |
| Subtotal | 1625 | 1672 | 1305 | 1546 | 1560 |
| Dilated cardiomyopathy | |||||
| Aborted SCD | 25 (6.8) | 63 (6.5) | 51 (5.9) | 61 (7.3) | 47 (5.6) |
| SMVT with syncope | 72 (8.5) | 67 (6.9) | 43 (5.0) | 65 (7.8) | 39 (4.8) |
| SMVT without syncope | 111 (13.4) | 113 (11.7) | 91 (10.5) | 100 (12.0) | 53 (6.6) |
| Syncope without arrhythmia | 37 (4.3) | 66 (6.8) | 59 (6.8) | 30 (3.6) | 26 (3.3) |
| Prophylactic implantation | 400 (47.0) | 459 (47.6) | 550 (63.5) | 341 (41.0) | 355 (44.2) |
| Missing/unclassifiable | 173 (20.3) | 196 (20.3) | 72 (8.3) | 233 (28.7) | 283 (35.2) |
| Subtotal | 851 | 964 | 866 | 830 | 803 |
| Valve disease | |||||
| Aborted SCD | 11 (9.0) | 19 (14.4) | 12 (10.5) | 5 (5.3) | 9 (9.8) |
| SMVT | 38 (31.5) | 33 (25.0) | 28 (24.5) | 22 (23.2) | 24 (26.1) |
| Syncope without arrhythmia | 7 (5.7) | 13 (9.9) | 9 (7.9) | 5 (5.3) | 5 (5.4) |
| Prophylactic implantation | 46 (37.7) | 55 (41.7) | 52 (45.6) | 46 (48.4) | 37 (40.2) |
| Missing/unclassifiable | 20 (16.4) | 12 (9.9) | 13 (11.4) | 17 (17.9) | 17 (18.5) |
| Subtotal | 126 | 132 | 114 | 95 | 92 |
| Hypertrophic cardiomyopathy | |||||
| Secondary prevention | 62 (25.8) | 60 (24.3) | 49 (20.3) | 49 (21.5) | 48 (19.2) |
| Prophylactic implantation | 166 (69.2) | 179 (72.5) | 176 (70.3) | 166 (72.8) | 198 (79.2) |
| Missing/unclassifiable | 12 (5.0) | 8 (3.2) | 16 (6.6) | 13 (5.7) | 4 (1.6) |
| Subtotal | 240 | 247 | 241 | 228 | 250 |
| Brugada syndrome | |||||
| Aborted SCD | 8 (13.7) | 7 (15.9) | 16 (24.2) | 11 (15.5) | 14 (18.9) |
| Prophylactic implantation in syncope | 17 (29.3) | 14 (31.8) | 10 (15.2) | 16 (22.5) | 14 (18.9 |
| Prophylactic implantation without syncope | 22 (37.9) | 12 (27.3) | 35 (53.0) | 38 (53.5) | 14 (18.9) |
| Missing/unclassifiable | 11 (18.9) | 11 (25.0) | 5 (7.6) | 6 (8.4) | 17 (23.0) |
| Subtotal | 60 | 47 | 66 | 71 | 74 |
| ARVC | |||||
| Aborted SCD | 6 (13.3) | 8 (20.5) | 2 (4.3) | 3 (12.5) | 4 (10.3) |
| SMVT | 16 (35.5) | 17 (41.4) | 25 (54.3) | 7 (29.1) | 16 (41.0) |
| Prophylactic implantation | 16 (35.5) | 14 (34.1) | 18 (39.1) | 10 (41.6) | 14 (35.9) |
| Missing/unclassifiable | 7 (15.5) | 2 (4.8) | 1 (2.2) | 4 (16.6) | 5 (12.8) |
| Subtotal | 45 | 41 | 46 | 24 | 39 |
| Congenital heart disease | |||||
| Aborted SCD | 5 (13.9) | 9 (27.3) | 4 (12.1) | 6 (12.0) | 7 (15.2) |
| SMVT | 7 (19.4) | 9 (27.3) | 10 (30.3) | 10 (20.0) | 14 (30.4) |
| Prophylactic implantation | 15 (41.7) | 12 (36.4) | 12 (36.4) | 29 (58.0) | 21 (45.6) |
| Missing/unclassifiable | 9 (25.0) | 3 (36.4) | 7 (21.2) | 5 (10.0) | 4 (8.7) |
| Subtotal | 36 | 33 | 33 | 50 | 46 |
| Long QT syndrome | |||||
| Aborted SCD | 19 (70.4) | 8 (38.1) | 10 (30.3) | 15 (48.4) | 9 (24.3) |
| Prophylactic implantation | 5 (18.5) | 12 (54.5) | 15 (45.5) | 12 (38.7) | 18 (48.6) |
| Missing/unclassifiable | 3 (11.1) | 2 (9.1) | 8 (24.2) | 4 (12.9) | 10 (27.3) |
| Subtotal | 26 | 22 | 33 | 31 | 37 |
ARVC, arrhythmogenic right ventricular cardiomyopathy; SCD, sudden cardiac death; SMVT, sustained monomorphic ventricular tachycardia.
Data are expressed as No. (%).
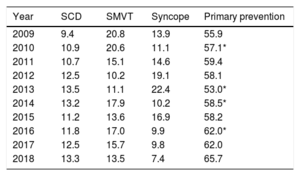
The implantation indication was identified in 62.6% of forms. Most first implantations were indicated for primary prevention (65.7%), a proportion that has slowly been increasing throughout registry history (table 3).
Changes in the Main Indications for Implantable Cardioverter-defibrillators (Percentages of First Implantations, 2009-2018)
| Year | SCD | SMVT | Syncope | Primary prevention |
|---|---|---|---|---|
| 2009 | 9.4 | 20.8 | 13.9 | 55.9 |
| 2010 | 10.9 | 20.6 | 11.1 | 57.1* |
| 2011 | 10.7 | 15.1 | 14.6 | 59.4 |
| 2012 | 12.5 | 10.2 | 19.1 | 58.1 |
| 2013 | 13.5 | 11.1 | 22.4 | 53.0* |
| 2014 | 13.2 | 17.9 | 10.2 | 58.5* |
| 2015 | 11.2 | 13.6 | 16.9 | 58.2 |
| 2016 | 11.8 | 17.0 | 9.9 | 62.0* |
| 2017 | 12.5 | 15.7 | 9.8 | 62.0 |
| 2018 | 13.3 | 13.5 | 7.4 | 65.7 |
SCD, sudden cardiac death; SMVT, sustained monomorphic ventricular tachycardia.
The implantation setting and specialist performing the procedure were recorded in 69.4% of forms. In total, 82.4% of procedures were performed in electrophysiology laboratories and 14.3% in operating rooms. Cardiac electrophysiologists performed 77.9% of implantations, surgeons performed 9.3%, and both together performed 8.1%. Other specialists and intensivists were involved in 2.6% and 2.1% of procedures, respectively.
Generator Placement SiteGenerator placement was recorded for 70.2% of first implantations. Placement was subcutaneous in 91.8% of patients and subpectoral in the remaining 8.2%. These figures were 91.3% and 8.7%, respectively, for all devices implanted.
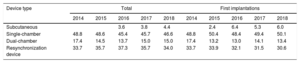
Device TypeThe types of device implanted are shown in table 4. This information was provided in 91.6% of forms submitted to the registry. In 2018, first implantations of subcutaneous defibrillators comprised 6.0% (5.3% in 2017 and 6.4% in 2016).
Percent Distribution of Implanted Devices by Type
| Device type | Total | First implantations | ||||||||
|---|---|---|---|---|---|---|---|---|---|---|
| 2014 | 2015 | 2016 | 2017 | 2018 | 2014 | 2015 | 2016 | 2017 | 2018 | |
| Subcutaneous | 3.6 | 3.8 | 4.4 | 2.4 | 6.4 | 5.3 | 6.0 | |||
| Single-chamber | 48.8 | 48.6 | 45.4 | 45.7 | 46.6 | 48.8 | 50.4 | 48.4 | 49.4 | 50.1 |
| Dual-chamber | 17.4 | 14.5 | 13.7 | 15.0 | 15.0 | 17.4 | 13.2 | 13.0 | 14.1 | 13.4 |
| Resynchronization device | 33.7 | 35.7 | 37.3 | 35.7 | 34.0 | 33.7 | 33.9 | 32.1 | 31.5 | 30.6 |
The most frequent reason for replacement was battery depletion (79.3%); complications prompted 9.1% of replacements (10.5% in 2017 and 8.8% in 2016) and a change of indication prompted 11.5%. Of the 818 replacements providing this information, 2.4% were performed before 6 months.
Information was available on lead status in 56.1% of forms; 4.6% were malfunctioning (40 forms) and they were extracted in 12.5% of patients reporting this problem.
Device ProgrammingWith data on 49.3% of implantations, the most common pacing mode was VVI (54.52%), following by DDD (28.5%), VVIR (6.3%), DDDR (4.7%), and others (6.0%).
Ventricular fibrillation induction was tested in 249 patients, 5.8% of the 4322 records providing this information (5.3% in 2017 and 4.1% in 2016). The mean number of shocks delivered was 1.1. Thus, the threshold was not calculated in most patients.
ComplicationsComplication data were recorded in 77.2% of forms. There were 25 complications: 10 coronary sinus dissections, 2 tamponades, 9 deaths, and 4 unspecified. The mortality rate was 0.2%, representing an increase vs the 3 previous years (0.09% in 2017 and 0.02% in 2016), although the number remains quite low.
DISCUSSIONIn 2018, information was obtained on the vast majority of implantations performed in Spain, with over 90% of those being performed according to Eucomed data. This is at least partly due to the efforts of the SEC but is mainly due to the contribution of the implantation centers.
Comparison With Registries of Previous YearsThe SEC excels at the publication of activity data and has systematically published registry data since 2005.5 In 2018, there was another slight uptick in the number of devices, whereas the number remained stable in Europe.9 This situation reduced, albeit slightly, the difference vs our neighboring countries. The overall implantation rate per million population was 152 in 2018 (vs 138 in 2017) while it dropped from 311 in 2017 to 306 in 2018 in Europe.
There was also a slight increase in implantations for primary prevention in 2018, which reached 65.7% (table 3); this figure also brings Spain closer (again, only slightly) to the European level.10
Finally, the percentage of subcutaneous ICDs was 6.0% in 2018; this represents a slightly increase vs 2017 (5.3%) but is still lower than that of 2016 (6.4%). This figure seems low for a therapy with so many potential advantages.11
The most frequent underlying heart disease in 2018 continued to be ischemic heart disease (52.9%), followed by dilated cardiomyopathy (26.1%). In 2018, implantations for primary prevention of dilated cardiomyopathy appeared to have slightly recovered since the marked reduction in this therapy in Spain after the publication of the DANISH study.12 This phenomenon was also seen to a greater or lesser extent in other European countries.13 In our opinion, this reduction is not justified by the available data. First, the only guidelines published after the results of the DANISH trial maintained the indication for ICD implantation for primary prevention in patients with dilated cardiomyopathy (class I, level of evidence A).3 Second, the results of the DANISH study should not be applied to patients who have no indication for cardiac resynchronization (less than half of the patients included in the study). Third, the benefit to patients younger than 70 years of age is clear in the DANISH trial, and most implantations for primary prevention are in patients younger than that age.14 Finally, the results of 2 meta-analyses again showed a benefit of ICDs in this patient population, with a 25% reduction in the relative risk of death.15,16
The 2018 data are generally consistent with those of previous years. Given the scientific evidence, the implantation rate in our country remains lower than expected. In 2010, the implantation rate per million population in Spain was about half the European rate (116 vs 248); in 2017, the gap slightly decreased to 152 vs 306 implantations per million.9 This is a positive development, but we should not forget the magnitude of the difference in implantation rates vs our neighboring countries.
There were no changes from previous registries in the epidemiological characteristics of the patients. Patients with severe ventricular dysfunction and in NYHA II and III continued to predominate. There were no changes either in the type of specialist performing the implantation.
Differences Among Autonomous CommunitiesAs in previous years, the data from the 2018 registry showed large differences in the implantation rates of the various autonomous communities. Overall, the implantation rate in Spain in 2018 was 137 per million population according to the registry and 152 according to Eucomed data, a slight increase vs previous years. Several autonomous communities showed higher rates than the average: Cantabria (227), Principality of Asturias (214), Extremadura (168), Galicia (162), Castile-La Mancha (160), Community of Madrid (152), the Basque Country (147), Castile and León (146), Chartered Community of Navarre (142), and the Valencian Community (139). Below average were Catalonia (122), the Canary Islands (118), Andalusia (113), the Region of Murcia (97), and La Rioja (89). The analysis by autonomous community highlighted the major difference between the highest and lowest rates, which is difficult to explain in terms of a theoretically homogeneous health system. These differences are not explained by income level or population density. Also striking is the case of Andalusia, which, despite the general rise throughout Spain, failed to recover the implantation rate it had in 2016 (124).
Comparison With Other CountriesIn all of the countries participating in Eucomed, the implantation rate dropped from 311 per million population in 2017 (320 in 2016) to 306 in 2018. This figure includes ICDs and ICD-CRTs. Germany continued to lead with 485 devices, whereas Spain (152 implantations/million) was the country with the lowest number of implantations. Several countries showed higher than average rates: Italy (414), the Netherlands (385), the Czech Republic (381), Denmark (359), and Poland (332). Below the average were Ireland (273), Sweden (247), Belgium (235), Finland (235), Norway (225), France (224), Switzerland (220), Portugal (219), the United Kingdom (207), Greece (186), and, in last position, Spain (152). The difference in the implantation rate in Spain from the European average was maintained in 2018 (152 vs 306 compared with 138 vs 311 in 2017, 144 vs 320 in 2016, and 138 vs 315 in 2015). We are thus still far from the nearest country in terms of rate (152 vs 186).
The ICD-CRT implantation rate in Europe was 119 per million population (124 in 2017, 119 in 2016, 126 in 2015, 119 in 2014, and 113 in 2013). Germany (195 implantations per million population) continued to be first, whereas Spain (50) had the lowest implantation rate.
The proportion of ICD-CRTs with respect to the total varied from 39% in Denmark to 87% in the Czech Republic. The European average was 58%. Above the average were France, Portugal, the Netherlands, the United Kingdom, Germany, Italy, Sweden, and the Czech Republic. Below the 58% line were Denmark, Belgium, Finland, Norway, Switzerland, Greece, Ireland, and Poland. Spain had a proportion of 49%.
Other European countries also show regional differences in the ICD implantation rate.16–18 The reasons are difficult to identify and do not seem to be economic because the rates of countries with lower income than Spain, such as Ireland and Poland, far exceed ours, even in more disadvantaged regions. Nor can these differences be explained by the prevalence of cardiovascular diseases. It seems that electrophysiologists working in Spain have not been able to convince their clinical colleagues, responsible for device indication, of the virtues of ICDs and their ability to reduce the rates of overall and sudden cardiac death in at-risk patients.
LimitationsAlthough the 2018 ICD registry included more than 90% of the implantations reported to Eucomed, the information was often incomplete. Data were not available for all fields of the implantation form and its completion was uneven.
In addition, data collection was limited to the periimplantation period and there are no follow-up data; thus, the complication records may underestimate the actual percentage.
Future Prospects of the Spanish Implantable Cardioverter-defibrillator RegistryDuring 2018, it was possible to collect information on more than 90% of the devices reported to Eucomed, a satisfactory figure but nonetheless a decrease vs 2017. Throughout 2019, a website for the online completion of the implantation form has been developed by the SEC in collaboration with the Spanish Agency for Medicines and Health Products.19 This website will allow real-time registration of both pacemakers and ICDs. We hope that this change will boost the quality of the registry and its degree of completion. We also hope that the new platform will allow us to conduct prospective studies and improve the safety of patients affected by any possible safety alerts.
CONCLUSIONSThe 2018 Spanish Implantable Cardioverter-defibrillator Registry received information on 90% of the implantations performed in Spain. In 2018, the number of devices increased and the difference vs other European countries decreased, albeit slightly. The total number of implantations in Spain is still much lower than the average for the European Union and the autonomous communities continue to show considerable variability.
CONFLICTS OF INTERESTI. Fernández Lozano has participated in clinical studies sponsored by Medtronic, Abbott, Biotronik, and Sorin and has fellowship grants from the SEC and the Cardiovascular Research Foundation. J. Osca Asensi has participated in clinical studies sponsored by Abbott, Boston, and Biotronik. J. Alzueta Rodríguez has participated in presentations sponsored by Boston and has received fellowship grants from the FIMABIS Foundation.