
The Spanish Automatic Defibrillator Registry has provided activity data since 2002.
MethodsThe data in this registry are submitted by implantation centers that voluntarily complete a data collection sheet.
ResultsDuring 2017, a total of 6273 implant sheets were received, compared with 6429 reported by Eucomed (European Confederation of Medical Suppliers Associations). Therefore, the registry contains data on 97.6% of the devices implanted in Spain. Compliance ranged from 99.7% for the field “name of the implanting hospital” to 46.1% for the variable “New York Heart Association functional class”. A total of 181 hospitals reported data to the registry, representing an increase compared with the number of participating hospitals in 2016 (177) and in previous years (169 in 2015, 162 in 2014, 154 in 2013, and 153 in 2012).
ConclusionsThe number of implants per million inhabitants in Spain increased for several years but decreased in 2017. As in previous years, the total number of implants in Spain is still much lower than the European Union average, and the gap continues to widen. There are still substantial differences between autonomous communities.
Keywords
Implantable cardioverter-defibrillator (ICD) placement is the most effective treatment for preventing sudden cardiac death secondary to ventricular arrhythmia. Various clinical trials and meta-analyses have substantiated the ICD indications compiled in clinical practice guidelines for the treatment of patients with ventricular arrhythmias or a risk of sudden cardiac death; these include both primary and secondary prevention measures for sudden cardiac death.1–5 Sudden cardiac death secondary to ventricular arrhythmia has a huge socioeconomic impact, with an incidence in Europe of 400 000 deaths per year, 40% of which occur before the age of 65 years.
It is important to know how patients are selected for ICD placement in clinical practice, the degree to which the guidelines are followed, the yearly incidence of implantations, and the potential impact of other therapies such as the sacubitril/valsartan combination.6 There is also a great deal of interest in determining the impact of the latest reported clinical trials on ICD use in certain conditions, such as dilated cardiomyopathy.7 Last, it is important to compare the implantation activity between the various autonomous communities of Spain, and in particular, the overall implantation rate with that of other European countries. Health registries are of value in this task, as they reflect current clinical practice and are useful for patients, physicians, health care administrators, and manufacturers of cardiac arrhythmia devices.
The Spanish Implantable Cardioverter-defibrillator Registry, developed by members of the Electrophysiology and Arrhythmias Section of the Spanish Society of Cardiology (SEC, Sociedad Española de Cardiología), has been published yearly since 2005.8–20 This report presents the data on ICD implantation submitted to the Spanish Automatic Defibrillator Registry in 2017. The majority of centers performing this activity in Spain have collaborated in the registry. As in other years, this report reviews the patients’ indications and clinical characteristics, the implantation data, the device type and programming, and procedure-related complications.
METHODSData were compiled using a data collection form. The form was voluntarily completed by each implantation team directly either during or after the procedure, sometimes in collaboration with the device manufacturer's technical personnel. Procedures involving first-time implants as well as generator replacements were eligible for notification to the registry.
A team consisting of a technician, a SEC computer scientist, and a member of the Electrophysiology and Arrhythmia Section entered information in a database. Data cleansing was carried out by the technician and Section member. The authors of this article analyzed the data and are responsible for this publication.
The census data for the various calculations of rates per million population, both national rates and by autonomous community and province, were obtained from the Spanish National Institute of Statistics as of January 1, 2018.21 As in previous years, the data from the present registry were compared with those provided by the European Confederation of Medical Suppliers Associations (Eucomed).
When more than 1 presentation form or clinical arrhythmia was recorded on the data collection sheet of a single patient, only the most serious condition was included in the analysis. The percentage of each parameter analyzed was calculated taking into account the total number of implantations with available information on the parameter.
Statistical AnalysisResults are expressed as the mean±standard deviation or the median [interquartile range], depending on the distribution of the variable. Continuous quantitative variables were analyzed using analysis of variance or the Kruskal-Wallis test, and qualitative variables using the chi-square test. Linear regression models were used to analyze the number of implantations and implantation units per million population, and the total number of implantations and number for primary prevention in each center.
RESULTSA total of 6273 implantation forms were received, whereas 6429 procedures were notified by Eucomed; hence, data were collected on 97.6% of implantation procedures performed in Spain. Compliance ranged from 99.7% for the field name of implantation hospital to 46.1% for the field New York Heart Association (NYHA) functional class.
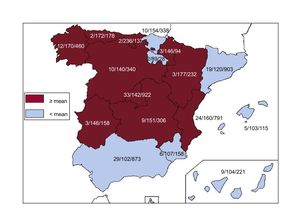
Implantation CentersIn total, 181 hospitals carrying out ICD implantations reported data to the registry, which represents an increase with respect to 2016 (177) and previous years (169 in 2015, 162 in 2014, 154 in 2013, and 153 in 2012). Data from the 181 hospitals are shown in Table 1; 77 were public health centers. The total number of implantation centers, the rate per million population, and the total number of implantations per autonomous community according to the data sent to the registry are shown in Figure 1. During 2017, 100 or more devices were implanted by 22 centers, 10 or fewer devices by 86 centers, and only 1 device by 34 centers.
Implantations Performed by Autonomous Community, Province, and Hospital
| Andalusia | ||
|---|---|---|
| Almería | Hospital Torrecárdenas | 22 |
| Hospital Vithas Virgen del Mar | 2 | |
| Hospital Comarcal La Inmaculada | 2 | |
| Cádiz | Clínica Nuestra Señora de la Salud | 2 |
| Hospital de Jerez | 40 | |
| Hospital San Carlos | 4 | |
| Hospital Universitario de Puerto Real | 16 | |
| Hospital Universitario Puerta del Mar | 52 | |
| Córdoba | Hospital de la Cruz Roja de Córdoba | 1 |
| Hospital Universitario Reina Sofía de Córdoba | 51 | |
| Granada | Hospital Universitario Virgen de las Nieves | 103 |
| Huelva | Hospital Costa de la Luz | 4 |
| Hospital General Juan Ramón Jiménez | 50 | |
| Hospital Infanta Elena | 5 | |
| Jaén | Complejo Hospitalario de Jaén | 32 |
| Málaga | Clínica de la Encarnación | 1 |
| Clínica El Ángel | 4 | |
| Clínica Parque San Antonio | 11 | |
| Hospital Internacional Xanit | 7 | |
| Hospital Quirón de Málaga | 1 | |
| Hospital Quirónsalud Marbella | 6 | |
| Hospital Virgen de la Victoria | 241 | |
| Seville | Clínica HLA Santa Isabel | 11 |
| Hospital de Fátima | 2 | |
| Hospital Nisa Aljarafe | 2 | |
| Hospital Nuestra Señora de Valme | 33 | |
| Hospital Quirónsalud Sagrado Corazón | 6 | |
| Hospital Virgen del Rocío | 101 | |
| Hospital Virgen Macarena | 60 | |
| Aragón | ||
| Zaragoza | Hospital Clínico Universitario Lozano Blesa | 48 |
| Hospital Miguel Servet | 180 | |
| Hospital Quirónsalud Zaragoza | 3 | |
| Principality of Asturias | Hospital de Cabueñes | 10 |
| Hospital Universitario Central de Asturias | 168 | |
| Balearic Islands | Clínica Juaneda | 1 |
| Clinica Quirón Palmaplanas | 5 | |
| Hospital Son Llàtzer | 31 | |
| Hospital Universitari Son Espases | 77 | |
| Policlínica Nuestra Señora del Rosario | 1 | |
| Canary Islands | ||
| Las Palmas | Hospital Dr. Negrín | 40 |
| Hospital Insular de Gran Canaria | 51 | |
| Hospital Nuestra Señora del Perpetuo Socorro | 2 | |
| Hospital Dr. José Molina Orosa | 1 | |
| Clínica San Roque S.A. | 1 | |
| Santa Cruz de Tenerife | Hospital San Juan de Dios de Tenerife | 1 |
| Hospital Nuestra Señora de la Candelaria | 55 | |
| Hospital Universitario de Canarias | 70 | |
| Hospiten Ramblas | 1 | |
| Cantabria | Clínica Mompía | 1 |
| Hospital Universitario Marqués de Valdecilla | 136 | |
| Castile and León | ||
| Ávila | Hospital Nuestra Señora de Sonsoles | 14 |
| Burgos | Hospital Universitario de Burgos (HUBU) | 53 |
| León | Clínica San Francisco de León | 4 |
| Hospital de León | 62 | |
| Hospital HM Nuestra Señora de Regla | 1 | |
| Salamanca | Complejo Hospitalario de Salamanca | 75 |
| Segovia | Hospital General de Segovia | 3 |
| Valladolid | Hospital Recoletas Campo Grande | 10 |
| Hospital Clínico Universitario de Valladolid | 84 | |
| Hospital Universitario Río Hortega | 35 | |
| Castile-La Mancha | ||
| Albacete | Hospital General de Albacete | 63 |
| Hospital Quirónsalud Albacete | 4 | |
| Sanatorio Santa Cristina | 1 | |
| Ciudad Real | Hospital General de Ciudad Real | 60 |
| Quirón Ciudad Real | 3 | |
| Cuenca | Hospital Virgen de la Luz | 6 |
| Guadalajara | Hospital General y Universitario de Guadalajara | 31 |
| Toledo | Hospital Nuestra Señora del Prado | 27 |
| Hospital Virgen de la Salud | 111 | |
| Catalonia | ||
| Barcelona | Centro Médico Teknon | 4 |
| Clínica Corachan | 2 | |
| Clínica Delfos | 1 | |
| Clínica Quirónsalud Barcelona | 3 | |
| Clínica Sagrada Família | 4 | |
| Hospital Clínico de Barcelona | 225 | |
| Hospital de Bellvitge | 146 | |
| Hospital de la Santa Creu i Sant Pau | 170 | |
| Hospital de Sabadell Parc Taulí | 26 | |
| Hospital del Mar | 27 | |
| Hospital El Pilar (Quirónsalud) | 14 | |
| Hospital General de Catalunya | 6 | |
| Hospital Germans Trias i Pujol | 54 | |
| Hospital Sant Joan de Déu | 11 | |
| Hospital Vall d’Hebron | 137 | |
| Girona | Clínica Girona | 1 |
| Hospital Universitario de Girona Dr. Josep Trueta | 21 | |
| Lleida | Hospital Universitario Arnau de Vilanova | 28 |
| Tarragona | Hospital Universitario de Tarragona Joan XXIII | 23 |
| Valencian Community | ||
| Alicante | Clínica Vistahermosa | 6 |
| Hospital General de Elda | 1 | |
| Hospital General Universitario de Alicante | 169 | |
| Hospital General Universitario de Elche | 1 | |
| Hospital IMED de Levante | 2 | |
| Hospital IMED Elche | 2 | |
| Hospital Mediterráneo | 3 | |
| Hospital Universitari Sant Joan d’Alacant | 56 | |
| Castellón | Consorcio Hospitalario Provincial de Castellón | 2 |
| Hospital Comarcal de Vinaròs | 1 | |
| Hospital General Universitari de Castelló | 62 | |
| Hospital Rey Don Jaime | 1 | |
| Valencia | Hospital Arnau de Vilanova de Valencia | 1 |
| Hospital Casa de Salud | 1 | |
| Hospital Clínico Universitario de Valencia | 97 | |
| Hospital de Manises | 42 | |
| Hospital General Universitario de Valencia | 86 | |
| Hospital IMED Valencia | 1 | |
| Hospital Nisa 9 de Octubre | 2 | |
| Hospital Quirónsalud Valencia | 3 | |
| Hospital Universitari de la Ribera | 63 | |
| Hospital Universitario Dr. Peset | 28 | |
| Hospital Universitario La Fe | 160 | |
| Extremadura | ||
| Badajoz | Hospital Infanta Cristina de Badajoz | 126 |
| Hospital Quirónsalud Clideba Badajoz | 2 | |
| Cáceres | Complejo Hospitalario de Cáceres | 30 |
| Galicia | ||
| A Coruña | Complejo Hospitalario Universitario de A Coruña | 169 |
| Complejo Hospitalario Universitario de Santiago | 129 | |
| Hospital HM Modelo | 3 | |
| Hospital Quirónsalud A Coruña | 5 | |
| Lugo | Complejo Hospitalario Xeral Calde | 1 |
| Hospital Universitario Lucus Agusti | 19 | |
| Orense | Complejo Hospitalario de Ourense | 13 |
| Pontevedra | Complejo Hospitalario de Pontevedra | 2 |
| Hospital Álvaro Cunqueiro | 86 | |
| Hospital Montecelo | 5 | |
| Hospital Nuestra Señora de Fátima | 6 | |
| Hospital Povisa | 22 | |
| La Rioja | Hospital San Pedro | 27 |
| Hospital Viamed Los Manzanos | 1 | |
| Community of Madrid | Clínica La Luz | 6 |
| Clínica La Milagrosa | 1 | |
| Clínica Moncloa | 32 | |
| Clínica Ruber, S.A. | 5 | |
| Fundación Hospital de Alcorcón | 25 | |
| Fundación Jiménez Díaz, Clínica Ntra. Sra. de la Concepción | 58 | |
| Grupo Hospital de Madrid | 14 | |
| Hospital 12 de Octubre | 77 | |
| Hospital Central de la Defensa | 25 | |
| Hospital Clínico San Carlos | 126 | |
| Hospital de Fuenlabrada | 12 | |
| Hospital de Torrejón | 6 | |
| Hospital General Universitario Gregorio Marañón | 75 | |
| Hospital General de Villalba | 3 | |
| Hospital Infanta Leonor | 14 | |
| Hospital Infanta Sofía | 1 | |
| Hospital Los Madroños | 1 | |
| Hospital Nisa Pardo de Aravaca | 2 | |
| Hospital Quirón Madrid | 5 | |
| Hospital Quirón San Camilo | 1 | |
| Hospital Ramón y Cajal | 108 | |
| Hospital Rey Juan Carlos | 26 | |
| Hospital Ruber Internacional | 1 | |
| Hospital San Rafael | 6 | |
| Hospital Severo Ochoa | 20 | |
| Hospital Universitario de Getafe | 19 | |
| Hospital Universitario Infanta Elena | 6 | |
| Hospital Universitario La Paz | 117 | |
| Hospital Universitario Puerta de Hierro Majadahonda | 138 | |
| Hospital Virgen de la Paloma | 8 | |
| Hospital Virgen del Mar | 2 | |
| Hospital Vithas Nuestra Señora de América | 1 | |
| Sanatorio San Francisco de Asís | 2 | |
| Region of Murcia | Hospital General Universitario Morales Meseguer | 8 |
| Hospital General Universitario Reina Sofía (Murcia) | 14 | |
| Hospital General Universitario Santa Lucía | 41 | |
| Hospital La Vega - HLA | 6 | |
| Hospital Rafael Méndez | 20 | |
| Hospital Universitario Virgen de la Arrixaca | 69 | |
| Chartered Community of Navarre | Clínica San Miguel IMQ | 1 |
| Clínica Universidad de Navarra | 32 | |
| Hospital de Navarra | 61 | |
| Basque Country | ||
| Álava | Hospital Vithas San José | 1 |
| Hospital Universitario de Araba | 54 | |
| Guipúzcoa | Hospital Universitario de Donostia | 155 |
| Policlínica Gipuzkoa Quirón | 3 | |
| Vizcaya | Hospital de Basurto | 48 |
| Hospital de Cruces | 57 | |
| Hospital de Galdakao-Usansolo | 15 | |
| Hospital Quirón Vizcaya | 1 | |
| IMQ Zorrotzaurre | 3 | |

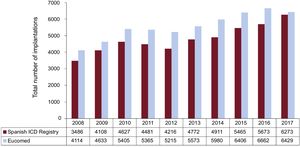
The total number of implantations (first-time and replacements) in 2017 was 6273, a value representing an increase compared to 2016 (5673). The total number of implantations reported to the registry and those estimated by Eucomed in the last 10 years are summarized in Figure 2. These data indicate that the 2017 values actually signify a reduction in the number of ICD implantations performed in Spain relative to the previous year (6662 according to the 2016 Eucomed data).

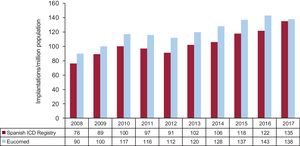
The overall implantation rate was 135/million population recorded in the registry and 138/million population according to Eucomed. This latter value is lower than that of the previous year (143/million population in 2016) and is much lower than the mean ICD implantation rate in Europe (311/million population in 2017). The changes occurring over the last 10 years in the implantation rates per million population according to the registry and Eucomed data are shown in Figure 3.

The name of the hospital where the procedure took place was recorded in 97.6% of notifications. The procedures notified to the registry by each participating hospital are shown in Table 1. Most implantations (5920, 94.7%) were performed in public health centers.
First Implantations Versus ReplacementsThis information was provided in 5193 forms sent to the SEC (83% of procedures included in the registry). There were 3710 first-time implantations; that is, 71.4% of the total (66.8% in 2016, 71.8% in 2015, 72.6% in 2014, 68.8% in 2013, and 69.4% in 2012). The rate of first-time implantations per million population was 76.5 (65.5 in 2016, 75.1 in 2015, 79.0 in 2014, 63.8 in 2013, and 64.0 in 2012).
Age and SexThe mean (range) age of patients undergoing ICD implantation or replacement was 62.6±13.4 (6-90) years in 2017 compared with 62.7±13.4 (6-90) in 2016, 62.8±13.3 (6-89) in 2015, and 61.8±13.7 (7-94) in 2014. The mean age of patients undergoing first-time ICD implantation was 61.4±13.1 years. Men accounted for the vast majority: 82.6% of all patients and 83.6% of first-time implantations.
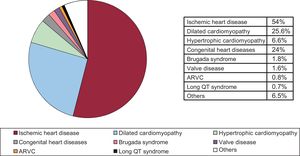
Underlying Heart Disease, Left Ventricular Ejection Fraction, Functional Class and Baseline RhythmIschemic heart disease was the most common underlying heart disease in first-time implantations (54%), followed by dilated cardiomyopathy (25.6%), hypertrophy (6.6%), primary conduction abnormalities (Brugada syndrome and long QT syndrome) (3.1%), cardiac valve diseases (1.6%), and arrhythmogenic right ventricular cardiomyopathy (0.8%) (Figure 4).
. ARVC, arrhythmogenic right ventricular cardiomyopathy. Others, patients with more than one diagnosis.")
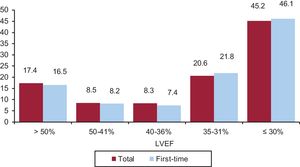
The patients’ left ventricular systolic function was provided in 68.67% of forms sent to the registry. In this overall group, left ventricular ejection fraction was> 50% in 17.4%, 50% to 41% in 8.5%, 40% to 36% in 8.3%, 35% to 31% in 20.6%, and ≤ 30% in 45.2% (Figure 5). Separate analyses in first-time ICD implantations and replacements yielded similar distributions.
 of patients in the registry (total and first-time implantations).")
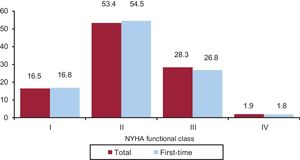
The NYHA functional class was recorded in 46.1% of forms. Most patients were in NYHA class II (53.4%), followed by NYHA III (28.3%), NYHA I (16.5%), and NYHA IV (1.9%). The distribution for this variable was similar between the overall group and first-time implantations (Figure 6).
 functional class of patients in the registry (total and first-time implantations).")
The patients’ baseline cardiac rhythm was recorded in 72.1% of notifications: sinus rhythm predominated (79%), followed by atrial fibrillation (16%) and pacemaker rhythm (4.58%). The remaining patients had other rhythms (eg, atrial flutter).
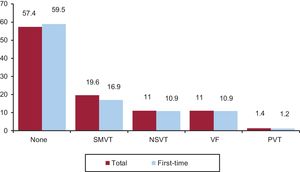
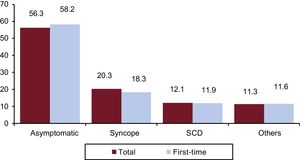
Clinical Arrhythmia Prompting Implantation, Presentation Form, and Induced Arrhythmia on Electrophysiological StudyThe clinical arrhythmia that led to device implantation was reported in 67.3% of forms sent to the registry. Most patients in the first-time implantation group had no documented clinical arrhythmias (59.9%), whereas 17.0% showed sustained monomorphic ventricular tachycardia, 10.9%, nonsustained ventricular tachycardia, and 10.9% ventricular fibrillation. In the overall group, 57.4% had no documented clinical arrhythmia (Figure 7). The most common clinical presentation in both the total number of patients and in those undergoing first-time implantation (56.1% with responses provided) was an absence of symptoms, followed by syncope, sudden cardiac death, and others (Figure 8).
. NSVT, nonsustained ventricular tachycardia; PVT, polymorphic ventricular tachycardia; SMVT, sustained monomorphic ventricular tachycardia; VF, ventricular fibrillation.")
. SCD, sudden cardiac death.")
Information on the electrophysiological studies performed before ICD implantation was provided in 62.6% of forms sent to the registry. These studies were carried out in 191 patients (8.2%), mainly those with ischemic heart disease and dilated cardiomyopathy. The most common induced arrhythmia was sustained monomorphic ventricular tachycardia (50.9%), followed by nonsustained ventricular tachycardia (9.9%), ventricular fibrillation (19.9%) and, to a lesser extent, other arrhythmias (6.8%). In 12.4% of the electrophysiological studies, no arrhythmia was induced.
Clinical HistoryVariables related to the patients’ clinical history have been recorded since 2011 so that the profile of patients receiving an ICD in Spain can be established.
Responses to these questions were provided in 62.6% of notifications from first-time implantations. The following are the most important data related to cardiovascular risk and other background: hypertension, 58%; hypercholesterolemia, 50%; smoking, 37%; diabetes mellitus, 31%; history of atrial fibrillation, 27%; family history of sudden cardiac death, 8%; renal failure, 15%; and stroke, 7%.
The QRS interval was reported in 46.3% of first-time implantations (mean, 121ms). The QRS value was> 140ms in 39%, and 88.7% of these patients were carriers of a cardiac resynchronization therapy-defibrillator (CRT-D).
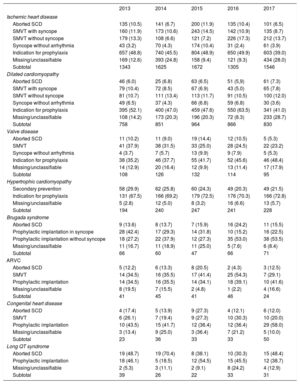
IndicationsThe changes occurring over time (2013-2015) in first-time implantations and the form of presentation according to the type of heart disease are shown in Table 2. These data were provided in 62.6% of notifications. Ischemic heart disease was the most frequent reason for ICD implantation in Spain, accounting for 54% of first-time implantations in 2017. Among ischemic heart disease patients, the most common indication was for primary prevention (39%), although this rate is lower than those recorded in previous years (values greater than 45%). Nonetheless, in a large percentage of data collection forms, the reason prompting ICD implantation was not specified or was unclassifiable. Dilated cardiomyopathy was the second most common reason for implanting ICDs (29% of all first-time procedures). However, there was a reduction in the absolute number of first-time implantations for this reason (830 in 2017 vs 866 in 2016, 964 in 2015, and 851 in 2014). As occurred in the case of ischemic heart disease, this decrease was mainly due to a smaller number of indications for primary prevention (41% vs 64% in 2016 and 48% in 2015). In less common heart diseases, the most frequent indication was primary prevention in hypertrophic cardiomyopathy, valve diseases, congenital conditions, and Brugada syndrome. However, the most common indication in long QT syndrome was secondary prevention, which contrasts with values reported in the 2 previous years (48% in 2017 vs 30% in 2016 and 38% in 2015), but is similar to the 2014 situation (70%).
Number of First-time Implantations by Type of Heart Disease, Type of Clinical Arrhythmia, and Form of Presentation, 2013 to 2017
| 2013 | 2014 | 2015 | 2016 | 2017 | |
|---|---|---|---|---|---|
| Ischemic heart disease | |||||
| Aborted SCD | 135 (10.5) | 141 (6.7) | 200 (11.9) | 135 (10.4) | 101 (6.5) |
| SMVT with syncope | 160 (11.9) | 173 (10.6) | 243 (14.5) | 142 (10.9) | 135 (8.7) |
| SMVT without syncope | 179 (13.3) | 108 (6.6) | 121 (7.2) | 226 (17.3) | 212 (13.7) |
| Syncope without arrhythmia | 43 (3.2) | 70 (4.3) | 174 (10.4) | 31 (2.4) | 61 (3.9) |
| Indication for prophylaxis | 657 (48.8) | 740 (45.5) | 804 (48.9) | 650 (49.9) | 603 (39.0) |
| Missing/unclassifiable | 169 (12.6) | 393 (24.8) | 158 (9.4) | 121 (9.3) | 434 (28.0) |
| Subtotal | 1343 | 1625 | 1672 | 1305 | 1546 |
| Dilated cardiomyopathy | |||||
| Aborted SCD | 46 (6.0) | 25 (6.8) | 63 (6.5) | 51 (5,9) | 61 (7.3) |
| SMVT with syncope | 79 (10.4) | 72 (8.5) | 67 (6.9) | 43 (5.0) | 65 (7.8) |
| SMVT without syncope | 81 (10.7) | 111 (13.4) | 113 (11.7) | 91 (10.5) | 100 (12.0) |
| Syncope without arrhythmia | 49 (6.5) | 37 (4.3) | 66 (6.8) | 59 (6.8) | 30 (3.6) |
| Indication for prophylaxis | 395 (52.1) | 400 (47.0) | 459 (47.6) | 550 (63.5) | 341 (41.0) |
| Missing/unclassifiable | 108 (14.2) | 173 (20.3) | 196 (20.3) | 72 (8.3) | 233 (28.7) |
| Subtotal | 758 | 851 | 964 | 866 | 830 |
| Valve disease | |||||
| Aborted SCD | 11 (10.2) | 11 (9.0) | 19 (14.4) | 12 (10.5) | 5 (5.3) |
| SMVT | 41 (37.9) | 38 (31.5) | 33 (25.0) | 28 (24.5) | 22 (23.2) |
| Syncope without arrhythmia | 4 (3.7) | 7 (5.7) | 13 (9.9) | 9 (7.9) | 5 (5.3) |
| Indication for prophylaxis | 38 (35.2) | 46 (37.7) | 55 (41.7) | 52 (45.6) | 46 (48.4) |
| Missing/unclassifiable | 14 (12.9) | 20 (16.4) | 12 (9.9) | 13 (11.4) | 17 (17.9) |
| Subtotal | 108 | 126 | 132 | 114 | 95 |
| Hypertrophic cardiomyopathy | |||||
| Secondary prevention | 58 (29.9) | 62 (25.8) | 60 (24.3) | 49 (20.3) | 49 (21.5) |
| Indication for prophylaxis | 131 (67.5) | 166 (69.2) | 179 (72.5) | 176 (70.3) | 166 (72.8) |
| Missing/unclassifiable | 5 (2.8) | 12 (5.0) | 8 (3.2) | 16 (6.6) | 13 (5.7) |
| Subtotal | 194 | 240 | 247 | 241 | 228 |
| Brugada syndrome | |||||
| Aborted SCD | 9 (13.6) | 8 (13.7) | 7 (15.9) | 16 (24.2) | 11 (15.5) |
| Prophylactic implantation in syncope | 28 (42.4) | 17 (29.3) | 14 (31.8) | 10 (15.2) | 16 (22.5) |
| Prophylactic implantation without syncope | 18 (27.2) | 22 (37.9) | 12 (27.3) | 35 (53.0) | 38 (53.5) |
| Missing/unclassifiable | 11 (16.7) | 11 (18.9) | 11 (25.0) | 5 (7.6) | 6 (8.4) |
| Subtotal | 66 | 60 | 47 | 66 | 71 |
| ARVC | |||||
| Aborted SCD | 5 (12.2) | 6 (13.3) | 8 (20.5) | 2 (4.3) | 3 (12.5) |
| SMVT | 14 (34.5) | 16 (35.5) | 17 (41.4) | 25 (54.3) | 7 (29.1) |
| Prophylactic implantation | 14 (34.5) | 16 (35.5) | 14 (34.1) | 18 (39.1) | 10 (41.6) |
| Missing/unclassifiable | 8 (19.5) | 7 (15.5) | 2 (4.8) | 1 (2.2) | 4 (16.6) |
| Subtotal | 41 | 45 | 41 | 46 | 24 |
| Congenital heart disease | |||||
| Aborted SCD | 4 (17.4) | 5 (13.9) | 9 (27.3) | 4 (12.1) | 6 (12.0) |
| SMVT | 6 (26.1) | 7 (19.4) | 9 (27.3) | 10 (30.3) | 10 (20.0) |
| Prophylactic implantation | 10 (43.5) | 15 (41.7) | 12 (36.4) | 12 (36.4) | 29 (58.0) |
| Missing/unclassifiable | 3 (13.4) | 9 (25.0) | 3 (36.4) | 7 (21.2) | 5 (10.0) |
| Subtotal | 23 | 36 | 33 | 33 | 50 |
| Long QT syndrome | |||||
| Aborted SCD | 19 (48.7) | 19 (70.4) | 8 (38.1) | 10 (30.3) | 15 (48.4) |
| Prophylactic implantation | 18 (46.1) | 5 (18.5) | 12 (54.5) | 15 (45.5) | 12 (38.7) |
| Missing/unclassifiable | 2 (5.3) | 3 (11.1) | 2 (9.1) | 8 (24.2) | 4 (12.9) |
| Subtotal | 39 | 26 | 22 | 33 | 31 |
ARVC, arrhythmogenic right ventricular cardiomyopathy; SCD, sudden cardiac death; SMVT, sustained monomorphic ventricular tachycardia.
Data are expressed as No. (%).
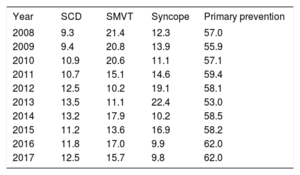
The indication for ICD implantation was identified in 62.6% of forms. Most first-time implantations were for primary prevention (62%), in a percentage identical to that recorded in 2016 and higher than the values from previous years (Table 3).
Changes in the Main Indications for Implantable Cardioverter-defibrillators (Percentage of First-time Implantations, 2008-2017)
| Year | SCD | SMVT | Syncope | Primary prevention |
|---|---|---|---|---|
| 2008 | 9.3 | 21.4 | 12.3 | 57.0 |
| 2009 | 9.4 | 20.8 | 13.9 | 55.9 |
| 2010 | 10.9 | 20.6 | 11.1 | 57.1 |
| 2011 | 10.7 | 15.1 | 14.6 | 59.4 |
| 2012 | 12.5 | 10.2 | 19.1 | 58.1 |
| 2013 | 13.5 | 11.1 | 22.4 | 53.0 |
| 2014 | 13.2 | 17.9 | 10.2 | 58.5 |
| 2015 | 11.2 | 13.6 | 16.9 | 58.2 |
| 2016 | 11.8 | 17.0 | 9.9 | 62.0 |
| 2017 | 12.5 | 15.7 | 9.8 | 62.0 |
SCD, sudden cardiac death; SMVT, sustained monomorphic ventricular tachycardia
The implantation setting and specialist performing the procedure were recorded in 72.5% of the data sheets. In total, 83.1% of procedures were carried out in electrophysiology laboratories (82.1% in 2016, 83.2% in 2015, 83.4% in 2014, 79.8% in 2013, and 81.4% in 2012) and 13.8% in operating rooms. Cardiac electrophysiologists performed 80.6% of implantations (81.2% in 2016, 79.6% in 2015, 81.7% in 2014, 80.7% in 2013, and 81.0% in 2012); surgeons performed 9.2% (5.1% in 2016, 9.6% in 2015, 11% in 2014, 13.8% in 2013, and 14% in 2012), and both specialists together, 6%. Other specialists and intensivists were involved in 2.2% and 2% of procedures, respectively.
Generator Placement SiteThe location of the placement site in first-time implantations was documented in 72.2% of the data forms. Placement was subcutaneous in 96.4% and subpectoral in the remaining 3.6%. In the total number of procedures carried out, the values were 95.4% and 4.6%, respectively.
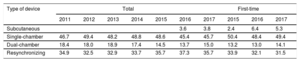
Device TypeThe type of device implanted is shown in Table 4. This information was recorded in 94.3% of the forms submitted to the registry. In 2017, subcutaneous defibrillator implantation was carried out in 5.3% (6.4% in 2016 and 2.4% in 2015).
Percent Distribution of Implanted Devices by Type
| Type of device | Total | First-time | ||||||||
|---|---|---|---|---|---|---|---|---|---|---|
| 2011 | 2012 | 2013 | 2014 | 2015 | 2016 | 2017 | 2015 | 2016 | 2017 | |
| Subcutaneous | 3.6 | 3.8 | 2.4 | 6.4 | 5.3 | |||||
| Single-chamber | 46.7 | 49.4 | 48.2 | 48.8 | 48.6 | 45.4 | 45.7 | 50.4 | 48.4 | 49.4 |
| Dual-chamber | 18.4 | 18.0 | 18.9 | 17.4 | 14.5 | 13.7 | 15.0 | 13.2 | 13.0 | 14.1 |
| Resynchronizing | 34.9 | 32.5 | 32.9 | 33.7 | 35.7 | 37.3 | 35.7 | 33.9 | 32.1 | 31.5 |
In the total of 1491 replacements, information was provided for 1102 (73.9%). The most common reason for a replacement procedure was battery depletion (74.8%). Complications prompted 10.5% of replacements (8.8% in 2016, 8.6% in 2015, and 7.9% in 2014 and 2013), and a change of the indication occurred in 14.7%. In the 97 replacements with information on timing, 6.2% were performed before 6 months (9.7% in 2016, 10.2% in 2015, 9.6% in 2014, and 11.6% in 2013).
Information on the status of the leads was provided in 62.6% of replacement notifications; 8.1% (84 records) were malfunctioning, and the leads were explanted in the 17.4% of cases in which this information was submitted.
Device ProgrammingData on the cardiac pacing mode was recorded in 72.2% of forms. The most common pacing mode programmed was VVI (48.2%), followed by DDD (29.6%), VVIR (9.9%), DDDR (5.4%), and others (1.9%), mainly algorithms to prevent ventricular pacing.
A ventricular fibrillation induction test was performed in 235 patients; that is, 5.3% (4.1% in 2016, 2.7% in 2015, 2.9% in 2014, 5.1% in 2013, and 6.7% in 2012) of the 4464 records providing this data. The mean number of shocks delivered was 1.1. Therefore, the threshold was not calculated in most patients; instead, the device was simply tested to verify proper functioning.
ComplicationsThe development of complications was recorded in 70% of the data forms. Thirty-six complications were described: 10 coronary sinus dissections, 1 cardiac tamponade, 3 pneumothoraces, 4 deaths, and 18 unspecified. The mortality rate was 0.09%, which represents an increase with respect to the 3 previous years (0.02% in 2016, 0.07% in 2015, and 0.05% in 2014), although fortunately, the number remains quite low.
DISCUSSIONThe results of the 2017 Spanish Implantable Cardioverter-Defibrillator Registry show the ICD implantation activity for that year. Compared with previous editions, almost all implantations performed in Spain (98%) during 2017 are represented. The results show considerable differences in the ICD implantation rate per million population between the various autonomous communities, and an overall implantation rate much lower than the European mean. The registry provides valuable information regarding the number of implant procedures performed, the type of implant, the indications for implantation, and the patients’ clinical characteristics.
Comparison With Registries From Previous YearsThe Spanish Implantable Cardioverter-Defibrillator Registry was first published in 2005 with the results of 2002 to 2004. Up to 2010, there was a yearly increase in the total number of ICD procedures carried out,8–14 but in 2011 and 2012, a decrease was documented both in the registry14,15 and the Eucomed data. Starting in 2013, the number of procedures increased, and exceeded the 2010 values in that year (Figure 2 and Figure 3).17 The year 2017 witnessed the largest number of implantations recorded since the creation of the registry. However, the Eucomed data demonstrate that the number of implantations in Spain was actually lower in 2017 than in 2016. This paradox is explained by the larger number of participating centers notifying their results. In Europe there was also a slight reduction in the number of device implantations in 2017, both ICDs and CRT-Ds (311 ICDs/million population in 2017 vs 320 in 2016).22
The 2017 registry data confirm the increase in indications for primary prevention seen in 2016, with 62% of prophylactic indications (Table 3). This change has been slow and gradual, except for a sudden decrease observed in 2013. Over the last 10 years, this indication has increased by 11.3%. In other European registries, primary prevention was also the main indication for ICD implantation, with values around 80%.23,24
In 2016 and for the first time, the percentage of first- time CRT-D implantations decreased (32.1% vs 33.9% in 2015). An even greater reduction (31.1%) was observed in 2017, whereas in neighboring countries, the value was around 40%. There were no substantial changes in the percentage of first-time single-chamber or dual-chamber ICD implantations in 2017 (49% and 14%, respectively) relative to previous years. Last, first-time subcutaneous ICD implantations were performed in 5.3% in 2017, a value slightly lower than that recorded in 2016 (6.4%) and higher than the 2015 value (2.4%). Whether subcutaneous ICD use has stabilized (as the current value may suggest) or whether it will increase in the coming years, will likely depend on the results of ongoing studies that compare this type of ICD with transvenous devices.
The most common indication in 2017 continued to be ischemic heart disease (54%), followed by dilated cardiomyopathy (25.6%). There was a reduction in the percentage of dilated cardiomyopathy cases as the reason for ICD implantation (29.5% in 2016, 28.4% in 2015, 27.3% in 2014, 28.2% 2013, 27.4% in 2012, and 33.9% in 2011). This reduction was produced mainly as a result of the less extensive use of ICDs for primary prevention of sudden cardiac death. It would be difficult not to relate this smaller percentage of ICD use in dilated cardiomyopathy with the results of the DANISH trial.7 In a survey of European cardiologists, more than half the participants stated that they had changed the indication for ICD implantation as primary prevention for sudden death in dilated cardiomyopathy patients based on the results of the DANISH trial.25 However, the guidelines for the treatment of ventricular arrhythmias and prevention of sudden cardiac death published in the United States in 2017 have maintained the indication of ICD use for primary prevention in this patient population (class I, level of evidence A).1 In the opinion of the guideline authors, the data from the DANISH trial should not be applied to patients who do not have an indication for cardiac resynchronization (less than half the patients included in the study). Furthermore, the findings of 2 meta-analyses continue to show a benefit from ICD use in these patients: a 25% reduction in the relative risk of sudden cardiac death.26,27
In 2016 there was a reduction in CRT-D implantations in patients with dilated cardiomyopathy (44.3%). However, similar to the situation in the years before 2016, more than half the implants in these patients were CRT-Ds in 2017 (58.05%).16–19 In ischemic heart disease patients, the percentage of CRT-D implantations was somewhat higher than in previous years (32.0% in 2017, 26.9% in 2016, and 27.7% in 2015).19,20
With the exception of the DANISH trial, there have been no new studies in the last few years that would change the indications for ICD implantation. The indications for ICD and CRT use are well supported in the related clinical practice guidelines.1,3,28 However, the implantation rate per million population does not correspond to the expected rate based on clinical evidence, particularly in Spain.29 In 2010, the implantation rate per million population in Spain was around half that of Europe (116 vs 248); the difference progressively increased over the following years, and it is now 144 vs 320 per million population.22
In contrast to previous years, the 2017 registry provides data on 98% of the implantations reported by Eucomed. This value is clearly higher than the percentages documented from 2007 to 2016, with values around 85%. Currently, almost all hospitals performing ICD placement provide their data to the registry, even without reaching 100% of implantations. The number of implantation centers has increased relative to 2016. Two hospitals have notified more than 200 implantations, 21 hospitals more than 100 (15 in 2016, 11 in 2015, 11 in 2014), and 88 centers, most of them private, less than 10.
There were no changes relative to previous registries regarding the patients’ epidemiologic characteristics. Patients with severe ventricular dysfunction and in NYHA functional class II and III continue to predominate. Furthermore, there were no differences in the implantation setting compared with previous years: 83.1% of procedures were performed in the electrophysiology laboratory (82.1% in 2016, 83.2% in 2015, and 83.4% in 2014), and electrophysiologists carried out implantation in 80.6% (81.2% in 2016, 79.6% in 2015, and 81.7% in 2014).
Differences Between Autonomous CommunitiesThe 2017 data continue to manifest differences between Spain's autonomous communities. The total implantation rate for 2017 in Spain was 135 per million population according to the registry and 138 according to Eucomed; both these values indicate a true reduction in ICD implantation activity in 2017 compared to 2016 (143 per million population according to Eucomed). Rates in the following autonomous communities were above the national average: Cantabria (236), Aragon (177), Principality of Asturias (172), Galicia (170), the Valencian Community (160), the Basque Country (154), Castile-La Mancha (151), Extremadura (146), the Chartered Community of Navarre (146), the Community of Madrid (142), and Castile and León (140). Those below the national average included Andalusia (124), the Region of Murcia (107), the Canary Islands (104), the Balearic Islands (103), Catalonia (120), and La Rioja (89). In 2017 there was a generalized increase in the number of implantations per million population recorded in the various autonomous communities, which, among other reasons, was likely due to the greater representativeness of the registry that year regarding the true number. Only Andalusia (102 vs 124 in 2016) and Extremadura (146 vs 166 in 2016) showed a lower rate of implantations per million population relative to 2016, whereas Asturias maintained similar values. The difference between the communities with the highest and lowest implantation rate has increased from the 2016 value (236 vs 89 in 2017 compared to 173 vs 80 in 2016).
The 2017data show that the number of implantations per million population held steady or decreased compared with the trend observed up to 2016. The persistent differences between autonomous communities and the even greater difference with respect to Europe are a particular cause for concern. A direct relationship cannot be established between the gross domestic product of each community and the number of implantations, as in some cases, communities with higher incomes show values below the average, and the opposite occurs in some of those with lower incomes. Some communities with above average activity are the least populated, as is the case of Cantabria. Nonetheless, others, such as the Community of Madrid or the Valencian Community, are exceptions to this correlation, being highly populated communities with implantation rates above the national average. Nor is there a relationship with the incidence of ischemic heart disease or heart failure in the various communities. These differences may be explained by other factors, such as the health care organization in each community, the number of arrhythmia units, and the distribution of referrals.
Comparison With Other CountriesThe device implantation rate in countries participating in Eucomed was 311 per million population (320 in 2016), including both ICDs and CRT-Ds. Germany, with 510 devices per million population, remained as the country with the largest number of implantations. Spain (138 implantations/million) was the country with the smallest number. The following countries showed higher than average rates: the Czech Republic (418), Italy (412), Denmark (378), the Netherlands (362), and Poland (332). Those with rates below the average included Ireland (280), Austria (256), Sweden (256), Belgium (244), Finland (241), Norway (231), the United Kingdom (227), Switzerland (219), France (218), Portugal (201), Greece (186), and in last place, Spain (138). The difference in the implantation rate in Spain relative to the European average was maintained in 2017 (138 vs 311, compared with 144 vs 320 in 2016 and 138 vs 315 in 2015). Once again, the continuous increase in the difference between Spain and the next to last country (138 vs 186) is striking.
The CRT-D implantation rate was 124 per million population (119 in 2016, 126 in 2015, 119 in 2014, and 113 in 2013). Germany (204 implantations) remained in first place, whereas Spain (49) had the lowest rate of these implantations.
The percentage of CRT-D implantations varied with respect to the total, with values of 29% in Ireland and Denmark, 31% in Poland, and 46% in the Czech Republic. The European average was 40%. Several countries were above this average, including France, Portugal, Switzerland, Great Britain, Germany, Italy, and the Czech Republic. Ireland and Poland had a rate below 30%. The rate in Spain was 36%.
Our neighboring countries have the same regional differences24,30,31 as those seen in the Spanish registry, and there is no explanation for this fact. The number of available arrhythmia units has been suggested, but this is not a clearly related factor, at least in Spain, as certain communities with a large number of available units had smaller implantation rates. Other explanations, such as the income level, also fail to show a relationship. Countries such as Ireland, the Czech Republic, and Poland show values well above the implantation rate in Spain. The prevalence of cardiovascular diseases, the ease of access and organization of the health care system, and the degree of acceptance and adherence to clinical practice guidelines may be related to the implantation rate in Spain and its variability.
LimitationsThe 2017 registry collected information from more than 97% of the implantations performed, a higher percentage than in previous years. Nonetheless, compliance with reporting on individual items was uneven. In 2018, we expect that the change in data collection through the website can be implemented, which may improve the results and clinical usefulness of the registry.
Last, we mention that the percentage of complications notified does not reflect the true situation. The data are recorded during or immediately following the implantation procedure; hence, most subacute complications are not collected.
Future Directions of the Spanish Implantable Cardioverter-defibrillator RegistryThis registry is the 14th official report. The long life of this undertaking should be a source of satisfaction for the members of the SEC Electrophysiology and Arrhythmia Section that have contributed to its success. The ongoing modernization of the registry will make it possible to obtain more and better information with less effort by those involved. The quality of the data will improve with computerized collection, and notification of some items may become obligatory. This will facilitate more ambitious clinical objectives and enable inclusion of parameters such as mortality, shock delivery, and complications, to provide further important clinical information.
CONCLUSIONSThe 2017 Spanish Implantable Cardioverter-defibrillator Registry has collated
information on nearly 98% of ICD implantations carried out in Spain, which represents almost the total activity and current indications for this therapy. Following several years of growth in the number of implantations performed per million population, this rate decreased in 2017. As in previous years, the total number of implantations performed in Spain was much lower than the European mean, and the gap has continued to widen. In addition, notable differences in this activity persist between Spain's autonomous communities.
CONFLICTS OF INTERESTSI. Fernández Lozano has participated in clinical studies sponsored by Medtronic, Abbott, Biotronik and Sorin, and has held fellowships from the SEC and the Foundation for Cardiovascular Research. J. Osca Asensi has participated in clinical studies sponsored by Abbott, Boston, and Biotronik. J. Alzueta Rodríguez has participated in communications sponsored by Boston and has held fellowships from FIMABIS.