To present the findings of the Spanish Implantable Cardioverter-defibrillator Registry for 2013 compiled by the Electrophysiology and Arrhythmias Section of the Spanish Society of Cardiology.
MethodsProspective data were voluntarily recorded on a data collection form and sent to the Spanish Society of Cardiology by each implantation team.
ResultsOverall, 4772 device implantations were reported, representing 85% of the estimated total number of implantations. The reported implantation rate was 102 per million population and the estimated total implantation rate was 120 per million. The proportion of first implantations was 68.8%. Data were received from 154 hospitals (4 fewer than in 2012). Most implantable cardioverter-defibrillator recipients were men (83.3%). The mean age was 62.5 (13.4) years. Most patients had severe or moderate-to-severe ventricular dysfunction and were in New York Heart Association functional class II. The most frequent underlying cardiac condition was ischemic heart disease, followed by dilated cardiomyopathy. Indications for primary prevention accounted for 53.0% of first implantations, consolidating the decrease first observed in 2012. Overall, 79.8% of devices were implanted by cardiac electrophysiologists.
ConclusionsThe 2013 Spanish Implantable Cardioverter-defibrillator Registry includes information on 85% of the devices implanted in Spain. The total number of implantations increased compared with the previous 2 years. The percentage of implantations for primary prevention indications decreased compared with the previous year.
Keywords
Implantable cardioverter-defibrillators (ICD) have demonstrated usefulness in the primary and secondary prevention of sudden cardiac death. The results of several studies have allowed the main indications for ICD implantation to be defined and included in the successive clinical practice guidelines for the management of patients with ventricular arrhythmias or at risk of sudden cardiac death.1–3 However, the increased use of these devices has raised questions on their effectiveness outside the setting of clinical trials, the appropriate selection of patients for implantation in the real world, access to this treatment, and its safety and cost-effectiveness.4 Because there is Little information in the literatura on these questions and on the application of clinical guidelines in unselected patient populations, health registries can be highly useful in clarifying these issues.
This study presents the data on ICD implantation reported to the Spanish Implantable Cardioverter-defibrillator Registry in 2012. Most centers implanting ICD in Spain have collaborated with this registry. As in the case of the official reports describing the activity of previous years,5–12 this report has been prepared by members of the Electrophysiology and Arrhythmias Section of the Spanish Society of Cardiology (SEC, Sociedad Española de Cardiología).
The main aim of this registry is to identify the current use of ICDs in Spain, focusing on indications, the patients’ clinical characteristics, implantation data, types of devices and their programming, and procedural complications.
METHODSData for the registry were collected on a form available on the SEC web site.13 Each ICD implantation team directly and voluntarily completed the form during or after the procedure, in collaboration with technical staff at the ICD manufacturer.
The information was entered in the Spanish Implantable Cardioverter-defibrillator Registry database by a technician specifically contracted for this purpose, assisted by a computer specialist from the SEC and a member of the Electrophysiology and Arrhythmias Section, who also carried out data cleaning. The data were analysed by the authors of this article, who are responsible for this publication.
The census data used to calculate the rates per million population for Spain as a whole and for each autonomous community and province were obtained from estimates provided by the Spanish National Institute of Statistics as of 1 January 2013.14
To estimate the representativeness of the registry, the percentage of reported implantations and replacement procedures in relation to the total number of implantations and replacement procedures performed in Spain in 2013 was calculated. The total number was based on the data for 2013 reported to the European Medical Technology Industry Association (EUCOMED) by the firms marketing ICDs in Spain.15
When >1 form of clinical presentation or type of arrhythmia in the same patient was recorded on the data collection form, only the most serious condition was included in the analysis.
The percentages for each variable analyzed were calculated on the basis of the total number of reported implantations that included information on the specific variable.
Statistical AnalysisNumerical results are expressed as mean (standard deviation) or median [interquartile range], depending on the distribution of the variable. Continuous quantitative variables were compared with analysis of variance or the Kruskal-Wallis test. Qualitative variables were compared with the chi-square test. The relationships between the number of implantations and the number of implantation centers per million population and between the total number of implantations and the number of implantations for primary prevention in each center were evaluated using linear regression models.
RESULTSThe response rates for the various fields on the data collection form ranged from 99.1% for the name of the participating hospital to 18.0% for QRS width.
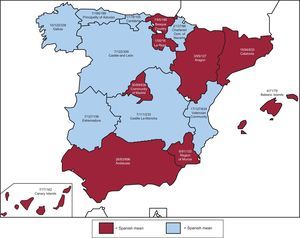
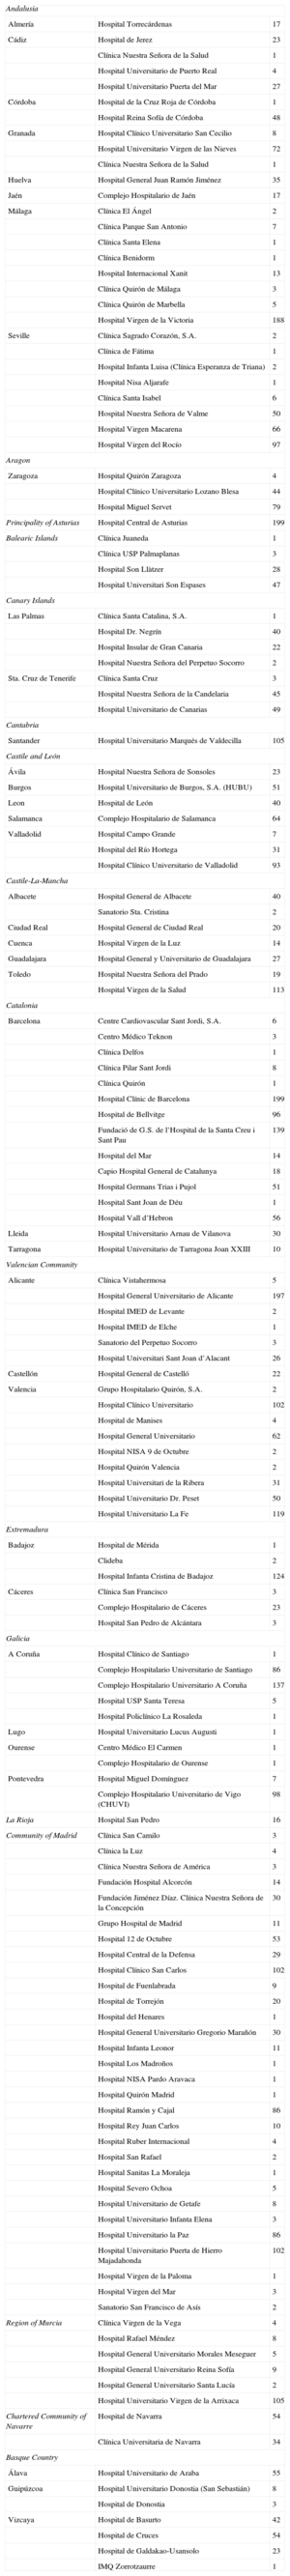
Participating CentersA total of 153 centers performing ICD implantation in Spain participated in the registry (8 fewer than in 2012) (Table 1). This decrease was due to the grouping of several centers into consortia, which provided pooled data. Of the respondents, 90 were public health care centers (103 in 2012). Figure 1 shows the total number of participating centers, the implantation rate per million population, and the total number of implantations by autonomous community according to data collected by the registry. In 2013, only 14 centers implanted > 100 devices; 76 < 10 and, of these, 26 implanted only 1.
Implantations by Autonomous Community, Province, and Hospital
| Andalusia | ||
| Almería | Hospital Torrecárdenas | 17 |
| Cádiz | Hospital de Jerez | 23 |
| Clínica Nuestra Señora de la Salud | 1 | |
| Hospital Universitario de Puerto Real | 4 | |
| Hospital Universitario Puerta del Mar | 27 | |
| Córdoba | Hospital de la Cruz Roja de Córdoba | 1 |
| Hospital Reina Sofía de Córdoba | 48 | |
| Granada | Hospital Clínico Universitario San Cecilio | 8 |
| Hospital Universitario Virgen de las Nieves | 72 | |
| Clínica Nuestra Señora de la Salud | 1 | |
| Huelva | Hospital General Juan Ramón Jiménez | 35 |
| Jaén | Complejo Hospitalario de Jaén | 17 |
| Málaga | Clínica El Ángel | 2 |
| Clínica Parque San Antonio | 7 | |
| Clínica Santa Elena | 1 | |
| Clínica Benidorm | 1 | |
| Hospital Internacional Xanit | 13 | |
| Clínica Quirón de Málaga | 3 | |
| Clínica Quirón de Marbella | 5 | |
| Hospital Virgen de la Victoria | 188 | |
| Seville | Clínica Sagrado Corazón, S.A. | 2 |
| Clínica de Fátima | 1 | |
| Hospital Infanta Luisa (Clínica Esperanza de Triana) | 2 | |
| Hospital Nisa Aljarafe | 1 | |
| Clínica Santa Isabel | 6 | |
| Hospital Nuestra Señora de Valme | 50 | |
| Hospital Virgen Macarena | 66 | |
| Hospital Virgen del Rocío | 97 | |
| Aragon | ||
| Zaragoza | Hospital Quirón Zaragoza | 4 |
| Hospital Clínico Universitario Lozano Blesa | 44 | |
| Hospital Miguel Servet | 79 | |
| Principality of Asturias | Hospital Central de Asturias | 199 |
| Balearic Islands | Clínica Juaneda | 1 |
| Clínica USP Palmaplanas | 3 | |
| Hospital Son Llàtzer | 28 | |
| Hospital Universitari Son Espases | 47 | |
| Canary Islands | ||
| Las Palmas | Clínica Santa Catalina, S.A. | 1 |
| Hospital Dr. Negrín | 40 | |
| Hospital Insular de Gran Canaria | 22 | |
| Hospital Nuestra Señora del Perpetuo Socorro | 2 | |
| Sta. Cruz de Tenerife | Clínica Santa Cruz | 3 |
| Hospital Nuestra Señora de la Candelaria | 45 | |
| Hospital Universitario de Canarias | 49 | |
| Cantabria | ||
| Santander | Hospital Universitario Marqués de Valdecilla | 105 |
| Castile and León | ||
| Ávila | Hospital Nuestra Señora de Sonsoles | 23 |
| Burgos | Hospital Universitario de Burgos, S.A. (HUBU) | 51 |
| Leon | Hospital de León | 40 |
| Salamanca | Complejo Hospitalario de Salamanca | 64 |
| Valladolid | Hospital Campo Grande | 7 |
| Hospital del Río Hortega | 31 | |
| Hospital Clínico Universitario de Valladolid | 93 | |
| Castile-La-Mancha | ||
| Albacete | Hospital General de Albacete | 40 |
| Sanatorio Sta. Cristina | 2 | |
| Ciudad Real | Hospital General de Ciudad Real | 20 |
| Cuenca | Hospital Virgen de la Luz | 14 |
| Guadalajara | Hospital General y Universitario de Guadalajara | 27 |
| Toledo | Hospital Nuestra Señora del Prado | 19 |
| Hospital Virgen de la Salud | 113 | |
| Catalonia | ||
| Barcelona | Centre Cardiovascular Sant Jordi, S.A. | 6 |
| Centro Médico Teknon | 3 | |
| Clínica Delfos | 1 | |
| Clínica Pilar Sant Jordi | 8 | |
| Clínica Quirón | 1 | |
| Hospital Clínic de Barcelona | 199 | |
| Hospital de Bellvitge | 96 | |
| Fundació de G.S. de l’Hospital de la Santa Creu i Sant Pau | 139 | |
| Hospital del Mar | 14 | |
| Capio Hospital General de Catalunya | 18 | |
| Hospital Germans Trias i Pujol | 51 | |
| Hospital Sant Joan de Déu | 1 | |
| Hospital Vall d’Hebron | 56 | |
| Lleida | Hospital Universitario Arnau de Vilanova | 30 |
| Tarragona | Hospital Universitario de Tarragona Joan XXIII | 10 |
| Valencian Community | ||
| Alicante | Clínica Vistahermosa | 5 |
| Hospital General Universitario de Alicante | 197 | |
| Hospital IMED de Levante | 2 | |
| Hospital IMED de Elche | 1 | |
| Sanatorio del Perpetuo Socorro | 3 | |
| Hospital Universitari Sant Joan d’Alacant | 26 | |
| Castellón | Hospital General de Castelló | 22 |
| Valencia | Grupo Hospitalario Quirón, S.A. | 2 |
| Hospital Clínico Universitario | 102 | |
| Hospital de Manises | 4 | |
| Hospital General Universitario | 62 | |
| Hospital NISA 9 de Octubre | 2 | |
| Hospital Quirón Valencia | 2 | |
| Hospital Universitari de la Ribera | 31 | |
| Hospital Universitario Dr. Peset | 50 | |
| Hospital Universitario La Fe | 119 | |
| Extremadura | ||
| Badajoz | Hospital de Mérida | 1 |
| Clideba | 2 | |
| Hospital Infanta Cristina de Badajoz | 124 | |
| Cáceres | Clínica San Francisco | 3 |
| Complejo Hospitalario de Cáceres | 23 | |
| Hospital San Pedro de Alcántara | 3 | |
| Galicia | ||
| A Coruña | Hospital Clínico de Santiago | 1 |
| Complejo Hospitalario Universitario de Santiago | 86 | |
| Complejo Hospitalario Universitario A Coruña | 137 | |
| Hospital USP Santa Teresa | 5 | |
| Hospital Policlínico La Rosaleda | 1 | |
| Lugo | Hospital Universitario Lucus Augusti | 1 |
| Ourense | Centro Médico El Carmen | 1 |
| Complejo Hospitalario de Ourense | 1 | |
| Pontevedra | Hospital Miguel Domínguez | 7 |
| Complejo Hospitalario Universitario de Vigo (CHUVI) | 98 | |
| La Rioja | Hospital San Pedro | 16 |
| Community of Madrid | Clínica San Camilo | 3 |
| Clínica la Luz | 4 | |
| Clínica Nuestra Señora de América | 3 | |
| Fundación Hospital Alcorcón | 14 | |
| Fundación Jiménez Díaz. Clínica Nuestra Señora de la Concepción | 30 | |
| Grupo Hospital de Madrid | 11 | |
| Hospital 12 de Octubre | 53 | |
| Hospital Central de la Defensa | 29 | |
| Hospital Clínico San Carlos | 102 | |
| Hospital de Fuenlabrada | 9 | |
| Hospital de Torrejón | 20 | |
| Hospital del Henares | 1 | |
| Hospital General Universitario Gregorio Marañón | 30 | |
| Hospital Infanta Leonor | 11 | |
| Hospital Los Madroños | 1 | |
| Hospital NISA Pardo Aravaca | 1 | |
| Hospital Quirón Madrid | 1 | |
| Hospital Ramón y Cajal | 86 | |
| Hospital Rey Juan Carlos | 10 | |
| Hospital Ruber Internacional | 4 | |
| Hospital San Rafael | 2 | |
| Hospital Sanitas La Moraleja | 1 | |
| Hospital Severo Ochoa | 5 | |
| Hospital Universitario de Getafe | 8 | |
| Hospital Universitario Infanta Elena | 3 | |
| Hospital Universitario la Paz | 86 | |
| Hospital Universitario Puerta de Hierro Majadahonda | 102 | |
| Hospital Virgen de la Paloma | 1 | |
| Hospital Virgen del Mar | 3 | |
| Sanatorio San Francisco de Asís | 2 | |
| Region of Murcia | Clínica Virgen de la Vega | 4 |
| Hospital Rafael Méndez | 8 | |
| Hospital General Universitario Morales Meseguer | 5 | |
| Hospital General Universitario Reina Sofía | 9 | |
| Hospital General Universitario Santa Lucía | 2 | |
| Hospital Universitario Virgen de la Arrixaca | 105 | |
| Chartered Community of Navarre | Hospital de Navarra | 54 |
| Clínica Universitaria de Navarra | 34 | |
| Basque Country | ||
| Álava | Hospital Universitario de Araba | 55 |
| Guipúzcoa | Hospital Universitario Donostia (San Sebastián) | 8 |
| Hospital de Donostia | 3 | |
| Vizcaya | Hospital de Basurto | 42 |
| Hospital de Cruces | 54 | |
| Hospital de Galdakao-Usansolo | 23 | |
| IMQ Zorrotzaurre | 1 | |

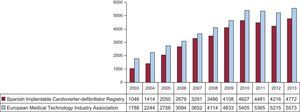
In total, 4772 first and replacement implantations were performed in 2013, more than in 2012 (4216). According to EUCOMED data,14 this figure represents 85.6% of the total of 5573 ICD implantations carried out in 2013 in Spain. Figure 2 shows the total number of implantations reported to the registry and the number estimated by EUCOMED over the last 11 years.
.")
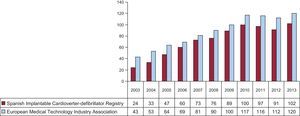
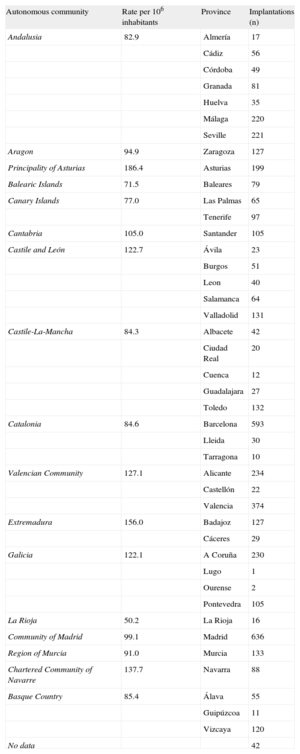
The implantation rate recorded in the registry was 102,1 per million population, while the rate according to the EUCOMED data was 120 per million population. Figure 3 shows the changes occurring in the implantation rate per million population over the last 11 years according to the registry and EUCOMED data. Table 1 shows the number of implantations reported to the registry by each participating center. Table 2 lists the number of implantations performed in each province and the rate per million population for the corresponding autonomous community.
.")
Implantations by Autonomous Community and Province
| Autonomous community | Rate per 106 inhabitants | Province | Implantations (n) |
| Andalusia | 82.9 | Almería | 17 |
| Cádiz | 56 | ||
| Córdoba | 49 | ||
| Granada | 81 | ||
| Huelva | 35 | ||
| Málaga | 220 | ||
| Seville | 221 | ||
| Aragon | 94.9 | Zaragoza | 127 |
| Principality of Asturias | 186.4 | Asturias | 199 |
| Balearic Islands | 71.5 | Baleares | 79 |
| Canary Islands | 77.0 | Las Palmas | 65 |
| Tenerife | 97 | ||
| Cantabria | 105.0 | Santander | 105 |
| Castile and León | 122.7 | Ávila | 23 |
| Burgos | 51 | ||
| Leon | 40 | ||
| Salamanca | 64 | ||
| Valladolid | 131 | ||
| Castile-La-Mancha | 84.3 | Albacete | 42 |
| Ciudad Real | 20 | ||
| Cuenca | 12 | ||
| Guadalajara | 27 | ||
| Toledo | 132 | ||
| Catalonia | 84.6 | Barcelona | 593 |
| Lleida | 30 | ||
| Tarragona | 10 | ||
| Valencian Community | 127.1 | Alicante | 234 |
| Castellón | 22 | ||
| Valencia | 374 | ||
| Extremadura | 156.0 | Badajoz | 127 |
| Cáceres | 29 | ||
| Galicia | 122.1 | A Coruña | 230 |
| Lugo | 1 | ||
| Ourense | 2 | ||
| Pontevedra | 105 | ||
| La Rioja | 50.2 | La Rioja | 16 |
| Community of Madrid | 99.1 | Madrid | 636 |
| Region of Murcia | 91.0 | Murcia | 133 |
| Chartered Community of Navarre | 137.7 | Navarra | 88 |
| Basque Country | 85.4 | Álava | 55 |
| Guipúzcoa | 11 | ||
| Vizcaya | 120 | ||
| No data | 42 |
The name of the participating center was reported in 99% of the cases. Most procedures, 4398 (92%), were performed in public centers.
First Implantation vs Replacement ProceduresThis information was reported in 4334 data forms sent to the SEC (91%). There were 2981 first implantations, representing 68.8% of the total (69.4% in 2012; 70.2% in 2011 and 73.8% in 2010). The rate of first implantations in 2013 was 63.8 per million population (64 per million population in 2012, equalling that in 2011).
Age and SexThe mean age (standard deviation) [range] of patients receiving an ICD or replacement device was 62.6 (13.4) [7-90] years. In first implantations, the mean age was 61.3 (13.4) years. Most of the patients were men, representing 83.3% of all patients, and 83.7% of patients receiving a first implantation.
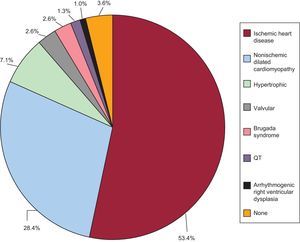
Underlying Heart Disease, Left Ventricular Ejection Fraction, Functional Class, and Baseline RhythmThe most common underlying cardiac condition in first implantations was ischemic heart disease (53.4%), followed by dilated cardiomyopathy (28.4%), hypertrophic cardiomyopathy (7.1%), primary conduction abnormalities (Brugada syndrome, idiopathic ventricular fibrillation and long QT syndrome) (7.5%) and, in lower percentages, valvular heart disease and arrhythmogenic dysplasia (Figure 4).
.")
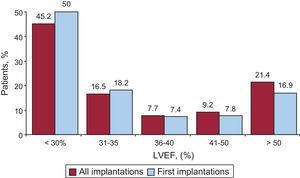
Regarding left ventricular function in patients undergoing a first implantation, left ventricular ejection fraction was < 30% in 50.0%; 30%-40% in 25.6%; 41%–50% in 7.8%, and > 50% in 16.2%. The distribution was similar in patients receiving a replacement ICD (Figure 5). This information was reported in 85.5% of the data collection forms.
. LVEF, left ventricular ejection fraction.")
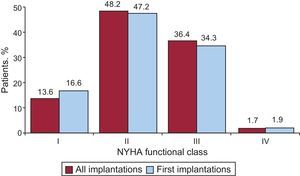
Regarding New York Heart Association (NYHA) functional class, most patients were in NYHA II (47.2%), followed by NYHA III (34.3%), NYHA I (16.6%), and NYHA IV (1.9%). In this variable, the distribution between the total number of implantations and first implantations was also very similar (Figure 6). This information was reported in 75.6% of the data collection forms.
. NYHA, New York Heart Association.")
The baseline cardiac rhythm, recorded in 80.5% of the patients, was mainly sinus rhythm (81.3%), followed by atrial fibrillation (16.1%) and paced rhythm (2.1%); the remaining patients had other rhythms (atrial flutter and other arrhythmias).
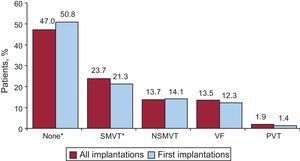
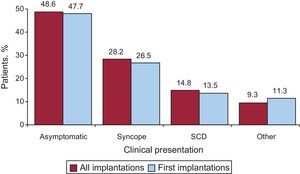
Clinical Arrhythmia Prompting Device Placement, Form of Presentation, and Electrical Stimulation-Induced ArrhytmiasThis information was reported in 80.7% of the data collection forms. In first implantations, the largest group consisted of patients with no documented clinical arrhythmia (50.8%), followed by those with sustained monomorphic ventricular tachycardia, nonsustained ventricular tachycardia, and ventricular fibrillation (21.3%, 14.1% and 12.3%, respectively). Among the total number of implantation procedures performed, 50.8% of devices were placed in patients without documented clinical arrhythmia (Figure 7). Differences in the type of arrhythmia between patients receiving a first implantation and the overall group of patients were statistically significant for patients without arrhythmia (P<.001) and those with sustained monomorphic ventricular tachycardia (P<.001) but not for patients with nonsustained ventricular tachycardia or ventricular fibrillation. The most common clinical presentation in the overall group and the first-implantation group (62.2% and 68.9% completed responses) was asymptomatic, followed by syncope, sudden cardiac death, and “other symptoms” (Figure 8).
. NSMVT, nonsustained monomorphic ventricular tachycardia; PVT, polymorphic ventricular tachycardia; SMVT, sustained monomorphic ventricular tachycardia; VF, ventricular fibrillation. *P<.001.")
Distribution of arrhythmias prompting device implantation (first implantations and all implantations). NSMVT, nonsustained monomorphic ventricular tachycardia; PVT, polymorphic ventricular tachycardia; SMVT, sustained monomorphic ventricular tachycardia; VF, ventricular fibrillation. *P<.001.
. SCD, sudden cardiac death.")
Information on electrophysiological studies was available in 2244 patients receiving a first implantation (86.4%). Electrophysiological studies were conducted in only 305 patients (13.6%).The most frequently induced arrhythmia was sustained monomorphic ventricular tachycardia (47.9%), followed by ventricular fibrillation (11.8%) and, to a lesser extent, nonsustained ventricular tachycardia (10.7%), and other arrhythmias (3.7%). No arrhythmia was induced in 26.1% of electrophysiological studies, which were mainly carried out in patients with ischemic heart disease and dilated cardiomyopathy.
Clinical HistorySeveral new fields related to the patients’ clinical history have been incorporated in the data collection form since 2011.
For patients with first implantations, between 64.5% and 80.4% of these fields were completed, with the following results: hypertension, 58.4%; hypercholesterolemia, 50.2%; smoking, 33.2%; diabetes mellitus, 29.8%; a history of atrial fibrillation, 26.4%; kidney failure, 13.8%; a history of sudden cardiac death, 8.5%, and stroke, 6.8%.
The QRS interval was documented in 47.9% of the records (mean value 124.1 [35ms]). The QRS interval was > 140ms in 31.1% of the patients. Of these, 79.6% in the first implantation group (80.2% of the overall group) had a combined resynchronization/ICD (ICD-CRT [cardiac resynchronization therapy]) device.
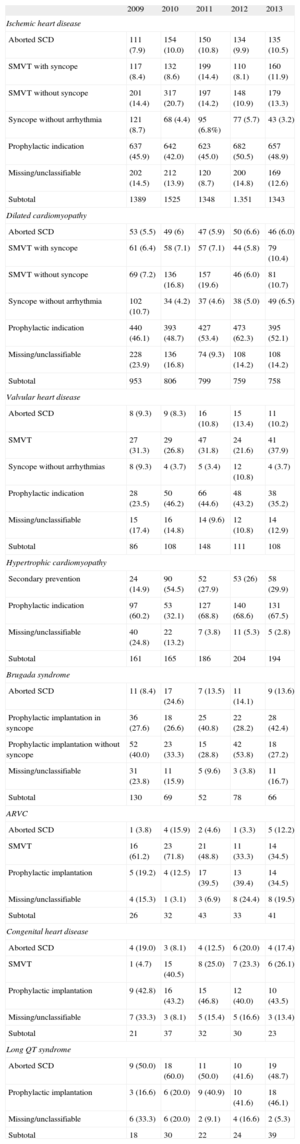
IndicationsTable 3 shows changes in first implantations by type of heart disease and form of presentation from 2009 to 2013. This information was reported in 93% of the data collection forms. In ischemic heart disease, the most frequent indication was primary prevention (48.8%), with no increase compared with the previous year (50.5%). The main indication in dilated cardiomyopathy was also primary prevention (52.1% vs 62.3% in 2012 and 53.4% in 2010). In less common heart diseases, the most frequent indication was primary prevention of hypertrophic cardiomyopathy and Brugada syndrome and other channelopathies. In congenital heart disease and valvular heart disease, the most frequent indication was secondary prevention.
Number of First Implantations According to the Type of Heart Disease, Type of Clinical Arrhythmia, and Form of Presentation (2009–2013)
| 2009 | 2010 | 2011 | 2012 | 2013 | |
| Ischemic heart disease | |||||
| Aborted SCD | 111 (7.9) | 154 (10.0) | 150 (10.8) | 134 (9.9) | 135 (10.5) |
| SMVT with syncope | 117 (8.4) | 132 (8.6) | 199 (14.4) | 110 (8.1) | 160 (11.9) |
| SMVT without syncope | 201 (14.4) | 317 (20.7) | 197 (14.2) | 148 (10.9) | 179 (13.3) |
| Syncope without arrhythmia | 121 (8.7) | 68 (4.4) | 95 (6.8%) | 77 (5.7) | 43 (3.2) |
| Prophylactic indication | 637 (45.9) | 642 (42.0) | 623 (45.0) | 682 (50.5) | 657 (48.9) |
| Missing/unclassifiable | 202 (14.5) | 212 (13.9) | 120 (8.7) | 200 (14.8) | 169 (12.6) |
| Subtotal | 1389 | 1525 | 1348 | 1.351 | 1343 |
| Dilated cardiomyopathy | |||||
| Aborted SCD | 53 (5.5) | 49 (6) | 47 (5.9) | 50 (6.6) | 46 (6.0) |
| SMVT with syncope | 61 (6.4) | 58 (7.1) | 57 (7.1) | 44 (5.8) | 79 (10.4) |
| SMVT without syncope | 69 (7.2) | 136 (16.8) | 157 (19.6) | 46 (6.0) | 81 (10.7) |
| Syncope without arrhythmia | 102 (10.7) | 34 (4.2) | 37 (4.6) | 38 (5.0) | 49 (6.5) |
| Prophylactic indication | 440 (46.1) | 393 (48.7) | 427 (53.4) | 473 (62.3) | 395 (52.1) |
| Missing/unclassifiable | 228 (23.9) | 136 (16.8) | 74 (9.3) | 108 (14.2) | 108 (14.2) |
| Subtotal | 953 | 806 | 799 | 759 | 758 |
| Valvular heart disease | |||||
| Aborted SCD | 8 (9.3) | 9 (8.3) | 16 (10.8) | 15 (13.4) | 11 (10.2) |
| SMVT | 27 (31.3) | 29 (26.8) | 47 (31.8) | 24 (21.6) | 41 (37.9) |
| Syncope without arrhythmias | 8 (9.3) | 4 (3.7) | 5 (3.4) | 12 (10.8) | 4 (3.7) |
| Prophylactic indication | 28 (23.5) | 50 (46.2) | 66 (44.6) | 48 (43.2) | 38 (35.2) |
| Missing/unclassifiable | 15 (17.4) | 16 (14.8) | 14 (9.6) | 12 (10.8) | 14 (12.9) |
| Subtotal | 86 | 108 | 148 | 111 | 108 |
| Hypertrophic cardiomyopathy | |||||
| Secondary prevention | 24 (14.9) | 90 (54.5) | 52 (27.9) | 53 (26) | 58 (29.9) |
| Prophylactic indication | 97 (60.2) | 53 (32.1) | 127 (68.8) | 140 (68.6) | 131 (67.5) |
| Missing/unclassifiable | 40 (24.8) | 22 (13.2) | 7 (3.8) | 11 (5.3) | 5 (2.8) |
| Subtotal | 161 | 165 | 186 | 204 | 194 |
| Brugada syndrome | |||||
| Aborted SCD | 11 (8.4) | 17 (24.6) | 7 (13.5) | 11 (14.1) | 9 (13.6) |
| Prophylactic implantation in syncope | 36 (27.6) | 18 (26.6) | 25 (40.8) | 22 (28.2) | 28 (42.4) |
| Prophylactic implantation without syncope | 52 (40.0) | 23 (33.3) | 15 (28.8) | 42 (53.8) | 18 (27.2) |
| Missing/unclassifiable | 31 (23.8) | 11 (15.9) | 5 (9.6) | 3 (3.8) | 11 (16.7) |
| Subtotal | 130 | 69 | 52 | 78 | 66 |
| ARVC | |||||
| Aborted SCD | 1 (3.8) | 4 (15.9) | 2 (4.6) | 1 (3.3) | 5 (12.2) |
| SMVT | 16 (61.2) | 23 (71.8) | 21 (48.8) | 11 (33.3) | 14 (34.5) |
| Prophylactic implantation | 5 (19.2) | 4 (12.5) | 17 (39.5) | 13 (39.4) | 14 (34.5) |
| Missing/unclassifiable | 4 (15.3) | 1 (3.1) | 3 (6.9) | 8 (24.4) | 8 (19.5) |
| Subtotal | 26 | 32 | 43 | 33 | 41 |
| Congenital heart disease | |||||
| Aborted SCD | 4 (19.0) | 3 (8.1) | 4 (12.5) | 6 (20.0) | 4 (17.4) |
| SMVT | 1 (4.7) | 15 (40.5) | 8 (25.0) | 7 (23.3) | 6 (26.1) |
| Prophylactic implantation | 9 (42.8) | 16 (43.2) | 15 (46.8) | 12 (40.0) | 10 (43.5) |
| Missing/unclassifiable | 7 (33.3) | 3 (8.1) | 5 (15.4) | 5 (16.6) | 3 (13.4) |
| Subtotal | 21 | 37 | 32 | 30 | 23 |
| Long QT syndrome | |||||
| Aborted SCD | 9 (50.0) | 18 (60.0) | 11 (50.0) | 10 (41.6) | 19 (48.7) |
| Prophylactic implantation | 3 (16.6) | 6 (20.0) | 9 (40.9) | 10 (41.6) | 18 (46.1) |
| Missing/unclassifiable | 6 (33.3) | 6 (20.0) | 2 (9.1) | 4 (16.6) | 2 (5.3) |
| Subtotal | 18 | 30 | 22 | 24 | 39 |
ARVC, arrhythmogenic right ventricular cardiomyopathy; SCD, sudden cardiac death; SMVT, sustained monomorphic ventricular tachycardia.
Data are expressed as No. (%).
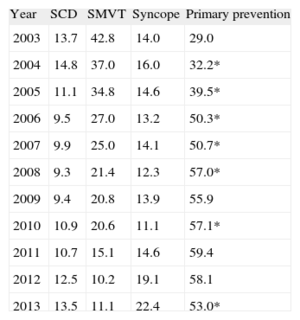
The indication for implantation was reported in 82.1% of the data collection forms. Most first implantations were indicated for primary prevention (53.0%); this was the second year that the number of implantations decreased for this indication. This trend has been increasing and was statistically significant (P<.01) until 2008, between 2009 and 2010, and became significant again in 2013 (Table 4).
Changes in the Main Indications for Implantable Cardioverter-defibrillator Placement (First Implantations, 2003-2013)
| Year | SCD | SMVT | Syncope | Primary prevention |
| 2003 | 13.7 | 42.8 | 14.0 | 29.0 |
| 2004 | 14.8 | 37.0 | 16.0 | 32.2* |
| 2005 | 11.1 | 34.8 | 14.6 | 39.5* |
| 2006 | 9.5 | 27.0 | 13.2 | 50.3* |
| 2007 | 9.9 | 25.0 | 14.1 | 50.7* |
| 2008 | 9.3 | 21.4 | 12.3 | 57.0* |
| 2009 | 9.4 | 20.8 | 13.9 | 55.9 |
| 2010 | 10.9 | 20.6 | 11.1 | 57.1* |
| 2011 | 10.7 | 15.1 | 14.6 | 59.4 |
| 2012 | 12.5 | 10.2 | 19.1 | 58.1 |
| 2013 | 13.5 | 11.1 | 22.4 | 53.0* |
SCD, sudden cardiac death; SMVT, sustained monomorphic ventricular tachycardia.
*Significant difference compared with the previous year (P<.001).
Information on these items was reported in 82.5% of the data collection forms. Implantations were mainly (79.8%) carried out in the electrophysiology laboratory (81.4% in 2012, 76.4% in 2011), followed by the operating room (18.4%). The procedure was carried out by electrophysiologists in 80.7% of implantations (81.0% in 2012, 78.4% in 2011), surgeons in 13.8% (14.0% in 2012, 15.5% in 2011), both specialists in 2.0%, and other specialists and intensivists in 2.0% and 1.6%, respectively.
Generator Implantation SiteInformation on the generator implantation site in first implantations was reported in 2575 (28.8%) data collection forms. The generator was placed subcutaneously in 94.6% of procedures and in a subpectoral position in the remaining 5.4%. Among the total number of devices implanted, these percentages were 93.5% and 6.5%, respectively.
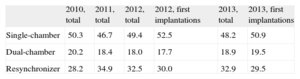
Type of DeviceThis information was reported in 91.4% of the data collection forms and is summarized in Table 5. Single/chamber ICDs were implanted in 48.2% (49.4% in 2012 and 46.7% in 2011). Dual-chambers were implanted in 18.9% (18.0% in 2012 and 18.4% in 2011) and ICD-CRT were implanted in 32.9% (32.5% in 2012 and 34.9% in 2011).
Distribution (%) of the Types of Implantable Cardioverter-defibrillators Placed
| 2010, total | 2011, total | 2012, total | 2012, first implantations | 2013, total | 2013, first implantations | |
| Single-chamber | 50.3 | 46.7 | 49.4 | 52.5 | 48.2 | 50.9 |
| Dual-chamber | 20.2 | 18.4 | 18.0 | 17.7 | 18.9 | 19.5 |
| Resynchronizer | 28.2 | 34.9 | 32.5 | 30.0 | 32.9 | 29.5 |
In patients with ischemic heart disease, 74.8% of the devices were single- or dual-chamber devices (72.3% in 2012) and 25.5% were ICD-CRT (27.7% in 2012). In patients with dilated cardiomyopathy, 51.7% of the devices were ICD-CRTs (56.5% in 2012 and 59.7% in 2011).
Reasons for Device Replacement, Need for Replacement, and Use of Additional LeadsAmong 1,353 replacement procedures, information was available for 1,035 (86.9%). The most common reason was battery depletion in 86.9%, followed by complications in 7.9% and change of indication in 5.1%. Of the 69 cases of early replacement procedures reported, 11.6% were carried out within 6 months of the implantation procedure.
In 65% of the replacement reports, information was provided on the status of the leads; 9.3% (82 records) were malfunctioning. Among cases in which malfunctioning was reported, lead extraction was performed in 46%.
Implantable Cardioverter-defibrillator ProgrammingInformation on this ítem was reported in 73.5% of the data collection forms. The most commonly used pacing was VVI mode (56.6%), followed by DDD mode (29.3%), VVIR mode (7.0%), DDDR mode (4.9%), and other pacing modes, mainly preventive algorithms for ventricular pacing (2.2%)
Information on induction of ventricular fibrillation was reported in 3850 data collection forms and 197 patients (5.1%) underwent this procedure (6.7% in 2012). The mean threshold was 20.4 (6.5) (20.5 [7.1] in 2012) and the mean number of shocks delivered was 1.3.
ComplicationsInformation on complications was provided in 79.4% of the data collection forms. In total, 26 complications were described: 6 coronary sinus dissections, 3 pneumothorax, 2 deaths, 2 cases of tamponade, and 13 cases of unspecified complications. The mortality rate was 0.05%, similar to that reported for the previous year (0. 08%).
DISCUSSIONThe results of the 2013 Spanish Implantable Cardioverter-defibrillator Registry continue to show an acceptable level of representativeness. The information provided is reliable regarding the number of implantations, the type of device, indications, and the patients’ clinical characteristics.
Comparison With Registries for Previous YearsThe first Spanish Implantable Cardioverter-defibrillator Registry was published in 2005 and presented the results for the period 2002-2004.4 The number of ICDs implanted increased each year until 2010,5–10 and decreased in 2011 and 2012. This decrease was observed in the total number of devices implanted in Spain, both in the registry data,11,12 and in the results reported by EUCOMED. In 2013, the number of implantations increased again, exceeding the number reported to the registry in 2010. In Europe, a slight increase has been maintained, both in the number of ICD implantations and in ICD-CRTs.14
Despite the increase in the number of devices implanted, for the second consecutive year, the number of implantations indicated for primary prevention decreased compared with 201212 (53.0% vs 58.1%).
The percentage of ICD-CRT implantations reached a plateau (32.9% vs 32.5% in 2012), as did the percentage of single-chamber ICD implantations (48.2% vs 49.4% in 2012). There was practically no change in the use of dual-chamber ICDs (18.9% vs 18.0%). The rate of ICD-CRT implantation seems to have become stabilized within ICD therapy, and no major changes are expected, unless produced by potential new indications. These data may also be modified in future registries by the arrival of subcutaneous ICDs.
The most common indication for ICD implantation continued to be ischemic heart disease (53.4%), followed by dilated cardiomyopathy (28.2%). As in previous years,12 more than half of the implantations in patients with dilated cardiomyopathy were ICD-CRTs (51.6%), whereas the percentage was lower in patients with ischemic heart disease (25.1%).
The progressive increase in the number of ICD implantations came to a halt in 2011 and 2012. The results of 2013 show a certain recovery: the total number of implantations slightly exceeded the rate per million population for 2010 (102 vs 100).15 In the last few years, no new studies have been published that would modify the indications for ICD implantation. The Multicenter Automatic Defibrillator Implantation Trial II16 was published in 2002, and the Comparison of Medical Therapy, Pacing and Defibrillation in Heart Failure trial17 and the Sudden Cardiac Death in Heart Failure Trial18 in 2005 and 2006, respectively, which laid down the current indications in primary prevention and cardiac resynchronization and led to a progressive rise in the number of implantations during that decade. The indications for ICD and CRT implantation are well supported by clinical practice guidelines.19–22 However, the implantation rate per million population does not correspond to the rate that could be expected from the clinical evidence, either in Spain or in neighboring countries,23 and this tendency has become more marked over time, both in Spain and elsewhere in Europe.
As in previous registries, there are differences in the number of implantations recorded in the present registry and the EUCOMED data, although these differences decreased in 2013 (85.0% vs 80.4% in 2012), despite a slight reduction in the number of participating centers. Most hospitals implanting ICDs send data to the registry, but the rate has not yet reached 100% of implanting centers. Moreover, some data are lost while being sent and processed. All these reasons may explain the differences between the present registry and the EUCOMED data.
The number of participating centers decreased slightly compared with 2012, mainly due to the grouping of several hospitals, which submitted pooled data. None of the hospitals reported an implantation rate > 200; 14 hospitals (8 in 2012 and 11 in 2011) reported > 100 implantations, and 72 centers—mostly private centers—reported < 10 implantations. Some studies show a relationship between implantation volume and the number of complications,24 with a higher implantation volume being associated with a lower complications rate.
There were no significant changes in the patients’ epidemiologic characteristics compared with previous registries. Patients with severe ventricular dysfunction and those in NYHA functional class II or III continued to predominate and a plateau was reached in the growing tendency in the number of implantations carried out in the electrophysiology laboratory (79.8% vs 81.4% in 2012 and 76.4% in 2011) and in those performed by electrophysiologists (80.7% vs 81% in 2012 and 78.4% in 2011).
Differences Among Autonomous CommunitiesThe differences in ICD implantation rates among the various autonomous communities held steady. The implantation rate was 102 per million population according to the registry and was 120 per million population according to EUCOMED data, with both figures showing an increase compared with 2012 (91.2 and 113.0, respectively). Several autonomous communities showed rates above the average: Principality of Asturias (186), Extremadura (156), Chartered Community of Navarre (137), Valencian Community (127), Galicia (122), Castile and León (122) and Cantabria (105). The autonomous communities with activity below the average included the Community of Madrid (99), Aragon (94), Region of Murcia (91), the Basque Country(85), Castile-La-Mancha (84), Catalonia (84), Andalusia (82), The Canary Islands (77) and the Balearic Islands (71). The difference between the communities with the highest and lowest implantation rates is currently more than double and has increased compared with previous registries (186 vs 71). In general, the percentage of implantations per million population increased in practically all the autonomous communities and decreased only in the Canary Islands.
The data for 2013 show a widespread increase in Spain, which was more marked in the autonomous communities with ICD implantation rates above the average. No association was found between the gross domestic product of each region and the number of implantations. Curiously, most of the regions with higher per capita incomes had below-average implantation rates. The regions with higher-than-average rates were the least densely populated, except for the Valencian Community. Equally, there was no association between implantation rates and the incidence of ischemic heart disease and heart failure in the distinct regions. These differences could be explained by other reasons, such as the organization of the health system in each region, the number of arrhythmia units, and the distribution of referrals.
Comparison With Other CountriesThe implantation rate in countries participating in the EUCOMED was 289 per million population (273 in 2012), including ICD and ICD-CRT. Germany, with 541 devices, continued to be the country with the highest number of implantations. Spain (120 implantations per million) was the country with the lowest number of implantations. The countries with above-average implantation rates were the Netherlands (388), Italy (381), Denmark (322), and the Czech Republic (351). Countries with below-average implantation rates were Poland (276), Austria (253), Ireland (250), Belgium (237), Sweden (223), Norway (219), France (202), Switzerland (196), Finland (182), the United Kingdom (164), Portugal (148), Greece (141), and Spain (120). The difference in the implantation rate in Spain compared with the mean continued to increase (120 vs 289 in 2013 and 113 vs 269 in 2012). Likewise, the difference between Spain and the next-ranking country also increased (120 vs 141).
The ICD implantation rate was 176 per million population in 2013 (167 in 2012). The country with the highest number of implantations was Germany (331) and that with the lowest was Spain (80).
The ICD-CRT implantation rate was 113 per million population (106 in 2012). The rate continued to be highest in Germany (210 implantations) and lowest in Spain (40).
The proportion of ICD-CRT with respect to the total number of implantations ranged from 26% in Poland and 45% in Italy. The percentages were above 40% in the Czech Republic, France, Switzerland, Ireland, and Italy and were <30% in Norway and Poland. The proportion was in Spain was 33%.
The 2013 data show that implantation rates increased in Europe. The differences in Spain compared with the European mean continued to increase.
Other European countries showed the same regional differences25,26 found in our registry and there is no clear explanation for this finding. A possible explanation involves the number of available arrhythmia units but the relationship is far from clear, at least in Spain, where the regions with the highest number of available units had the lowest implantation rates. Other explanations, such as per capita income, also fail to elucidate these differences; the ICD implantation rate was much higher in countries such as Ireland, the Czech Republic and Poland than in Spain. Other factors that could be related to the implantation rate and its variability in Spain are the prevalence of cardiovascular diseases, access to the health system and its organization, and the degree of acceptance and adherence to clinical practice guidelines.
LimitationsAccording to the EUCOMED data, the registry included 85.6% of the implantations performed in Spain. This percentage is higher than those for 2012 (80.8%) and 2011 (83.6%). The number of implantations reported to the registry decreased after 2007, when 90% of implantations were notified, but has risen again and the number reported is still representative of the situation in Spain. The number of participating centers has slightly declined in the last 2 years, mainly because amalgamation among hospitals led to data pooling.
In some hospitals, the true number of implantations differed from the number notified. Some data collection forms were not received or properly registered, since data can be sent and received in several ways. We continue to hope that next year's data will be gathered through the online data collection form, which could improve the results and narrow the gap between the data received and those provided by EUCOMED.
There was excessive variability in the response rate to distinct items on the ICD data collection form, oscillating between 99.0% for the item on the implanting hospital to 47.9% for that on QRS width. Lastly, the percentage of complications reported to the registry does not reflect the true situation, given that the data were completed during or immediately after implantation. Consequently, there was no record of most subacute complications.
Future Prospects of the Spanish Implantable Cardioverter-defibrillator RegistryThe current registry is the X official report of this activity in Spain. All members of the Electrophysiology and Arrhythmias Section of the SEC who participate in this registry can feel proud of its continued existence. Its progressive modernization will allow more and better information to be collected with less effort on the part of all the staff involved in its maintenance. Its future computerization may allow the inclusion of more ambitious clinical objectives and parameters such as mortality, shocks delivered, complications, etc., which will provide important clinical information and represent a substantial improvement.
CONCLUSIONSThe 2013 Spanish Implantable Cardioverter-defibrillator Registry is a compilation of 85.6% of the implantations carried out in Spain and continues to be representative of the activity and current indications for this treatment in our environment. After 2 consecutive years with a decreasing number of implantations, this trend was reversed, with 102 implantations per million population. As in previous years, the number of implantations in Spain continues to be much lower than the average for the European Union. This difference continues to increase and considerable differences persist among the autonomous communities.
CONFLICTS OF INTERESTJ. Alzueta has participated in research projects with St. Jude Medical, Medtronic, Boston Scientific, Biotronik and the Sorin Group. I. Fernández Lozano has participated in round tables sponsored by Medtronic, St. Jude Medical, Boston, Biotronik and the Sorin Group and holds a research grant from Boston Scientific.
We would like to express our appreciation to all the health care professionals involved in ICD implantation in Spain, who have voluntarily and generously contributed to the success of the registry. We also extend our thanks to José María Fernández, who holds a grant from the SEC for maintaining the Spanish Implantable Cardioverter-defibrillator Registry database, for his enthusiasm in maintaining the data and participating in its compilation. We also thank the staff at the ICD manufacturers (Medtronic, Boston Scientific, St, Jude Medical, Biotronik, and the Sorin Group) for their help in collecting and sending data to the SEC on the majority of implantations. Finally, we wish to thank the SEC for its excellent work in data collection and entry, and in particular Gonzalo Justes and José María Naranjo.