To summarize the findings of the Spanish Implantable Cardioverter-Defibrillator Registry for 2011 compiled by the Electrophysiology and Arrhythmia Section of the Spanish Society of Cardiology.
MethodsEach implantation team voluntarily and prospectively recorded data on a data collection form, which was then sent to the Spanish Society of Cardiology.
ResultsOverall, 4481 device implantations were notified, representing 83.6% of the estimated total number of implantations. The notified implantation rate was 97 per million population and the estimated total implantation rate was 116.2 per million. First implantations accounted for 70.2% of the total notified. Data were collected from 167 hospitals (22 more than in 2010). Most implantable cardioverter-defibrillator implantations took place in men (82.1%). The mean age was 62.4 (14.1) years. Most patients had severe or moderate-to-severe ventricular dysfunction and were in New York Heart Association functional class II. The most frequent underlying cardiac condition was ischemic heart disease, followed by dilated cardiomyopathy. The number of indications for primary prevention increased over the previous year and accounted for 70.6% of first implantations. Overall, 78.4% of implantable cardioverter-defibrillators were implanted by cardiac electrophysiologists.
ConclusionsThe 2011 Spanish Implantable Cardioverter-Defibrillator Registry includes data on almost 84% of all implantations of these devices performed in Spain. This was the first year in which the number of implants decreased slightly from the previous year, as also occurred in the rest of Europe. The percentage of implants for primary prevention continued to increase.
Keywords
Implantable cardioverter-defibrillators (ICDs) have proven effective for primary and secondary prevention of sudden cardiac death. The results of several published studies have enabled the main indications for ICD implantation to be established and presented in clinical guidelines for the management of patients with ventricular arrhythmia or a risk of sudden cardiac death.1, 2 Nonetheless, the increased use of these devices has raised questions on their effectiveness outside the setting of clinical trials, the proper selection of patients for ICD implantation, access to this therapy, and its safety and cost-effectiveness.3 There is little information in the literature on these aspects or on the application of clinical guidelines in unselected patient populations. Thus, related health registries can be of great value in clarifying these issues.
This study presents the 2011 data on ICD implantation compiled by the Spanish Implantable Cardioverter-Defibrillator Registry. Most of the centers that carry out ICD implantation in Spain have collaborated with this registry. As is the case of the official reports describing the activity of previous years,4, 5, 6, 7, 8, 9, 10 the present report was written by members of the Electrophysiology and Arrhythmia Section (Sección de Electrofisiología y Arritmias [SEA]) of the Spanish Society of Cardiology (Sociedad Española de Cardiología [SEC]).
The main objective of the registry is to gain information on current ICD use in Spain, with a focus on the indications for this treatment, the clinical characteristics of the patients, implantation data, types of devices, the ICD programming used, and complications during the procedure.
MethodsData for the registry were collected on a data acquisition form available on the SEC web site.11 ICD implantation teams directly filled out the form during or following the procedure on a voluntary basis, in collaboration with personnel from the ICD manufacturer. The forms were then sent by fax or electronic mail to the SEC.
The information was entered in the Spanish Implantable Cardioverter-Defibrillator Registry database by a technician engaged for this purpose with the help of a computer specialist from the SEC and a member of the SEA. Data were filtered by the SEC technician and the SEA member. The authors of the present article performed the data analysis and are responsible for the contents of this report.
The census data for the country as a whole and for each autonomous community and province used to calculate the rates per million population were obtained from estimates provided by the Spanish National Institute of Statistics, referring to the period up to 1 January 2011.12
To estimate the representativeness of the registry, the percentage of notified implantation and replacement procedures with respect to the total number of implantations and replacements carried out in Spain in 2011 was calculated. The total number was based on the data for 2011 reported to the European Medical Technology Industry Association (EUCOMED)13 by the companies marketing ICDs in Spain. When more than 1 clinical presentation form or type of arrhythmia was recorded on the data collection form in the same patient, the most serious condition was used in the analysis.
For each variable analyzed, percentages were calculated based on the total number of notified implantations with information on the particular variable.
Statistical AnalysisThe numerical results are expressed as the mean (standard deviation) or the median [interquartile range], depending on the distribution of the variable. Comparisons between continuous quantitative variables were performed with ANOVA or the Kruskal-Wallis test. Qualitative variables were compared with the chi-square test. The relationships between the number of implantations and the number of implantation centers per million population and between the total number of implantations and the number of implantations for primary prevention in each center were evaluated using linear regression models. The statistical significance of the gradual increase in indications for primary prevention vs secondary prevention was also analyzed.
ResultsThe response rates for the various fields on the data collection form ranged from 99.3% for the name of the participating hospital to 51% for the date of the previous implantation in replacement procedures.
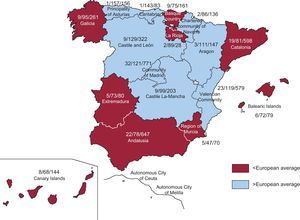
Participating CentersA total of 167 centers that perform ICD implantation in Spain participated in the registry (22 more than in 2010) (Table 1). Among them, 91 were public health care centers (5 more than in the previous year). The number of participating centers, the implantation rate per million population, and the total number of implantations performed in 2001 by autonomous community are shown in Figure 1.
Table 1. Number of Implantations by Autonomous Community, Province, and Center.
| Andalusia | ||
| Granada | Hospital Ruiz de Alda | 1 |
| Almería | Hospital Torrecárdenas | 19 |
| Cádiz | Hospital de Jerez | 11 |
| Hospital Universitario Puerta del Mar | 42 | |
| Córdoba | Hospital de la Cruz Roja de Córdoba | 2 |
| Hospital Reina Sofía | 42 | |
| Granada | Hospital Clínico Universitario San Cecilio | 16 |
| Hospital Universitario Virgen de las Nieves | 97 | |
| Huelva | Hospital General Juan Ramón Jiménez | 39 |
| Málaga | Clínica El Ángel | 5 |
| Clínica Parque San Antonio | 7 | |
| Hospital Internacional Xanit | 6 | |
| Hospital Regional Universitario Carlos Haya | 2 | |
| Hospital USP de Marbella | 2 | |
| Hospital Virgen de la Victoria | 167 | |
| Seville | Clínica de Fátima | 1 |
| Clínica Santa Isabel | 6 | |
| Hospital Infanta Luisa (Clínica Esperanza de Triana) | 3 | |
| Hospital Nisa Aljarafe | 1 | |
| Hospital Ntra. Señora de Valme | 28 | |
| Hospital Virgen del Rocío | 71 | |
| Hospital Virgen Macarena | 63 | |
| Aragon | ||
| Zaragoza | Hospital Clínico Universitario Lozano Blesa | 48 |
| Hospital Miguel Servet | 98 | |
| Hospital Quirón Zaragoza | 1 | |
| Principality of Asturias | Hospital Central de Asturias | 166 |
| Balearic Islands | Hospital Universitari Son Espases | 49 |
| Clínica Juaneda | 1 | |
| Clínica Rotger Sanitaria Balear, S.A. | 1 | |
| Clinica USP Palmaplanas | 4 | |
| Hospital Son Dureta | 1 | |
| Hospital Son Llàtzer | 22 | |
| Policlínica Miramar (Ameba S.A.) | 1 | |
| Canary Islands | ||
| Las Palmas | Clínica Santa Catalina S.A. | 1 |
| Hospital Dr. Negrín | 28 | |
| Hospital Insular de Gran Canaria | 35 | |
| Hospital Ntra. Sra. del Perpetuo Socorro | 1 | |
| Hospiten Ramblas | 4 | |
| Sta. Cruz de Tenerife | Clínica Santa Cruz | 1 |
| Hospital Ntra. Sra. de La Candelaria | 32 | |
| Hospital Universitario de Canarias | 42 | |
| Cantabria | ||
| Santander | Hospital Universitario Marqués de Valdelcilla | 83 |
| Castile and León | ||
| Ávila | Hospital Ntra. Sra. de Sonsoles | 31 |
| Burgos | Complejo Asistencial de Burgos | 4 |
| Hospital General Yagüe | 69 | |
| León | Hospital de León | 43 |
| Salamanca | Complejo Hospitalario de Salamanca | 65 |
| Segovia | Hospital General de Segovia | 2 |
| Valladolid | Hospital Campo Grande | 11 |
| Hospital Clínico Universitario de Valladolid | 69 | |
| Hospital Río Hortega | 28 | |
| Castile-La Mancha | ||
| Albacete | Hospital General de Albacete | 29 |
| Sanatorio Santa Cristina | 1 | |
| Ciudad Real | Hospital General de Ciudad Real | 19 |
| Ntra. Sra. de Alarcos | 2 | |
| Cuenca | Hospital Virgen de la Luz | 12 |
| Guadalajara | Hospital General y Universitario de Guadalajara | 25 |
| Toledo | Complejo Hospitalario de Toledo | 6 |
| Hospital Ntra. Sra. del Prado | 23 | |
| Hospital Virgen de la Salud | 87 | |
| Catalonia | ||
| Barcelona | Capio Hospital General de Catalunya | 13 |
| Centro Médico Teknon | 2 | |
| Clínica Corachan | 1 | |
| Clínica Delfos | 1 | |
| Clinica Dexeus | 3 | |
| Clínica Pilar Sant Jordi | 17 | |
| Clínica Quirón | 6 | |
| Clínica Sagrada Familia | 2 | |
| Hospital de la Santa Creu i Sant Pau | 124 | |
| Hospital Can Ruti | 1 | |
| Hospital Clínic de Barcelona | 178 | |
| Hospital de Barcelona | 1 | |
| Hospital de Bellvitge | 71 | |
| Hospital del Mar | 17 | |
| Hospital Germans Trias i Pujol | 53 | |
| Hospital Sant Joan de Déu | 3 | |
| Hospital Vall d’Hebron | 88 | |
| Lleida | Hospital Universitario Arnau de Vilanova | 17 |
| Tarragona | Hospital Universitario de Tarragona Joan XXIII | 15 |
| Valencian Community | ||
| Alicante | Clínica Benidorm | 3 |
| Clínica Vistahermosa | 3 | |
| Hospital de Dènia | 5 | |
| Hospital de Levante | 1 | |
| Hospital de Torrevieja | 27 | |
| Hospital del Vinalopó | 13 | |
| Hospital General Universitario de Alicante | 137 | |
| Hospital General Universitario de Elche | 7 | |
| Hospital Marina Salud | 3 | |
| Hospital Universitari Sant Joan | 28 | |
| Sanatorio del Perpetuo Socorro | 1 | |
| Castellón | Consorcio Hospital Provincial de Castellón | 1 |
| Hospital de La Plana | 8 | |
| Hospital General de Castelló | 42 | |
| Hospital Rey Don Jaime | 4 | |
| Valencia | Grupo Hospitalario Quirón, S.A. | 3 |
| Hospital Clínico Universitario | 96 | |
| Hospital de Manises | 20 | |
| Hospital General Universitario | 50 | |
| Hospital Lluís Alcanyís | 6 | |
| Hospital Universitari de la Ribera | 5 | |
| Hospital Universitario Dr. Peset | 27 | |
| Hospital Universitario La Fe | 107 | |
| Extremadura | ||
| Badajoz | Clideba | 2 |
| Hospital Infanta Cristina de Badajoz | 57 | |
| Cáceres | Clínica San Francisco | 2 |
| Complejo Hospitalario de Cáceres | 2 | |
| Hospital San Pedro de Alcántara | 17 | |
| Galicia | ||
| A Coruña | Complejo Hospitalario Universitario A coruña | 97 |
| Complejo Hospitalario Universitario de Santiago | 81 | |
| Hospital Clínico de Santiago | 7 | |
| Hospital USP Santa Teresa | 4 | |
| Ourense | Centro Médico El Carmen | 1 |
| Complejo Hospitalario de Ourense | 1 | |
| Pontevedra | Complejo Hospitalario Universitario | 48 |
| Hospital do Meixoeiro | 20 | |
| Hospital Povisa | 2 | |
| La Rioja | Hospital San Pedro | 27 |
| Hospital Viamed Los Manzanos | 1 | |
| Community of Madrid | Clínica San Camilo | 3 |
| Clínica La Luz | 3 | |
| Clínica Ntra. Sra. de América | 6 | |
| Clínica Ruber, S.A. | 1 | |
| Fundación Hospital Alcorcón | 10 | |
| Fundación Jiménez Díaz. Clínica Ntra. Sra. de la Concepción | 38 | |
| Hospital 12 de Octubre | 95 | |
| Hospital Central de la Defensa | 17 | |
| Hospital Clínico San Carlos | 94 | |
| Hospital de Fuenlabrada | 7 | |
| Hospital de Madrid-Montepríncipe | 2 | |
| Hospital de Torrejón | 3 | |
| Hospital del Henares | 1 | |
| Hospital General Universitario Gregorio Marañón | 100 | |
| Hospital Infanta Cristina de Parla | 2 | |
| Hospital Infanta Elena | 3 | |
| Hospital Infanta Leonor | 3 | |
| Hospital los Madroños | 1 | |
| Hospital Madrid Norte/Sanchinarro | 7 | |
| Hospital Nisa Pardo de Aravaca | 1 | |
| Hospital Quirón Madrid | 6 | |
| Hospital Ramón y Cajal | 96 | |
| Hospital Ruber Internacional | 2 | |
| Hospital San Rafael | 2 | |
| Hospital Sanitas La Moraleja | 1 | |
| Hospital Severo Ochoa | 14 | |
| Hospital Sur Alcorcón | 1 | |
| Hospital Universitario de Getafe | 11 | |
| Hospital Universitario La Paz | 96 | |
| Hospital Universitario Madrid | 1 | |
| Hospital Universitario Puerta de Hierro | 142 | |
| Hospital USP San Camilo | 1 | |
| Region of Murcia | Clínica Virgen de la Vega | 4 |
| Hospital General Universitario Morales Meseger | 4 | |
| Hospital General Universitario Sta. Maria del Rosell | 2 | |
| Hospital Rafael Méndez | 3 | |
| Hospital Universitario Virgen de la Arrixaca | 57 | |
| Chartered Community of Navarre | Clínica Universitaria de Navarra | 33 |
| Hospital de Navarra | 53 | |
| Basque Country | ||
| Álava | Hospital Universitario de Araba | 1 |
| Hospital Txagorritxu | 47 | |
| Vitoria | Hospital de San José | 1 |
| Guipúzcoa | Hospital de Donostia | 11 |
| Vizcaya | Clínica Vicente San Sebastián | 1 |
| Hospital de Basurto | 48 | |
| Hospital de Cruces | 35 | |
| Hospital de Galdakao-Usansolo | 16 | |
| Hospital Quirón Vizcaya | 1 | |
| No data | 33 |

Figure 1. Distribution of the 2011 implantation activity by autonomous community: number of implantation centers/implantation rate per million population/total number of implantations.
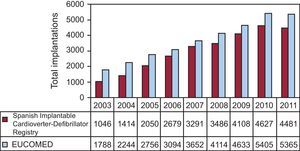
Total Number of ImplantationsOverall, 4481 implantations (first implants and replacement implants) were notified to the registry in 2011, a substantially lower number than in 2010 (4627). According to the EUCOMED13 data, 5361 devices were implanted in 2010; hence, 83.6% of the total were notified to the registry. The total number of implantations recorded in the registry and the number estimated by EUCOMED over the last 9 years are shown in Figure 2.

Figure 2. Total number of implantations notified to the registry and total number estimated by European Medical Technology Industry Association (2003-2011). EUCOMED, European Medical Technology Industry Association.
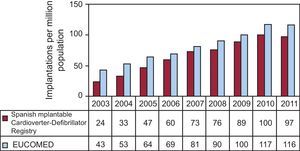
The implantation rate recorded in the registry was 97 per million population, whereas the rate according to the EUCOMED data was 116.2 per million population. The changes occurring in the implantation rates over the last 9 years according to the registry and EUCOMED data are shown in Figure 3. The numbers of implantations notified to the registry by participating centers are shown in Table 1. The number of implantations carried out in each province and the rate per million population of the corresponding autonomous community are shown in Table 2. The name of the hospital in which the device was placed was reported in 99.2% of the cases; most procedures s—4216 (94.5%)—were carried out in public health institutions.

Figure 3. Total number of implantations per million population as recorded in the registry and as estimated by European Medical Technology Industry Association (2003-2011). EUCOMED, European Medical Technology Industry Association.
Table 2. Implantations Performed by Autonomous Community and Province.
| Autonomous community | Rate per million population | Province | Implants, n |
| Andalusia | 78.4 | Almería | 19 |
| Cádiz | 53 | ||
| Córdoba | 44 | ||
| Granada | 114 | ||
| Huelva | 39 | ||
| Málaga | 189 | ||
| Seville | 173 | ||
| Aragon | 111.8 | Zaragoza | 147 |
| Principality of Asturias | 157.3 | Asturias | 166 |
| Canary Islands | 68.6 | Las Palmas | 65 |
| Sta. Cruz de Tenerife | 4 | ||
| Tenerife | 75 | ||
| Cantabria | 68.6 | Santander | 83 |
| Castile and León | 126.2 | Ávila | 31 |
| Burgos | 73 | ||
| León | 43 | ||
| Salamanca | 65 | ||
| Segovia | 2 | ||
| Valladolid | 108 | ||
| Castile-La-Mancha | 99.2 | Albacete | 30 |
| Ciudad Real | 21 | ||
| Cuenca | 12 | ||
| Guadalajara | 25 | ||
| Toledo | 116 | ||
| Catalonia | 81.5 | Barcelona | 582 |
| Lleida | 17 | ||
| Tarragona | 15 | ||
| Valencian Community | 119.3 | Alicante | 228 |
| Castellón | 55 | ||
| Valencia | 314 | ||
| Extremadura | 73.9 | Badajoz | 59 |
| Cáceres | 21 | ||
| Galicia | 65.4 | A Coruña | 189 |
| Ourense | 2 | ||
| Pontevedra | 70 | ||
| Balearic Islands | 72.6 | Baleares | 79 |
| La Rioja | 28 | Logroño | 28 |
| Community of Madrid | 121 | Madrid | 770 |
| Region of Murcia | 47.7 | Murcia | 70 |
| Chartered Community of Navarre | 86 | Navarra | 86 |
| Basque Country | 161 | Álava | 49 |
| Guipúzcoa | 11 | ||
| Vizcaya | 101 | ||
| No data | 33 |
This information was available in 4207 of the data forms sent (93.8%). There were 2954 first implantations, representing 70.2% of the total (73.8% in 2010). The rate of first implantations in 2011 was 64 per million population (69.7 in 2010).
Age and SexThe mean age (standard deviation) (range) of patients receiving an ICD or replacement device was 62.4 (14.1) years (6-94). The age of those receiving only first implants was 61.5 (13.9) years. Most patients were men, who accounted for 82.1% of the total treated and 81.8% of patients receiving a first implant.
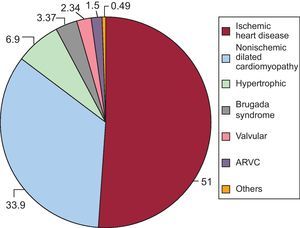
Underlying Heart Disease, Left Ventricular Ejection Fraction, Functional Class, and Baseline RhythmThe most frequent underlying cardiac condition was ischemic heart disease (51%), followed by dilated cardiomyopathy (33.9%), hypertrophic cardiomyopathy (6.9%), and primary conduction abnormalities (Brugada syndrome, idiopathic ventricular fibrillation, and long QT syndrome, 3.9%), and in small percentages, valvular heart disease, and arrhythmogenic dysplasia (Figure 4).

Figure 4. Type of heart disease prompting device implantation (all implantations) ARVC, arrhythmogenic right ventricular dysplasia. Data are expressed as percentages.
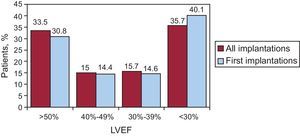
With regard to left ventricular function in patients with first implants, the left ventricular ejection fraction was <30% in 40.1% of patients, 30%-39% in 14.6%, 40%-49% in 14.4%, and >50% in 30.8% of patients. In patients with replacement ICDs, the distribution of values was similar (Figure 5).

Figure 5. Left ventricular ejection fraction in registry patients (all implantations and first implantations). LVEF, left ventricular ejection fraction. Data are expressed as percentages.
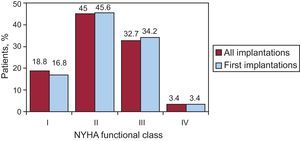
New York Heart Association (NYHA) functional class in patients with a first ICD was mainly NYHA II (45.5%), followed by NYHA III (32.2%), and NYHA I (18.8%); a small percentage of patients were in NYHA IV (3.4%). In this case, the distribution of values between first implants and replacement implants was also very similar (Figure 6).

Figure 6. New York Heart Association functional class in registry patients (all implantations and first implantations). NYHA, New York Heart Association.
The baseline cardiac rhythm, recorded in 84.5% of patients, was sinus rhythm (76.8%), atrial fibrillation (19%), paced rhythm (3.9%), and other rhythms (atrial flutter and other arrhythmias) in the remaining patients.
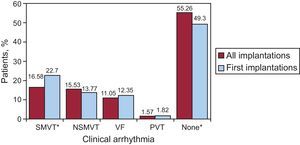
Clinical Arrhythmia Prompting Device Placement, Presentation, and Electrical Stimulation-Induced ArrhythmiaRelated data were available in 80.9% of notified cases. In first implants, the largest group comprised patients who did not have documented clinical arrhythmia (55.2%), followed by those with sustained monomorphic ventricular tachycardia and those with nonsustained monomorphic ventricular tachycardia (16.5% and 15.5%, respectively). Among the total of implantation procedures performed, 49.3% of devices were placed in patients without documented clinical arrhythmia (Figure 7). Percentage differences in the type of arrhythmia between patients receiving first implants and the total were statistically significant for those without arrhythmia and those with sustained monomorphic ventricular tachycardia (P<.001), but not for the remaining patients.

Figure 7. Arrhythmia prompting device implantation (all implantations and first implantations), expressed as percentage. NSMVT, nonsustained monomorphic ventricular tachycardia; PVT, polymorphic ventricular tachycardia; SMVT, sustained monomorphic ventricular tachycardia; VF, ventricular fibrillation. *P<.001.
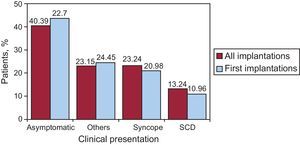
The most common clinical presentation in the overall population and in the group with a first implant was an absence of symptoms, followed by “other symptoms”, and syncope. Statistically significant differences between patients with a first implant and the overall group were found for sudden cardiac death and asymptomatic status (P<.01), but not for syncope or other presentations (Figure 8).

Figure 8. Clinical presentation of arrhythmia in registry patients (all implantations and first implantations). SCD, sudden cardiac death.
Information regarding whether electrophysiological study had been performed was available in 2357 notifications of first implantations (79.7%); these studies were carried out in 278 cases (11% of notifications provided this information). The most frequently recorded induced arrhythmia was sustained monomorphic ventricular tachycardia (49%), followed by ventricular fibrillation (18.8%), and less frequently nonsustained monomorphic ventricular tachycardia (10%), and others (4.2%). Arrhythmia was not induced at electrophysiological study in 18.8% of patients undergoing this test. The studies were mainly performed in patients with ischemic heart disease and dilated cardiomyopathy.
Clinical HistoryIn keeping with a suggestion from the SEC Working Group on Implantable Cardioverter-Defibrillators, several new fields related to the patients’ medical history that had not been included in previous years were incorporated in the 2011 data form.11 These were filled out in 60% of the notifications with the following results: hypertension, 53.6%; hypercholesterolemia, 45.2%; smoking, 32.3%; history of atrial fibrillation, 29.8%; diabetes mellitus, 26.8%; renal failure, 15%; and family history of sudden cardiac death, 8.7% and stroke, 6.4%. The QRS interval was documented in 48.9% of notifications and yielded a mean value of 128.3 (67.1) ms.
IndicationsThe indication for a first ICD implantation was for primary prevention in most cases (59.4%), with a notable increase since 2003, when 29%4 were indicated for this reason. This increase was statistically significant (P<.01) between all successive years of the registry, with the exception of a decrease from 2008 to 2009 and an increase from 2010 to 2011, in which the difference was not statistically significant.
The changes occurring in first implantations according to the type of heart disease, type of clinical arrhythmia and presentation form during the 2008 to 2011 period are shown in Table 3. Ischemic heart disease was the condition most often associated with ICD implantation in 2011, and the indication was mainly for primary prevention (59.6%), thereby continuing the growing trend seen in the last few years (58.5% in 2010 and 56.4% in 2009). The trend in primary prevention for dilated cardiomyopathy also increased (74.7%, vs 72.8% in 2010 and 69.4% in 2009). In 59.7% of implantations, 3-chamber pacemakers were combined with cardiac resynchronization therapy (CRT). In ischemic heart disease, CRT was used in 29.9% of patients. In the less common heart diseases, the predominant indication was primary prevention in hypertrophic cardiomyopathy, valvular disease, and Brugada syndrome, and secondary prevention in long QT syndrome, arrhythmogenic cardiac disease, and congenital heart disease.
Table 3. Number of First Implantations According to the Type of Heart Disease, Type of Clinical Arrhythmia, and Form of Presentation (2008-2011).
| 2008 | 2009 | 2010 | 2011 | |
| Ischemic heart disease | ||||
| Aborted SCD | 93 (9.3) | 111 (7.9) | 154 (10.0) | 150 (10.85) |
| SMVT associated with syncope | 126 (10.2) | 117 (8.4) | 132 (8.6) | 199 (14.4) |
| SMVT without syncope | 176 (14.3) | 201 (14.4) | 317 (20.7) | 197 (14.2) |
| Syncope without arrhythmia | 138 (11.2) | 121 (8.7) | 68 (4.4) | 95 (6.8) |
| Prophylactic implantation | 607 (49.3) | 637 (45.9) | 642 (42.0) | 623 (45.0) |
| Missing/unclassifiable | 92 (7.5) | 202 (14.5) | 212 (13.9) | 120 (8.7) |
| Subtotal | 1231 | 1389 | 1525 | 1384 |
| Dilated cardiomyopathy | ||||
| Aborted SCD | 38 (6.6) | 53 (5.5) | 49 (6) | 47 (5.9) |
| SMVT associated with syncope | 33 (5.7) | 61 (6.4) | 58 (7.1) | 57 (7.1) |
| SMVT without syncope | 43 (7.4) | 69 (7.2) | 136 (16.8) | 157 (19.6) |
| Syncope without arrhythmia | 74 (12.8) | 102 (10.7) | 34 (4.2) | 37 (4.6) |
| Prophylactic implantation | 337 (58.3) | 440 (46.1) | 393 (48.7) | 427 (53.4) |
| Missing/unclassifiable | 53 (9.2) | 228 (23.9) | 136 (16.8) | 74 (9.3) |
| Subtotal | 578 | 953 | 806 | 799 |
| Valvular heart disease | ||||
| Aborted SCD | 11 (12.5) | 8 (9.3) | 9 | 16 (10.8) |
| SMVT | 25 (28.4) | 27 (31.3) | 29 | 47 (31.8) |
| Syncope without arrhythmia | 8 (9.1) | 8 (9.3) | 4 | 5 (3.4) |
| Prophylactic implantation | 39 (44.3) | 28 (23.5) | 50 | 66 (44.6) |
| Missing/unclassifiable | 5 (5.7) | 15 (17.4) | 16 | 14 (9.6) |
| Subtotal | 88 | 86 | 108 | 148 |
| Hypertrophic cardiomyopathy | ||||
| Secondary prevention | 29 (19.9) | 24 (14.9) | 90 (54.5) | 127 (68.8) |
| Prophylactic implantation | 99 (67.8) | 97 (60.2) | 53 (32.1) | 52 (28.0) |
| Missing/unclassifiable | 18 (12.3) | 40 (24.8) | 22 (13.2) | 7 (3.8) |
| Subtotal | 146 | 161 | 165 | 186 |
| Brugada syndrome | ||||
| Aborted SCD | 7 (10.4) | 11 (8.4) | 17 (24.6) | 7 (13.5) |
| Prophylactic implantation in syncope | 27 (40.4) | 36 (27.6) | 18 (26.6) | 25 (40.8) |
| Prophylactic implantation without syncope | 28 (41.2) | 52 (40) | 23 (33.3) | 15 (28.8) |
| Missing/unclassifiable | 5 (7.8) | 31 (23.8) | 11 (15.9) | 5 (9.6) |
| Subtotal | 67 | 130 | 69 | 52 |
| ARVC | ||||
| Aborted SCD | 2 (6.96) | 1 (3.8) | 4 (15.9) | 2 (4.6) |
| SMVT | 12 (41.4) | 16 (61.2) | 23 (71.8) | 21 (48.8) |
| Prophylactic implantation | 12 (41.4) | 5 (19.2) | 4 (12.5) | 17 (39.5) |
| Missing/unclassifiable | 3 (10.3) | 4 (15.3) | 1 (3.1) | 3 (6.98) |
| Subtotal | 29 | 26 | 32 | 43 |
| Congenital heart disease | ||||
| Aborted SCD | 2 (11.1) | 4 (19) | 3 (8.1) | 4 (12.5) |
| SMVT | 5 (27.8) | 1 (4.7) | 15 (40.5) | 8 (25.0) |
| Prophylactic implantation | 10 (55.6) | 9 (42.8) | 16 (43.2) | 15 (46.8) |
| Missing/unclassifiable | 1 (5.5) | 7 (33.3) | 3 (8.1) | 5 (15.4) |
| Subtotal | 18 | 21 | 37 | 32 |
| Long QT syndrome | ||||
| Aborted SCD | 3 (15.8) | 9 (50) | 18 (60) | 11 (50) |
| Prophylactic implantation | 16 (84.2) | 3 (16.6) | 6 (20) | 9 (40.9) |
| Missing/unclassifiable | 0 | 6 (33.3) | 6 (20) | 2 (9.1) |
| Subtotal | 19 | 18 | 30 | 22 |
ARVC, arrhythmogenic right ventricular cardiomyopathy; SCD, sudden cardiac death; SMVT, sustained monomorphic ventricular tachycardia.
Values are expressed as no. (%).
The changes occurring in the indications related to the main types of heart diseases over the last 9 years are shown in Table 4.
Table 4. Changes in the Main Indications for Implantable Cardioverter Defibrillator Placement (First Implantations, 2003-2011).
| Year | SCD | SMVT | Syncope | Primary prevention |
| 2003 | 13.7 | 2.8 | 14 | 29 |
| 2004 | 14.8 | 37 | 16 | 32.2 * |
| 2005 | 11.1 | 34.8 | 14.6 | 39.5 * |
| 2006 | 9.5 | 27 | 13.2 | 50.3 * |
| 2007 | 9.9 | 25 | 14.1 | 50.7 * |
| 2008 | 9.3 | 21.4 | 12.3 | 57 * |
| 2009 | 9.4 | 20.8 | 13.9 | 55.9 |
| 2010 | 10.9 | 20.6 | 11.1 | 57.1 * |
| 2011 | 10.7 | 15.1 | 14.6 | 59.4 |
SCD, sudden cardiac death; SMVT, sustained monomorphic ventricular tachycardia.
* Significant difference with respect to the previous year (P<.01).
The response rate for these items was 87%. The main setting in which ICD implantation was performed was the electrophysiology laboratory in 76.4% of cases (70.3% in 2010 and 67% in 2009), followed by the operating room in 21.2%.
The procedure was carried out by electrophysiologists in 78.4% of cases (76.1% in 2010), surgeons in 15.5% (17.7% in 2010), both these specialists in 2%, and other specialists in 1.4%.
Generator Implantation SiteThe generator was placed subcutaneously in a pectoral position in 91.6% and a subpectoral position in 8.4%. In first implants, the values were 96.6% and 6.4%, respectively.
Type of DeviceThis information was provided in 94.5% of notifications and is summarized in Table 5. Single-chamber ICDs, dual-chamber ICDs, and CRTs were used in 46.7%, 18.4%, and 34.9% of patients, respectively. In 2010, these values were 50.3%, 20.2%, and 28.2%, respectively.
Table 5. Types of Implantable Cardioverter-Defibrillators Placed.
| 2010, total | 2011, total | 2011, EUCOMED | 2010, first implants | 2011, first implants | |
| Single-chamber | 50.3 | 46.7 | 46.6 | 51.1 | 48.3 |
| Dual-chamber | 20.2 | 18.4 | 18.3 | 20.0 | 17.2 |
| Resynchronizer | 28.2 | 34.9 | 35.7 | 28.7 | 34.5 |
EUCOMED, European Medical Technology Industry Association.
Among the 1253 ICD replacement procedures, this information was provided in 81.48%. The most common reason was depletion of the battery, which occurred in 917 cases (89%), and complications in the remaining 105 cases (10.5%). Among the latter cases (early replacements), 20.27% were carried out within the first 6 months following the implantation procedure.
In 82.3% of replacement notifications, information was provided on the status of the leads: 8.7% were malfunctioning (90 entries), and lead extraction was carried out in 46.6% of the cases in which this information was recorded.
Implantable Cardioverter-Defibrillator ProgrammingData on this item were included in 89.9% of entries. The antibradycardia pacing most often used was VVI mode (49%), followed by DDD mode (30.3%), VVIR mode (8.6%), DDDR mode (7.2%), and other pacing modes, mainly preventive algorithms for ventricular pacing (5%). Antitachycardia pacing was programmed in 92.9%.
Defibrillation thresholds were measured in 446 patients (12.4%). In the 3591 entries providing this information, the mean threshold was 22.6J and a mean of 1.1 shocks were delivered.
ComplicationsIn 2011, there were 6 deaths at implantation (0.1%), a rate similar to 2010, 15 dissections of the coronary sinus (0.3%), 9 cases of pneumothorax (0.2%), and 17 cases of various or unspecified complications.
DiscussionThe results of the 2011 ICD registry continue to show acceptable representativeness. The information contained in this registry is a reliable reflection of the situation in Spain regarding the number of implantations performed, the location and distribution of this activity by autonomous community, the type of implant placed, the indications for this treatment, clinical characteristics of the patients, programming of the devices, and complications.
Comparison With Registries of Previous YearsSince data from the Spanish Implantable Cardioverter-Defibrillator Registry were first published, 2011 was the first year in which a decrease occurred in the total number of implantations performed and in the percentage of implantations per million population. These data are consistent with the results published by EUCOMED13 and are similar to the trends observed in some other European countries. Nonetheless, despite this decrease, the percentage of ICD placements for an indication of primary prevention rose, mainly due to the increase in the use of CRT devices. Among the total, 66.2% of the devices implanted were single-chamber or dual-chamber ICDs (70.5% in 2010), whereas 34.4% were CRT devices (28.2% in 2010). Thus, there was a decrease in the indications for single- and dual-chamber ICDs, and an increase in CRT implantations, which partly counterbalanced the drop in conventional ICDs. It seems reasonable to consider that these data are a reflection of the effect of the economic crisis in Europe and that a continuation of this trend could be expected in 2012.
The most common indication for implantation of a first ICD was ischemic heart disease, at 51% (53% in 2010), and the second in frequency was dilated cardiomyopathy, at 33.9% (27.6% in 2010). More than half the implants in cases of dilated cardiomyopathy were CRT devices (59.7%), whereas the percentage was lower (29.9%) in ischemic heart disease patients.
Over the last 10 years, there has been a gradual increase in ICD use, which is likely linked to publication of several clinical trials that have provided reliable evidence supporting the benefits of this type of therapy. Following publication of the Multicenter Automatic Defibrillator Implantation Trial II14 in 2002, a significant increase in ICD procedures was observed from 2002 to 2003. The results of the Comparison of Medical Therapy, Pacing and Defibrillation in Heart Failure trial15 and the Sudden Cardiac Death in Heart Failure Trial, 16published between 2005 and 2006, confirmed previous data and supported the use of this therapy, with or without cardiac resynchronization, in heart failure patients. In 2011, this trend reversed and the total number of implants decreased, despite a 6.4% increase in CRT implants. This change may have been driven by publication of the Multicenter Automatic Defibrillator Implantation Trial-Cardiac Resynchronization Therapy17 study in 2009, which included patients in NYHA functional class I and II.
Differences remain in the number of implantations recorded in the present registry and the EUCOMED data, and these differences have persisted over time in similar percentages. The number of participating centers has increased to 167 (22 more than in 2010); however, 70 of them notified less than 10 implantations each (and among these 23 centers notified only 1), whereas 11 centers reported more than 100 implantations over the year. There was no correlation between the number of implantations performed per hospital and the percentage of implantations of CRT devices (r=0.013; P=.95); nor was a correlation found between the number of implantations and the percentage of primary prevention indications (r=0.003; P=.98).
There were no significant changes in the patients’ epidemiologic characteristics, and similar data were recorded for age and sex. Patients with severe ventricular dysfunction and patients in NYHA functional class II or III continued to predominate. The increase in implantation of ICD-CRTs persisted, with a rate of 34.4% in 2011 (27.8% in 2010 and 25.2% in 2009). There were no substantial changes regarding the implantation site or specialist performing the procedure. The 2011 data were very similar to those of 2010, with a slight increase in the percentage of implantations performed by electrophysiologists (78.4% in 2011 and 76.1% in 2010).
Differences Between Autonomous CommunitiesThe differences in ICD implantation rates among the various autonomous communities held steady. The overall average implantation rate in Spain in 2011 was 97 per million population, 116.2 per million population according to EUCOMED data. Several autonomous communities showed rates above this average: the Principality of Asturias (157), Cantabria (143), Castile and León (129), the Community of Madrid (121), the Valencian Community (119) and Castile-La-Mancha (99). The autonomous communities with activity below the average included Galicia (95), La Rioja (89), the Chartered Community of Navarre (86), Catalonia (81), Andalusia (78), the Basque Country (75), Extremadura (73), the Balearic Islands (72), the Canary Islands (68), and the Region of Murcia (47). Except in the case of the Chartered Community of Navarre (179 in 2010), which showed a considerable decrease with respect to the previous year, there was a slight, uniform drop in the implantation rate per million population in most autonomous communities, particularly those with the largest populations. In the Principality of Asturias, Cantabria, and La Rioja, however, an increase in the implantation rate was documented with respect to 2010. There is no clear justification for these large differences among autonomous communities, although they may be explained in part by the number and level of development of the arrhythmia units in the different communities.
Comparison With Other CountriesThe implantation rate in Europe including ICDs and ICD-CRTs was 269 per million population. Germany, with 498 implants per million population, remained the country with the highest rate, and Spain, with 120 according to the EUCOMED data, was the country with the lowest rate. The following countries were above the European average: Germany (498), Italy (353), the Netherlands (345), and Denmark (318). Countries below the average include Austria (229), the Czech Republic (227), Poland (222), Belgium (206), France (191), Switzerland (188), Sweden (188), the United Kingdom (164), Norway (184), Finland (158), Portugal (127), and Spain (120). We do not have data for Greece or Iceland.
The rate of ICD implantations in Europe was 162 per million population (156 in 2010). The number of implantations performed increased in Germany, Denmark, France, Norway, Ireland, Italy, and Portugal. The ICD-CRT implantation rate was 107 per million (99 in 2010). Regarding these devices, the number of implantations increased in all countries with the exception of the Czech Republic, Sweden, and Portugal, which showed a slight decrease. As in previous registries, Germany (177) and Italy (176) had the highest rates of ICD-CRT implantation in Europe, whereas Spain (42) had the lowest rate.
Although there were some slight changes with respect to previous years, the 2011 data were fairly similar to those in the previous registries. The difference between Spain and the European average was maintained: the implantation rate in our country was half that of the European average and one-third that of Germany. In previous registries this difference was attributed to several causes,10 such as the degree of difficulty in accessing the health care system, the social perception of sudden death, the incidence of ischemic heart disease and sudden death in our setting, the degree to which clinical trials and clinical practice guidelines are accepted, and the lack of a sufficient number of arrhythmia and electrophysiology units, etc. However, such large differences in the number of implantations in Spain relative to countries such as Poland and the Czech Republic, in which per capita incomes are lower, do not seem reasonable.
LimitationsAccording to the EUCOMED data, 83.6% of implantations performed in Spain were notified to the registry. This value is lower than the 86% notified in 2010 and the 90% in 2007 but is still representative of the situation in Spain. In the 2011 registry, a new data collection form containing additional fields related to clinical items was used for the first time and the response rates varied according to the specific item. In some hospitals, the true number of implantations performed differed from the number notified. This is because only implantations recorded on the data form were included, and some cases may not have been notified correctly or may have been lost in the process. Lastly, the complications recorded do not accurately reflect the true situation because the data form was completed during or immediately after the procedure. Therefore, subacute complications such as lead displacements, hematomas, and pneumothoraces appearing after the data form had been filled out and sent would not be recorded.
Future Prospects of the Spanish Implantable Cardioverter-Defibrillator RegistryThe current Registry is the VIII Official report of this activity in Spain. Over the years, maintenance of the registry and its updating have been made possible by the collaboration and work of all the participating members. Continuation of the registry in the future will rely on the efforts of all those involved to prevent the gradual decrease in the percentage of implantation notifications that has occurred since 2007.
Modernization of the registry, with the possibility of using the currently available online data collection form, may improve the results. This format will enable basic longitudinal follow-up to be performed, with information on parameters such as mortality, shocks delivered, prescribed therapies, and complications, thus enhancing the value of the registry.
ConclusionsThe 2011 Spanish Implantable Cardioverter-Defibrillator Registry is a compilation of 83.6% of the ICD implantations carried out in Spain and continues to be representative of the use of and indications for this therapy in our country. This is the first year that the number of implantations has decreased with respect to previous registries, with a rate of 97 implantations per million population. The primary prevention indications have continued to increase and account for 70.6% of the total in first implantations. As in previous years, the implantation rate in our country in 2011 was lower than the European Union average, and considerable differences were seen to persist among the autonomous communities.
Conflicts of interestJ. Alzueta has participated in research projects with Medtronic, St. Jude and Boston and in round tables sponsored by Biotronik, St. Jude and Boston.
J.M. Fernández received a grant from SEC to cover maintenance of the Spanish Implantable Cardioverter-Defibrillator Registry database.
Acknowledgements
We thank all the health care professionals involved in ICD implantation in Spain, who have voluntarily and generously contributed to the success of this registry.
We are also grateful to the personnel from the ICD manufacturers (Medtronic, Boston Scientific, St. Jude Medical, Biotronik, and Sorin Group), who collaborated in collecting and sending data to the SEC in the majority of implantations.
We would also like to thank the SEC for their invaluable work in entering data and maintaining the registry database, in particular Gonzalo Justes and José María Naranjo.
Corresponding author: Unidad de Arritmias, Servicio de Cardiología, Hospital Universitario Virgen de la Victoria, Campus de Teatinos s/n, 29010 Málaga, Spain. jalzueta@telefonica.net