To examine the distribution of the main cardiovascular risk factors (CVRF) according to socioeconomic level (SEL) among older adults in Spain.
MethodsA cross-sectional study conducted in 2008-2010 with 2699 individuals representative of the noninstitutionalized Spanish population aged ≥ 60 years. Socioeconomic level was assessed using educational level, occupation, and father's occupation. The CVRF included behavioral and biological factors and were measured under standardized conditions.
ResultsIn age- and sex-adjusted analyses, higher educational level was associated with a higher frequency of moderate alcohol consumption and leisure time physical activity, and less time spent watching television. An inverse educational gradient was observed for frequency of obesity (odds ratio [OR] in university vs primary level or below education, 0.44; 95% confidence interval [95%CI], 0.33-0.57; P-trend < .01), metabolic syndrome (OR = 0.56; 95%CI, 0.43-0.71; P-trend < .01), diabetes (OR = 0.68; 95%CI, 0.49-0.95; P-trend < .05), and cardiovascular disease (OR = 0.52; 95%CI, 0.29-0.91; P-trend < .05). Compared with a nonmanual occupation, having a manual occupation was associated with a higher frequency of several CVRF; this association was stronger than that observed for father's occupation. Differences in CVRF across SELs were generally greater in women than in men.
ConclusionsThere are significant social inequalities in CVRF among older adults in Spain. Reducing these inequalities, bringing the levels of CVRF in those from lower SEL in line with the levels seen in higher SEL, could substantially reduce the prevalence of CVRF in the older adult population.
Keywords
Social inequalities in health are unjust and avoidable differences in health status between population groups.1,2 These inequalities are a consequence of individuals’ socioeconomic conditions (SEC), which affect the situation they are born into and grow up, live, work, and grow old in.1,2 There is evidence that lower SEC are associated with increased cardiovascular mortality3–6 and increased prevalence of cardiovascular risk factors (CVRF).3,7–12
Socioeconomic conditions over the life course affect the development and prevalence of CVRF in older adult life.13–17 In Spain, various studies in older people have shown a higher frequency of some CVRF in individuals whose fathers worked in manual occupations.18,19 In addition, a higher prevalence of general obesity and abdominal obesity has been observed in older people with a lower educational level and with manual occupations.20 There are various hypotheses on the mechanisms of the effect of SEC, but the cumulative risk model has the best scientific evidence.14 This model suggests that the cumulative exposure to harm from poorer SEC has an additive effect over the course of life, which negatively affects health.13,21–23
The effect of childhood SEC on CVRF in adult life varies between countries and over time.13 However, we do not know of any study that comprehensively addresses social inequalities in the prevalence of CVRF in older Spanish people. Therefore, in this study we examine the distribution of the main CVRF according to socioeconomic level (SEL) in a sample representative of people aged ≥ 60 years in Spain. Cardiovascular risk factors include both lifestyle factors, which occur first in the natural history of cardiovascular disease (CVD),24 and biological factors, which occur later. Indicators of SEL include father's occupation and the individual's educational level, which reflect the conditions of early life, and the individual's occupation, which represents the conditions that develop later.
METHODSStudy Design and ParticipantsThe data used were taken from the ENRICA study, whose methods have been published previously.25 The ENRICA study was performed with a sample of 11 991 people, representative of the noninstitutionalized Spanish population. For the study, 3518 participants aged ≥ 60 years were selected (Seniors-ENRICA). Data were collected in 3 stages between 2008 and 2010: a) telephone interview on sociodemographic variables, lifestyle, and morbidity; b) first home visit, to collect blood and urine samples, and c) second home visit, to perform a physical examination, including anthropometry and blood pressure, and obtain dietary information.
The study participants gave written informed consent. The study was approved by the Clinical Research Ethics Committee of Hospital Clinic in Barcelona and Hospital Universitario La Paz in Madrid.
Study VariablesIndicators of Socioeconomic LevelThe participants reported their educational level, which was taken as the highest level reached (primary or below, secondary, or university). Occupation and father's occupation corresponded to the last profession performed and was coded according to the National Classification of Occupations in Spain.26 Housewives were assigned the occupation of their spouse. For the analysis, occupations were grouped into manual and nonmanual jobs.
Cardiovascular Risk FactorsFor behavioral CVRF, information was collected on smoking (never smoker, exsmoker, or current smoker) and alcohol consumption (never, no longer drinks alcohol, moderate consumption, or excessive consumption). The cutoff between excessive and moderate alcohol consumption was set at 40g/day in men and 24 g/day in women. Information on diet was obtained using a validated dietary history.27 Adherence to the Mediterranean diet was assessed using MEDAS (Mediterranean Diet Adherence Screener)28: this score ranges from 0-14, with a higher score indicating better adherence; a score ≥ 9 is considered good. Leisure time physical activity was measured in metabolic equivalent (MET-hours/week) using the questionnaire from the EPIC (European Prospective Investigation Into Cancer and Nutrition)-Spain study.25 Overall physical activity was measured with the Cambridge index, which categorizes each individual as inactive, moderately inactive, moderately active, or active.25 Lastly, sedentary lifestyle was estimated using the number of hours per week spent watching television, obtained using the questionnaire from the Harvard Cohort validated for Spain.25
For biological CVRF, weight, height, and waist circumference were measured with standardized procedures. Body mass index (BMI) was calculated by dividing weight in kilograms by height in meters squared, and general obesity was defined as a BMI ≥ 30kg/m2. Abdominal obesity was defined as a waist circumference ≥ 102 cm in men and ≥ 88cm in women.11
Blood pressure was measured under standardized conditions with validated automatic sphygmomanometers,25 and hypertension was defined as a systolic/diastolic blood pressure of ≥ 140/90mmHg or receiving antihypertensive treatment. Laboratory analysis was performed on serum samples taken after 12hours of fasting, in a central laboratory. Lipids were measured using enzymatic techniques. Hypercholesterolemia was defined as total cholesterol ≥ 200mg/dL or receiving pharmacological treatment. Blood glucose levels were measured using the glucose oxidase technique, and diabetes mellitus was defined as a blood glucose level ≥ 126mg/dL or receiving treatment with oral antidiabetics or insulin.
In line with the new harmonized definition, metabolic syndrome was defined as meeting at least 3 of the following 5 criteria: abdominal obesity, blood glucose ≥ 100mg/dL or receiving oral antidiabetics or insulin, systolic blood pressure ≥ 130mmHg or diastolic blood pressure ≥ 85mmHg or receiving antihypertensive drugs, triglycerides ≥ 150mg/dL, and high-density lipoprotein cholesterol < 40mg/dL in men or < 50mg/dL in women.11
Lastly, the study participants reported whether their doctor had diagnosed CVD, defined as ischemic heart disease, stroke, or heart failure. For each individual with no history of CVD, the 10-year risk of fatal CVD was estimated using the SCORE (Systematic Coronary Risk Evaluation) equation29: this equation estimates the risk of CVD based on age, sex, smoking, systolic blood pressure, and total cholesterol. Because risk estimated using SCORE is very sensitive to the effect of age, the risk calculation was adjusted for age assuming all subjects to be 60 years old.
Statistical AnalysisOf an initial 3518 study participants, we excluded those who did not provide information on their educational level (n = 8), profession (n = 294), father's educational level (n = 166), or father's profession (n = 8). We also excluded those with missing data on CVRF, such as BMI (n = 173), alcohol consumption (n = 49), lipidemia (n = 76), blood pressure (n = 22), dietary quality (n = 12), and sedentary lifestyle (n = 11). Thus, the analysis was performed with 2699 individuals. Compared with the excluded participants, the group of included participants was younger, had a higher frequency of men, was more active, and had a higher frequency of metabolic syndrome and of nonmanual father's occupation.
The prevalence of CVRF and of CVD were estimated according to indicators of SEL, for the total sample and for each sex. The associations of educational level, occupation, and father's occupation with CVRF and CVD were summarized with odds ratio (OR) and 95% confidence interval (95%CI) obtained using logistic regression. When the dependent variables had several categories (eg smoking and alcohol consumption or overall physical activity) polytomous logistic regression was used. To study the association between indicators of SEL and mean CVRF values (eg leisure time physical activity, hours of television) or the risk of CVD, linear regression was used, and the results are expressed as the regression coefficient and 95%CI. All models were adjusted for age, except those with risk of fatal CVD (SCORE) as a dependent variable. Analyses of the total sample were also adjusted for sex. Lastly, we examined if the associations were different for men and women, testing the statistical significance of interaction terms defined by the product of the variables of interest by sex.
To reflect the structure of the Spanish population and account for random errors derived from the complex sample design, the analyses were performed with the STATA survey procedure (version 13.0, StataCorp.; College Station, Texas, Estados Unidos).
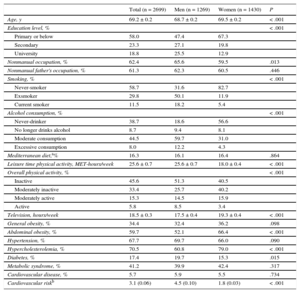
RESULTSThe mean age of the study participants was 68.7 years, and 53% were female. Regarding indicators of SEL, 18.8% had university-level education, 62.4% had a nonmanual occupation, and 61.3% of the participants’ fathers had had a nonmanual occupation. At least 60% of the participants had abdominal obesity, hypertension, or hypercholesterolemia. In addition, 41.2% had metabolic syndrome, 17.4% had diabetes, and over 5% had a diagnosis of CVD (Table 1). The characteristics of the participants, stratified by educational level, occupation, and paternal occupation can be seen in the supplementary material.
Characteristics of Study Participants, by Sex
| Total (n = 2699) | Men (n = 1269) | Women (n = 1430) | P | |
|---|---|---|---|---|
| Age, y | 69.2 ± 0.2 | 68.7 ± 0.2 | 69.5 ± 0.2 | < .001 |
| Education level, % | < .001 | |||
| Primary or below | 58.0 | 47.4 | 67.3 | |
| Secondary | 23.3 | 27.1 | 19.8 | |
| University | 18.8 | 25.5 | 12.9 | |
| Nonmanual occupation, % | 62.4 | 65.6 | 59.5 | .013 |
| Nonmanual father's occupation, % | 61.3 | 62.3 | 60.5 | .446 |
| Smoking, % | < .001 | |||
| Never-smoker | 58.7 | 31.6 | 82.7 | |
| Exsmoker | 29.8 | 50.1 | 11.9 | |
| Current smoker | 11.5 | 18.2 | 5.4 | |
| Alcohol consumption, % | < .001 | |||
| Never-drinker | 38.7 | 18.6 | 56.6 | |
| No longer drinks alcohol | 8.7 | 9.4 | 8.1 | |
| Moderate consumption | 44.5 | 59.7 | 31.0 | |
| Excessive consumption | 8.0 | 12.2 | 4.3 | |
| Mediterranean diet,a% | 16.3 | 16.1 | 16.4 | .864 |
| Leisure time physical activity, MET-hours/week | 25.6 ± 0.7 | 25.6 ± 0.7 | 18.0 ± 0.4 | < .001 |
| Overall physical activity, % | < .001 | |||
| Inactive | 45.6 | 51.3 | 40.5 | |
| Moderately inactive | 33.4 | 25.7 | 40.2 | |
| Moderately active | 15.3 | 14.5 | 15.9 | |
| Active | 5.8 | 8.5 | 3.4 | |
| Television, hours/week | 18.5 ± 0.3 | 17.5 ± 0.4 | 19.3 ± 0.4 | < .001 |
| General obesity, % | 34.4 | 32.4 | 36.2 | .098 |
| Abdominal obesity, % | 59.7 | 52.1 | 66.4 | < .001 |
| Hypertension, % | 67.7 | 69.7 | 66.0 | .090 |
| Hypercholesterolemia, % | 70.5 | 60.8 | 79.0 | < .001 |
| Diabetes, % | 17.4 | 19.7 | 15.3 | .015 |
| Metabolic syndrome, % | 41.2 | 39.9 | 42.4 | .317 |
| Cardiovascular disease, % | 5.7 | 5.9 | 5.5 | .734 |
| Cardiovascular riskb | 3.1 (0.06) | 4.5 (0.10) | 1.8 (0.03) | < .001 |
Unless otherwise indicated, the data are expressed as mean ± standard deviation.
In comparison with men, women had a lower educational level and their occupations were more frequently manual. In addition, they consumed tobacco and alcohol more frequently, did less physical activity, and were more sedentary. Lastly, they had a higher prevalence of obesity, hypercholesterolemia, and metabolic syndrome, but a lower prevalence of diabetes and CVD risk (SCORE) (Table 1).
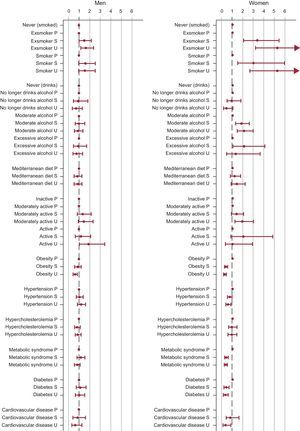
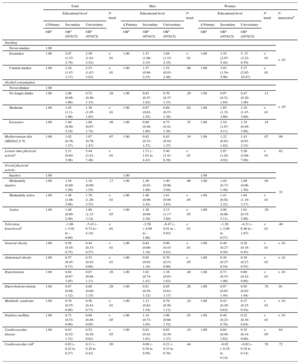
Table 2 and the Figure show the association between educational level and prevalence of CVRF. In the age- and sex-adjusted analyses, there was a higher frequency of exsmokers and current smokers in the higher educational levels. In progressively higher educational levels, the frequency of moderate alcohol consumption and of physical activity (leisure time and overall) were higher, and the number of hours watching television was lower. There was also an inverse educational gradient for obesity, metabolic syndrome, diabetes, and CVD. However, there were no differences in CVD risk (SCORE) according to education level. In general, the associations observed in this study were greater in women than in men (P-interaction < .05) except for Mediterranean diet adherence, physical activity, sedentary lifestyle, hypercholesterolemia, and CVD. Compared with women with a primary level or below education, those with a university education had more favorable values for all risk factors except smoking, which was much more frequent in those with a university level education (Table 2). The educational gradient was especially strong for obesity, hypertension, metabolic syndrome, diabetes, and CVD, with university-educated women having these conditions at a frequency at least 40% lower than those with primary level or below education.

Association Between Educational Level and Main Cardiovascular Risk Factors in Older Adults in Spain, by Sex
| Total | Men | Women | |||||||||||
|---|---|---|---|---|---|---|---|---|---|---|---|---|---|
| Educational level | P-trend | Educational level | P-trend | Educational level | P-trend | P-interactionb | |||||||
| ≤ Primary | Secondary | Universitary | ≤ Primary | Secondary | Universitary | ≤ Primary | Secondary | Universitary | |||||
| ORa | ORa (95%CI) | ORa (95%CI) | ORa | ORa (95%CI) | ORa (95%CI) | ORa | ORa ((95%CI) | ORa ((95%CI) | |||||
| Smoking | < .01 | ||||||||||||
| Never-smoker | 1.00 | ||||||||||||
| Exsmoker | 1.00 | 2.07 (1.53-2.79) | 2.59 (1.91-3.52) | < .01 | 1.00 | 1.47 (1.00-2.15) | 1.64 (1.15-2.35) | < .01 | 1.00 | 3.35 (2.07-5.44) | 5. 27 (3.23-8.59) | < .01 | |
| Current smoker | 1.00 | 2.16 (1.47-3.17) | 2.53 (1.67-3.83) | < .01 | 1.00 | 1.57 (0.98-2.53) | 1.52 (0.93-2.48) | .06 | 1.00 | 3.03 (1.54-5.96) | 5.27 (2.65-10.47) | < .01 | |
| Alcohol consumption | < .05 | ||||||||||||
| Never-drinker | 1.00 | ||||||||||||
| No longer drinks | 1.00 | 1.06 (0.68-1.66) | 0.72 (0.46-1.15) | .28 | 1.00 | 0.93 (0.47-1.82) | 0.70 (0.37-1.33) | .29 | 1.00 | 0.97 (0.51-1.84) | 0.47 (0.20-1.06) | .13 | |
| Moderate | 1.00 | 1.45 (1.11-1.90) | 1.39 (1.05-1.85) | < .01 | 1.00 | 0.97 (0.62-1.52) | 0.89 (0.57-1.38) | .62 | 1.00 | 1.85 (1.32-2.60) | 2.10 (1.47-3.00) | < .01 | |
| Excessive | 1.00 | 1.40 (0.90-2.18) | 1.08 (0.67-1.74) | .49 | 1.00 | 0.90 (0.48-1.69) | 0.75 (0.41-1.36) | .35 | 1.00 | 2.10 (1.07-4.11) | 1.34 (0.49-3.66) | .18 | |
| Mediterranean diet (MEDAS ≥ 9) | 1.00 | 1.02 (0.76-1.37) | 1.07 (0.79-1.47) | .67 | 1.00 | 0.82 (0.53-1.27) | 0.83 (0.54-1.27) | .34 | 1.00 | 1.22 (0.82-1.82) | 1.43 (0.91-2.23) | .07 | .08 |
| Leisure time physicial activityc | 2.31 (0.64-3.98) | 5.44 (3.41-7.46) | < .01 | 1.71 (–1.01 to 4.43) | 5.40 (2.41-8.39) | < .01 | 2.97 (1.02-4.92) | 5.26 (2.66-7.86) | < .01 | .82 | |||
| Overal physicial activity | .32 | ||||||||||||
| Inactive | 1.00 | 1.00 | 1.00 | ||||||||||
| Moderately inactive | 1.00 | 1.16 (0.89-1.50) | 1.18 (0.90-1.55) | .17 | 1.00 | 1.36 (0.93-1.99) | 1.40 (0.96-2.04) | .06 | 1.00 | 1.04 (0.73-1.49) | 1.00 (0.66-1.50) | .94 | |
| Moderately active | 1.00 | 1.48 (1.06-2.06) | 1.79 (1.26-2.53) | < .01 | 1.00 | 1.48 (0.90-2.42) | 1.61 (0.98-2.63) | < .05 | 1.00 | 1.43 (0.92-2.22) | 1.94 (1.19-3.17) | < .01 | |
| Active | 1.00 | 1.49 (0.89-2.49) | 1.88 (1.13-3.14) | < .05 | 1.00 | 1.28 (0.69-2.38) | 2.13 (1.17-3.89) | < .05 | 1.00 | 2.09 (0.86-5.11) | 1.01 (0.35-2.96) | .39 | |
| Television, hours/weekc | –1.86 (–3.02 to –0.69) | –5.43 (–6.72 to –4.14) | < .01 | –2.58 (–4.09 to –1.06) | –6.47 (–8.01 to –4.93) | < .01 | –1.20 (–2.96 to 0.57) | –4.21 (–6.46 to –1.97) | < .01 | .40 | |||
| General obesity | 1.00 | 0.58 (0.45-0.75) | 0.44 (0.33-0.57) | < .01 | 1.00 | 0.84 (0.60-1.18) | 0.60 (0.43-0.83) | < .01 | 1.00 | 0.40 (0.27-0.59) | 0.28 (0.18-0.45) | < .01 | < .01 |
| Abdominal obesity | 1.00 | 0.57 (0.45-0.73) | 0.53 (0.42-0.68) | < .01 | 1.00 | 0.85 (0.62-1.18) | 0.70 (0.51-0.96) | < .05 | 1.00 | 0.38 (0.27-0.54) | 0.39 (0.27-0.55) | < .01 | < .01 |
| Hypertension | 1.00 | 0.84 (0.67-1.05) | 0.87 (0.68-1.11) | .16 | 1.00 | 1.02 (0.74-1.41) | 1.16 (0.83-1.63) | .40 | 1.00 | 0.73 (0.53-1.00) | 0.60 (0.42-0.86) | < .01 | < .01 |
| Hipercholesterolemia | 1.00 | 0.87 (0.68-1.12) | 0.89 (0.69-1.15) | .29 | 1.00 | 0.81 (0.58-1.12) | 0.85 (0.61-1.17) | .26 | 1.00 | 0.97 (0.65-1.44) | 0.95 (0.62-1.44) | .78 | .91 |
| Metabolic syndrome | 1.00 | 0.70 (0.55-0.88) | 0.56 (0.43-0.71) | < .01 | 1.00 | 1.13 (0.82-1.54) | 0.79 (0.56-1.11) | .24 | 1.00 | 0.43 (0.29-0.63) | 0.37 (0.25-0.54) | < .01 | < .01 |
| Diabetes mellitus | 1.00 | 0.72 (0.53-0.99) | 0.68 (0.49-0.95) | < .05 | 1.00 | 1.10 (0.73-1.65) | 1.00 (0.66-1.52) | .93 | 1.00 | 0.40 (0.23-0.70) | 0.32 (0.16-0.64) | < .01 | < .01 |
| Cardiovascular disease | 1.00 | 0.83 (0.52-1.33) | 0.52 (0.29-0.91) | < .05 | 1.00 | 0.83 (0.42-1.63) | 0.62 (0.30-1.27) | .19 | 1.00 | 0.84 (0.44-1.62) | 0.35 (0.14-0.89) | < .05 | .63 |
| Cardiovascular riskc | 0.03 (–0.22 to 0.27) | 0.11 (–0.20 to 0.43) | .50 | 0.09 (–0.38 to 0.56) | 0.21 (–0.33 to 0.76) | .44 | –0.02 (–0.18 to 0.14) | –0.02 (–0.18 to 0.14) | .78 | .72 | |||
95CI%, 95% confidence interval; MEDAS, Mediterranean Diet Adherence Screener; OR, odds ratio.
Statistically significant results (P < .05).
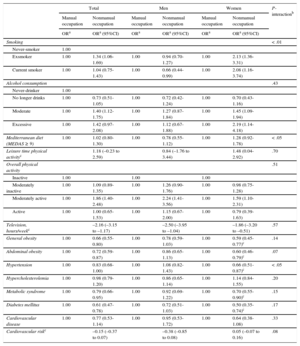
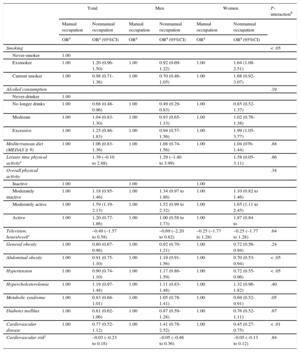
Table 3 shows the results according to occupation type. Compared with manual workers, nonmanual workers consumed alcohol more frequently, did more physical activity, and were less sedentary. In addition, nonmanual workers had a lower frequency of obesity, hypertension, metabolic syndrome, and diabetes. There were some differences between the sexes regarding the association between occupation and CVRF prevalence. Among nonmanual workers, men had a lower frequency of current smokers, but women had a higher percentage of exsmokers and current smokers (P-interaction < .01). As with educational differences, the occupational differences for various CVRF were greater in women than in men, in particular for obesity, hypertension, and metabolic syndrome (P-interaction < .05 in all cases). In women, the relative difference in the prevalence of these factors between manual and nonmanual occupations was greater than 30%.
Association Between Occupation and Main Cardiovascular Risk Factors in Older Adults in Spain, by Sex
| Total | Men | Women | P-interactionb | ||||
|---|---|---|---|---|---|---|---|
| Manual occupation | Nonmanual occupation | Manual occupation | Nonmanual occupation | Manual occupation | Nonmanual occupation | ||
| ORa | ORa (95%CI) | ORa | ORa (95%CI) | ORa | ORa (95%CI) | ||
| Smoking | < .01 | ||||||
| Never-smoker | 1.00 | ||||||
| Exsmoker | 1.00 | 1.34 (1.06-1.69) | 1.00 | 0.94 (0.70-1.27) | 1.00 | 2.13 (1.36-3.31) | |
| Current smoker | 1.00 | 1.04 (0.75-1.43) | 1.00 | 0.66 (0.44-0.99) | 1.00 | 2.08 (1.16-3.74) | |
| Alcohol consumption | .43 | ||||||
| Never-drinker | 1.00 | ||||||
| No longer drinks | 1.00 | 0.73 (0.51-1.05) | 1.00 | 0.72 (0.42-1.24) | 1.00 | 0.70 (0.43-1.16) | |
| Moderate | 1.00 | 1.40 (1.12-1.75) | 1.00 | 1.27 (0.87-1.84) | 1.00 | 1.45 (1.09-1.94) | |
| Excessive | 1.00 | 1.42 (0.97-2.08) | 1.00 | 1.12 (0.67-1.88) | 1.00 | 2.19 (1.14-4.18) | |
| Mediterranean diet (MEDAS ≥ 9) | 1.00 | 1.02 (0.80-1.30) | 1.00 | 0.78 (0.55-1.12) | 1.00 | 1.28 (0.92-1.78) | < .05 |
| Leisure time physical activityc | 1.18 (–0.23 to 2.59) | 0.84 (–1.76 to 3.44) | 1.48 (0.04-2.92) | .70 | |||
| Overall physical activity | .51 | ||||||
| Inactive | 1.00 | 1.00 | 1.00 | ||||
| Moderately inactive | 1.00 | 1.09 (0.89-1.35) | 1.00 | 1.26 (0.90-1.76) | 1.00 | 0.98 (0.75-1.28) | |
| Moderately active | 1.00 | 1.86 (1.40-2.48) | 1.00 | 2.24 (1.41-3.56) | 1.00 | 1.59 (1.10-2.31) | |
| Active | 1.00 | 1.00 (0.65-1.53) | 1.00 | 1.15 (0.67-2.00) | 1.00 | 0.79 (0.39-1.63) | |
| Television, hours/weekc | –2.16 (–3.15 to –1.17) | –2.50 (–3.95 to –1.04) | –1.86 (–3.20 to –0.51) | .57 | |||
| General obesity | 1.00 | 0.66 (0.55-0.80) | 1.00 | 0.78 (0.59-1.03) | 1.00 | 0.59 (0.45-0.77)c | .14 |
| Abdominal obesity | 1.00 | 0.72 (0.59-0.87) | 1.00 | 0.86 (0.65-1.13) | 1.00 | 0.60 (0.46-0.79)c | .07 |
| Hypertension | 1.00 | 0.83 (0.68-1.00) | 1.00 | 1.08 (0.82-1.43) | 1.00 | 0.66 (0.51-0.87)c | < .05 |
| Hypercholesterolemia | 1.00 | 0.98 (0.79-1.20) | 1.00 | 0.86 (0.65-1.14) | 1.00 | 1.14 (0.84-1.55) | .20 |
| Metabolic syndrome | 1.00 | 0.79 (0.66-0.95) | 1.00 | 0.92 (0.69-1.22) | 1.00 | 0.70 (0.55-0.90)c | .15 |
| Diabetes mellitus | 1.00 | 0.61 (0.47-0.78) | 1.00 | 0.72 (0.51-1.03) | 1.00 | 0.50 (0.35-0.74)c | .17 |
| Cardiovascular disease | 1.00 | 0.77 (0.53-1.14) | 1.00 | 0.95 (0.53-1.72) | 1.00 | 0.64 (0.38-1.08) | .33 |
| Cardiovascular riskc | –0.15 (–0.37 to 0.07) | –0.38 (–0.85 to 0.08) | 0.05 (–0.07 to 0.16) | .08 | |||
95CI%, 95% confidence interval; MEDAS, Mediterranean Diet Adherence Screener; OR, odds ratio.
Statistically significant results (P < .05).
To examine if the association between occupation and prevalence of CVRF was independent of educational level (usually reached before occupation), the analysis was repeated with additional adjustment for education. Most of the associations showed a reduced magnitude; however, in the total sample, there remained a statistically significant association between nonmanual occupation and being a current smoker (OR = 0.66; 95%CI, 0.46-0.95), being a moderate drinker (OR = 1.27; 95%CI, 1.00-1.63), and having a moderate physical activity level (OR = 1.65; 95%CI, 1.21-2.25).
The results according to father's occupation showed the same direction as for own occupation, but the magnitude of the associations and the differences between sexes were smaller (Table 4). That did not preclude the finding that women whose fathers had a nonmanual occupation were more frequently exsmokers, consumed more alcohol, did more physical activity, and had a lower prevalence of obesity, hypertension, metabolic syndrome, and CVD than those whose fathers had a manual occupation. The relative difference in the prevalence of these cardiometabolic disorders between these 2 social categories was generally 30% or more.
Association Between Father's Occupation and Main Cardiovascular Risk Factors in Older Adults in Spain, by Sex
| Total | Men | Women | P-interactionb | ||||
|---|---|---|---|---|---|---|---|
| Manual occupation | Nonmanual occupation | Manual occupation | Nonmanual occupation | Manual occupation | Nonmanual occupation | ||
| ORa | ORa (95%CI) | ORa | ORa (95%CI) | ORa | ORa (95%CI) | ||
| Smoking | < .05 | ||||||
| Never-smoker | 1.00 | ||||||
| Exsmoker | 1.00 | 1.20 (0.96-1.50) | 1.00 | 0.92 (0.69-1.22) | 1.00 | 1.64 (1.08-2.51) | |
| Current smoker | 1.00 | 0.98 (0.71-1.36) | 1.00 | 0.70 (0.46-1.05) | 1.00 | 1.68 (0.92-3.07) | |
| Alcohol consumption | .19 | ||||||
| Never-drinker | 1.00 | ||||||
| No longer drinks | 1.00 | 0.68 (0.48-0.96) | 1.00 | 0.49 (0.29-0.83) | 1.00 | 0.85 (0.52-1.37) | |
| Moderate | 1.00 | 1.04 (0.83-1.30) | 1.00 | 0.93 (0.65-1.33) | 1.00 | 1.02 (0.76-1.38) | |
| Excessive | 1.00 | 1.25 (0.86-1.83) | 1.00 | 0.94 (0.57-1.56) | 1.00 | 1.99 (1.05-3.77) | |
| Mediterranean diet (MEDAS ≥ 9) | 1.00 | 1.06 (0.83-1.36) | 1.00 | 1.08 (0.74-1.56) | 1.00 | 1.04 (076-1.44) | .88 |
| Leisure time physical activityc | 1.39 (–0.10 to 2.88) | 1.29 (–1.40 to 3.99) | 1.58 (0.05-3.11) | .86 | |||
| Overall physical activity | .34 | ||||||
| Inactive | 1.00 | 1.00 | 1.00 | ||||
| Moderately inactive | 1.00 | 1.18 (0.95-1.46) | 1.00 | 1.34 (0.97 to 1.86) | 1.00 | 1.10 (0.82 to 1.46) | |
| Moderately active | 1.00 | 1.59 (1.19-2.13) | 1.00 | 1.52 (0.99 to 2.32) | 1.00 | 1.65 (1.11 to 2.45) | |
| Active | 1.00 | 1.20 (0.77-1.86) | 1.00 | 1.00 (0.58 to 1.73) | 1.00 | 1.87 (0.84 to | |
| Television, hours/weekc | –0.49 (–1.57 to 0.58) | –0.69 (–2.20 to 0.82) | –0.25 (–1.77 to 1.28) | –0.25 (–1.77 to 1.28) | .64 | ||
| General obesity | 1.00 | 0.80 (0.67-0.96) | 1.00 | 0.92 (0.70-1.21) | 1.00 | 0.72 (0.56-0.94) | .24 |
| Abdominal obesity | 1.00 | 0.91 (0.75-1.10) | 1.00 | 1.19 (0.91-1.56) | 1.00 | 0.70 (0.53-0.94) | < .05 |
| Hypertension | 1.00 | 0.90 (0.74-1.10) | 1.00 | 1.17 (0.86-1.59) | 1.00 | 0.72 (0.55-0.96) | < .05 |
| Hypercholesterolemia | 1.00 | 1.19 (0.97-1.48) | 1.00 | 1.11 (0.83-1.48) | 1.00 | 1.32 (0.96-1.82) | .40 |
| Metabolic syndrome | 1.00 | 0.83 (0.68-1.01) | 1.00 | 1.05 (0.78-1.41) | 1.00 | 0.69 (0.52-0.91) | .05 |
| Diabetes mellitus | 1.00 | 0.81 (0.62-1.06) | 1.00 | 0.87 (0.59-1.28) | 1.00 | 0.76 (0.52-1.11) | .67 |
| Cardiovascular disease | 1.00 | 0.77 (0.52-1.12) | 1.00 | 1.41 (0.78-2.52) | 1.00 | 0.45 (0.27-0.75) | < .01 |
| Cardiovascular riskc | –0.03 (–0.23 to 0.18) | –0.05 (–0.46 to 0.36) | –0.05 (–0.13 to 0.12) | .84 | |||
95CI%, 95% confidence interval; MEDAS, Mediterranean Diet Adherence Screener; OR, odds ratio.
Statistically significant results (P < .05).
The results of this cross-sectional study show significant social inequalities in CVRF in older people in Spain. These inequalities can be seen for all 3 indicators of SEL studied, but are more marked for educational level and occupation than for father's occupation. They also affect both behavioral CVRF such as smoking and alcohol, physical activity and sedentary lifestyle, and biological CVRF, especially those linked to lifestyle, such as obesity, metabolic syndrome, and diabetes. Lastly, these inequalities manifest themselves in CVD prevalence. In general, the inequalities are greater in women than in men.
These results cannot be compared directly with those of previous studies because the association between SEL and CVRF prevalence can vary according to geographical context,30,31 time period,32 and the degree of adjustment for potential mediators (including SEC in different stages of life).18 Nonetheless, our results are consistent with most of the literature in Anglo-Saxon countries and in Spain.3,10 For example, in a study we conducted in 2000-2001 with 4000 people representative of the Spanish population aged 60 years and older, BMI and waist circumference showed a clear inverse association with educational level and occupation in women, but not in men.20 In the same study, men whose fathers had a manual occupation had a higher prevalence of smoking, excessive alcohol consumption, and hypertension, and women whose fathers had a manual occupation had a higher frequency of physical inactivity, general and abdominal obesity, and diabetes.18 However, in a previous study, we observed a higher frequency of hypertension in men and women from a lower SEL19; this finding was not confirmed in the present study. Our results expand the existing knowledge in this field, because they are the only results available from a sample that is representative of older adults in Spain in the recent past and they include a broader set of CVRF than most previous studies.
The associations in this study were generally stronger in women than in men. This may be due to social changes in recent decades in Spain affecting women more than men, for example incorporation into higher education and paid work. These changes may have facilitated the adoption of behaviors previously associated with men (such as smoking and alcohol consumption), especially in women from higher SELs. In addition, in women, adopting healthy behaviors can be symbolic and may be a reflection of better material conditions,10 which could explain why being a current smoker and being an exsmoker were more frequent in persons with a higher educational and occupational level, particularly in women. This phenomenon has been observed in other studies in older Spanish people.18,33 In addition, smoking cessation varied according to sex at the end of the last century in Spain: in men, the smoking cessation rate increased in both manual and nonmanual workers, whereas in women, it increased only in those with nonmanual occupations.34
No association was observed between SEL and adherence to Mediterranean diet or risk of fatal CVD. Our results on diet contrast with those from the PREDIMED study, in which people with a lower level of education adhered less to the Mediterranean diet, although the differences between educational groups were small.33 The Mediterranean diet is suffering a progressive decline in Spain, but older people are those who adhere to it most.35 This may reflect habits acquired in childhood and maintained throughout life in cohorts born more than 60 years ago. Furthermore, in older age, diet can be a consequence of health status and medical prescriptions. Because of this, and because access to health services is universal and free in Spain, it is plausible that the differences in diet according to SEL in older people are small. Regarding the lack of association between SEL and CVD risk, this may be due to a direct association between smoking and SEL, or to a null or inverse association with the other components of the equation, such as blood pressure, cholesterol, and diabetes. In addition, the SCORE equation does not include physical activity, sedentary lifestyle, or obesity, which are factors strongly associated with SEL.
Are the associations between SEL and CVRF causal? To be causal, they must meet certain criteria.36 This study shows, firstly, that the strength of the associations is generally at least moderate. Secondly, there is a dose-response relationship with educational level. Thirdly, although the study design is cross-sectional, the indicators of SEL reflect circumstances that occur prior to the CVRF measured in the study; follow-up of the birth cohorts would be useful to confirm the results of cross-sectional studies in adult age. Fourthly, the associations are reasonable consistent, as they have been observed for both behavioral CVRF (reported) and biological CVRF (based on objective measurements) and they coincide with the results of many previous studies. Lastly, they are plausible. The development of CVRF begins in the intrauterine period and childhood,37 and it is reasonable to think that SEC in the early stages of life play a role in this process.14 Socioeconomic conditions reflect, among other aspects, the access individuals have to certain opportunities and privileges in life, including accurate information on healthy lifestyle, greater interest in maintaining and improving health, the income necessary to do so, and a physical and social context in which that is easier. Socioeconomic conditions can also determine the degree of access to better occupations, with less physicochemical and psychosocial hazards, which favor healthy behavior and better access to good quality health services. In light of all these factors, we think that the associations between SEL and CVRF are, at least partly, causal.3
There are some methodological aspects of this study worth mentioning. Firstly, it is a descriptive study, therefore it has only shown the magnitude of the associations between SEL and CVRF in the older people; future studies must explain these better. However, the fact that some association between occupation and CVRF is maintained after adjusting for education suggests that the SEC in childhood do not completely account for cardiovascular health in adult age and that interventions in subsequent stages of life are needed to reduce inequalities. Secondly, compared with participants in the European Health Survey in Spain in 2009, those from the Seniors-ENRICA study had a lower percentage of primary level or below education (in men it was 10 percentage points lower) and a slightly higher percentage of university level studies.25 Telephone questionnaires overrepresent people with higher education compared with face-to-face questionnaires.38 Furthermore, in many health questionnaires the percentage of responders is higher in those with higher education.25 Another limitation is the exclusion from the analysis of 819 individuals with missing data on the variables of interest. It is difficult to know the effect these compositional aspects of the sample analyzed had on the study results. Thirdly, given that occupation was analyzed using only 2 categories (manual and nonmanual), the differences associated with CVRF could have been underestimated.
CONCLUSIONSThere are significant inequalities in CVRF in older adults in Spain. Reducing these inequalities, bringing the CVRF levels in people from lower SELs in line with those in higher SELs could substantially reduce the prevalence of CVRF in older adults. These inequalities also need to be reduced for reasons of social justice: they partly reflect the SEC of childhood, over which individuals have no control, and it is likely that a substantial part of these conditions are not due to the individual's effort or personal values throughout life.39 Lastly, this study has important clinical implications, as it supports the practice of medicine with misericord--from the Latin misericordia: misere (mercy, compassion), cordis (heart), and ia (towards others)--or, “a heart in solidarity with those in need.” Misericord is not only a feeling, but also an attitude. It embodies the finest tradition of clinical practice, in which healthcare professionals evaluate their patients’ standards of living and health needs and compensate for these with particular attention and therapeutic intensity for those who are most in need, partly because of their SEL. Furthermore, because these patients’ needs are greater, they may benefit more from clinical intervention.
FUNDINGThe data used were from the ENRICA study, which was funded by Sanofi-Aventis. The funding for this specific analysis came from the projects FIS PI12/1166 and FIS PI13/02321 (Instituto de Salud Carlos III and FEDER/SEE), Plan Nacional Sobre Drogas 02/2014, FRAILOMIC (European Union FP7-HEALTH-2012-Proposal no. 305483-2) and the Cátedra UAM de Epidemiología y Control del Riesgo Cardiovascular.
CONFLICTS OF INTERESTNone declared.
- -
Worse socioeconomic conditions are associated with higher cardiovascular mortality and higher prevalence of cardiovascular risk factors.
- -
The influence of childhood socioeconomic conditions on cardiovascular risk factors in adult life varies among countries and over time.
- -
The cardiovascular health of older adults in Spain in 2008-2010 is worse in those with primary level or below education than in those with a university education, and in manual workers than in nonmanual workers.
- -
These inequalities affect behavioral risk factors (smoking and alcohol consumption, physical activity and sedentary lifestyle), biological risk factors (obesity, metabolic syndrome, diabetes), and cardiovascular disease prevalence.
- -
Inequalities are greater in women than in men.
- -
Reducing these inequalities, bringing the levels of cardiovascular risk factors in people from lower socioeconomic levels in line with those in higher levels, would substantially reduce the prevalence of cardiovascular risk factors in older adults.