Approximately 20% to 40% of clinically defined familial hypercholesterolemia cases do not show a causative mutation in candidate genes, and some of them may have a polygenic origin. A cholesterol gene risk score for the diagnosis of polygenic hypercholesterolemia has been demonstrated to be valuable to differentiate polygenic and monogenic hypercholesterolemia. The aim of this study was to determine the contribution to low-density lipoprotein cholesterol (LDL-C) of the single nucleotide variants associated with polygenic hypercholesterolemia in probands with genetic hypercholesterolemia without mutations in candidate genes (nonfamilial hypercholesterolemia genetic hypercholesterolemia) and the genetic score in cascade screening in their family members.
MethodsWe recruited 49 nonfamilial hypercholesterolemia genetic hypercholesterolemia families (294 participants) and calculated cholesterol gene scores, derived from single nucleotide variants in SORT1, APOB, ABCG8, APOE and LDLR and lipoprotein(a) plasma concentration.
ResultsRisk alleles in SORT1, ABCG8, APOE, and LDLR showed a statistically significantly higher frequency in blood relatives than in the 1000 Genomes Project. However, there were no differences between affected and nonaffected members. The contribution of the cholesterol gene score to LDL-C was significantly higher in affected than in nonaffected participants (P = .048). The percentage of the LDL-C variation explained by the score was 3.1%, and this percentage increased to 6.9% in those families with the highest genetic score in the proband.
ConclusionsNonfamilial hypercholesterolemia genetic hypercholesterolemia families concentrate risk alleles for high LDL-C. Their contribution varies greatly among families, indicating the complexity and heterogeneity of these forms of hypercholesterolemias. The gene score explains a small percentage of LDL-C, which limits its use in diagnosis.
Keywords
Familial hypercholesterolemia (FH) is a genetic disorder characterized by very high plasma total cholesterol concentrations, due to increased low-density lipoprotein cholesterol (LDL-C), with a high risk of premature coronary heart disease.1 Traditionally, FH has been described as a monogenic disease, with autosomal codominant transmission and an estimated prevalence of around 1:500 in the general population.1 Recent studies have revealed that clinically defined FH is probably more common than previously reported, with a prevalence of 1:217 in the Copenhagen General Population study, which analyzed the general population.2 This prevalence is as high as 1:70 in some populations with a founder gene effect, such as Afrikaners from South Africa.3 Familial hypercholesterolemia is caused by mutations in LDLR, the gene coding for the LDL receptor; APOB, coding for apolipoprotein B4; and PCSK9, which codes for the enzyme proprotein convertase subtilisin/kexin type 9.5 Two new putative loci causing FH have been identified: the p. (Leu167del) mutation in APOE,6 and several mutations in the signal transducing adaptor family member STAP1.7 However, no causative mutation is found in candidate genes in approximately 20% to 40% of clinically defined FH cases.8 Possible explanations for these data are the existence of other undiscovered genes, despite extensive negative studies using exome sequencing analysis,9 the lack of specificity of current clinical diagnostic criteria for FH diagnosis to identify a monogenic disorder, and the fact that lipid phenotype and familial presentation within the family of some polygenic hypercholesterolemias fully overlap with genetically defined FH. The latter seems to be the case in many clinically defined FH patients, as elegantly demonstrated by Talmud et al.10 In full agreement with the polygenic background of some clinically defined FH, our team has recently studied a group of families with a clinical diagnosis of FH but without a causative mutation in candidate genes; in these families, the results of familial segregation and heritability of cholesterol were compatible with a polygenic-rather than a monogenic-disease. Consequently, the term non-FH genetic hypercholesterolemia (NFHGH) seems a more appropriate designation for this type of hypercholesterolemia.11 The characterization of the monogenic or polygenic genetic component of a specific hypercholesterolemia may have clinical implications, including genetic cascade screening, genetic counseling, or coronary heart disease risk assessment, as well as administrative issues related to prescription or reimbursement of certain drugs specially indicated for monogenic FH.12
A cholesterol genetic risk score for the diagnosis of polygenic hypercholesterolemia has been demonstrated to be of value in differentiating polygenic from monogenic hypercholesterolemias and has been validated in distinct cohorts from Europe, Canada, Israel, and Korea.10–13 However, this genetic score has not been previously studied in suspected affected families. A strong family history of hypercholesterolemia is present in many persons with NFHGH and therefore family studies would be very useful to confirm the contribution of the accumulation of common small-effect LDL-C-raising alleles as the cause of hypercholesterolemia in certain families, and importantly, to establish whether this score could be useful in identifying affected family members in cascade screening. Therefore, we calculated the cholesterol gene score, derived from 6 common LDL-C-raising single nucleotide variants (SNVs) in 5 genes and lipoprotein(a) plasma concentrations, a genetically determined type of lipoprotein that contributes to cholesterol concentration, in a sample of 49 families with NFHGH, that is, with clinical diagnosis of FH but without a causative mutation in the FH candidate genes.
MethodsParticipantsThe protocol has been previously reported.11 Briefly, NFHGH participants were consecutively invited to participate in this family study. Inclusion criteria for the probands included: age older than 18 years old, total cholesterol and LDL-C above the 95th percentile and triglycerides below the 90th percentile according to age and sex distribution in Spanish population,13 at least 1 first degree family member with LDL-C above the 90th percentile and > 6 points according to Dutch Lipid Clinic Network criteria,12 3 living first-degree family members, and the absence of FH pathogenic mutations in LDLR, APOB, and PCSK9 genes studied by the Lipochip platform,8 a genetic diagnostic platform, a microarray for the detection of common Spanish mutations in these 3 genes, including copy number variation in LDLR and large rearrangements, followed by sequencing analysis of the coding regions of LDLR and exon 26 of APOB, when the result was negative. Secondary causes of hypercholesterolemia and the presence of the APOE ¿2/¿2 genotype or the p. (Leu167del) mutation in APOE were also exclusion criteria in the probands. From each selected proband, we tried to recruit the highest number of relatives, including parents, siblings, spouses, children, nephews, and nieces. Before any research procedure, all participants signed informed consent forms approved by our local ethics board committee (Comité Ético de Investigación de Aragón). Hypercholesterolemia in family members was defined by the presence of LDL-C values above the 90th age- and sex-adjusted percentile.14
Clinical and Laboratory DeterminationsProbands and family members were assessed for a personal and familial history of cardiovascular disease, medication use, and cardiovascular risk factors. Ethylenediaminetetraacetic acid plasma and serum samples were collected after at least 10hours of fasting in all participants after 6 weeks without lipid-lowering drugs. Total cholesterol and triglyceride levels were determined by standard enzymatic methods. High-density lipoprotein cholesterol was measured directly by an enzymatic reaction using cholesterol oxidase (UniCel DxC 800; Beckman Coulter Inc., Brea, California, United States). Lipoprotein(a), apolipoprotein A1, apolipoprotein B, and C-reactive protein were determined by IMMAGE kinetic nephelometry (Beckman Coulter Inc.). The LDL-C was calculated using Friedewald's formula.
Genetic AnalysisGenomic DNA from whole blood samples was isolated using standard methods. The SNVs of the SORT1, APOB, ABCG8, and LDLR genes were genotyped with TaqMan probes using standard methods. The APOE genotype was determined by DNA sequencing of exon 4, as previously described.15
Statistical AnalysisAnalyses were performed using SPSS version 20.0 (Chicago, Ilinois, United States). The nominal level for significance was P < .05. Normal distribution of variables was analyzed by the Kolmogorov–Smirnov test. Quantitative variables with normal distribution were expressed as the mean ± standard deviation and were analyzed by the Student t test. Variables with a skewed distribution were expressed as median and interquartile range and were analyzed by the Mann-Whitney U test. Qualitative variables were expressed as percentage and were analyzed by the chi-square test. To compare the allele frequency of genetic variants, we used the chi-square test between wild-type and mutant alleles. The association of LDL-C with SNVs and genetic score was analyzed by linear regression and included body mass index, sex, age, and waist circumference as confounding factors.
The sample size was established by considering the mean LDL-C gene score in FH as 0.708 (standard deviation, 0.19) and the mean gene score in controls as 0.632 (standard deviation, 0.22).13 A confidence level (1-α) of 95% (1-sided Zα = 1.960) and a statistical power (1-β) of 90% (1-sided Zβ = 1.282) was established, obtaining a sample size of 126 participants, after adjustment for 15% of losses.
Cholesterol Gene ScoreCholesterol gene score was calculated for each individual by using the weighted sum of the risk alleles of SORT1, APOB, ABCG8, LDLR, and APOE and the lipoprotein(a) concentration.
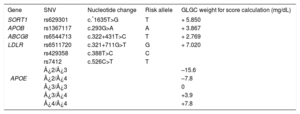
These SNVs had previously been demonstrated to be strongly associated with polygenic hypercholesterolemia. The weight used for each allele was the corresponding per-allele (risk) beta coefficients reported by the Global Lipids Genetics Consortium (Table 1).10 The calculated cholesterol transported in lipoprotein(a) was calculated as recommended by Dahlen16,17: concentration lipoprotein(a) = 0.3 × lipoprotein(a) in mg/dL, and was added to the result of the genetic score.
Global Lipids Genetics Consortium Weight for the 6 Single Nucleotide Variants Used in Cholesterol Gene Score Calculation*
| Gene | SNV | Nucleotide change | Risk allele | GLGC weight for score calculation (mg/dL) |
|---|---|---|---|---|
| SORT1 | rs629301 | c.*1635T>G | T | + 5.850 |
| APOB | rs1367117 | c.293G>A | A | + 3.867 |
| ABCG8 | rs6544713 | c.322+431T>C | T | + 2.769 |
| LDLR | rs6511720 | c.321+711G>T | G | + 7.020 |
| APOE | rs429358 | c.388T>C | C | |
| rs7412 | c.526C>T | T | ||
| ¿2/¿3 | –15.6 | |||
| ¿2/¿4 | –7.8 | |||
| ¿3/¿3 | 0 | |||
| ¿3/¿4 | +3.9 | |||
| ¿4/¿4 | +7.8 |
A, adenine; C, cytosine; G, guanine; GLGC, Global Lipids Genetics Consortium; SNV, single nucleotide variant; T, thymine.
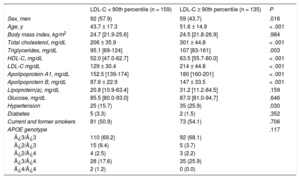
During the study period, a total of 1648 unrelated patients with a clinical diagnosis of primary genetic hypercholesterolemia were studied, and 243 probands fulfilled the inclusion criteria. Those who met the inclusion criteria were consecutively invited to participate until the projected number of 50 families was reached. After the initial characterization of probands, 1 family was excluded due to the complex assignment of parenthood. Of the 49 families studied, a total of 294 participants were included: 268 blood-relative (91.2%) and 26 spouses (8.8%). Hypercholesterolemia family members were older, with a higher percentage of women, and had higher total cholesterol, LDL-C and high-density lipoprotein cholesterol than family members without hypercholesterolemia. Anthropometric and clinical characteristics of these participants divided by the presence or absence of hypercholesterolemia are shown in Table 2.
Clinical and Biochemical Characteristics of Family Members With LDL-C < 90th Percentile and Participants With LDL-C ≥ 90th Percentile*
| LDL-C < 90th percentile (n = 159) | LDL-C ≥ 90th percentile (n = 135) | P | |
|---|---|---|---|
| Sex, men | 92 (57.9) | 59 (43.7) | .016 |
| Age, y | 43.7 ± 17.3 | 51.6 ± 14.9 | < .001 |
| Body mass index, kg/m2 | 24.7 [21.9-25.6] | 24.5 [21.8-26.9] | .984 |
| Total cholesterol, mg/dL | 206 ± 35.9 | 301 ± 44.8 | < .001 |
| Triglycerides, mg/dL | 95.1 [69-124] | 107 [83-161] | .003 |
| HDL-C, mg/dL | 52.0 [47.0-62.7] | 63.5 [55.7-80.0] | < .001 |
| LDL-C mg/dL | 129 ± 30.4 | 214 ± 44.8 | < .001 |
| Apolipoprotein A1, mg/dL | 152.5 [139-174] | 180 [160-201] | < .001 |
| Apolipoprotein B, mg/dL | 97.6 ± 22.9 | 147 ± 33.5 | < .001 |
| Lipoprotein(a), mg/dL | 20.8 [10.9-63.4] | 31.2 [11.2-84.5] | .159 |
| Glucose, mg/dL | 85.5 [80.0-93.0] | 87.0 [81.0-94.7] | .646 |
| Hypertension | 25 (15.7) | 35 (25.9) | .030 |
| Diabetes | 5 (3.3) | 2 (1.5) | .352 |
| Current and former smokers | 81 (50.9) | 73 (54.1) | .706 |
| APOE genotype | .117 | ||
| ¿3/¿3 | 110 (69.2) | 92 (68.1) | |
| ¿2/¿3 | 15 (9.4) | 5 (3.7) | |
| ¿2/¿4 | 4 (2.5) | 3 (2.2) | |
| ¿3/¿4 | 28 (17.6) | 35 (25.9) | |
| ¿4/¿4 | 2 (1.2) | 0 (0.0) |
HDL-C, high-density lipoprotein cholesterol; LDL-C, low-density lipoprotein cholesterol.
Quantitative variables are expressed as mean ± standard deviation, except for variables not following normal distribution, which were expressed as median [interquartile range]. Qualitative variables are expressed as No. (%). The P value was calculated by the Student t test or the Mann-Whitney U and chi-square tests, as appropriate.
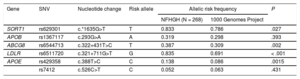
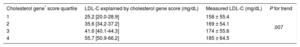
All risk alleles showed a higher frequency in NFHGH families than in the 1000 Genomes Project,18 although the differences were statistically significant in only 4 of them: c.*1635G>T in SORT1, c.322+431T>C in ABCG8, c.327+711 G>T in LDLR and c.388T>C in APOE (Table 3). The risk allele frequencies were not significantly different between participants with and without hypercholesterolemia in the families. There were higher frequencies of all SNVs in affected participants, although there was no statistically significant difference between affected and nonaffected participants in NFHGH families. Allele frequencies of all SNVs followed the Hardy-Weinberg equilibrium. However, the cholesterol gene score was significantly higher (P = .048) in participants with LDL-C > 90th percentile than in participants with LDL-C < 90th percentile (Table 1 of the supplementary material). When participants were divided into quartiles by cholesterol gene score (Table 4), there was a significant increase in LDL-C with higher quartiles of the cholesterol gene score (P = .007). Approximately each increase of 1 point in the score was accompanied by an increase of 1mg/dL of LDL-C, and each quartile differed by approximately 10 points.
Allele Frequency of Genetic Variants in Blood Nonfamilial Hypercholesterolemia Genetic Hypercholesterolemia Relatives and in the 1000 Genomes Project
| Gene | SNV | Nucleotide change | Risk allele | Allelic risk frequency | P | |
|---|---|---|---|---|---|---|
| NFHGH (N = 268) | 1000 Genomes Project | |||||
| SORT1 | rs629301 | c.*1635G>T | T | 0.833 | 0.786 | .027 |
| APOB | rs1367117 | c.293G>A | A | 0.319 | 0.298 | .393 |
| ABCG8 | rs6544713 | c.322+431T>C | T | 0.387 | 0.309 | .002 |
| LDLR | rs6511720 | c.321+711G>T | G | 0.835 | 0.691 | < .001 |
| APOE | rs429358 | c.388T>C | C | 0.138 | 0.086 | .0015 |
| rs7412 | c.526C>T | C | 0.052 | 0.063 | .431 | |
A, adenine; C, cytosine; G, guanine; NFHGH, nonfamilial hypercholesterolemia genetic hypercholesterolemia; SNV, single nucleotide variant; T, thymine.
P values were calculated by chi-square test, by comparing mutant vs wild-type allelic frequencies.
Low-density Lipoprotein Cholesterol Concentrations According to Quartiles of the Cholesterol Gene Score in Blood Relatives of Nonfamilial Hypercholesterolemia Genetic Hypercholesterolemia Patients
| Cholesterol gene* score quartile | LDL-C explained by cholesterol gene score (mg/dL) | Measured LDL-C (mg/dL) | P for trend |
|---|---|---|---|
| 1 | 25.2 [20.0-28.9] | 158 ± 55.4 | .007 |
| 2 | 35.6 [34.2-37.2] | 169 ± 54.1 | |
| 3 | 41.6 [40.1-44.3] | 174 ± 55.6 | |
| 4 | 55.7 [50.9-66.2] | 185 ± 64.5 |
LDL-C, low-density lipoprotein cholesterol.
Quantitative variables were expressed as mean ± standard deviation, except for variables not following normal distribution that were expressed as median [interquartile range]. The P for trend refers to difference of LDL-C across score quartile.
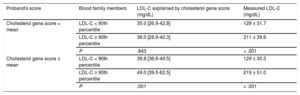
The impact of the cholesterol gene score was studied according to the cholesterol gene score in the proband. We divided the families into 2 groups according to the score value of the proband, families with a high cholesterol gene score in the proband, and families with a low cholesterol gene score in the proband. The score did not show an association with hypercholesterolemia in families with low cholesterol gene score in the proband. However, in families with a high cholesterol gene score in the proband, the score highly discriminated hypercholesterolemia in family members (P = .001) (Table 5).
Cholesterol Gene Score and Cholesterol Concentrations in Blood Nonfamilial Hypercholesterolemia Genetic Hypercholesterolemia Relatives According to Cholesterol Gene Score in the Proband
| Proband's score | Blood family members | LDL-C explained by cholesterol gene score (mg/dL) | Measured LDL-C (mg/dL) |
|---|---|---|---|
| Cholesterol gene score < mean | LDL-C < 90th percentile | 35.0 [26.9-42.8] | 129 ± 31.7 |
| LDL-C ≥ 90th percentile | 36.0 [28.9-40.3] | 211 ± 39.6 | |
| P | .843 | < .001 | |
| Cholesterol gene score ≥ mean | LDL-C < 90th percentile | 39.8 [36.6-49.5] | 129 ± 30.3 |
| LDL-C ≥ 90th percentile | 49.0 [39.5-62.5] | 219 ± 51.0 | |
| P | .001 | < .001 |
LDL-C, low-density lipoprotein cholesterol.
LDL-C is expressed as mean ± standard deviation, cholesterol gene score is expressed as median [interquartile range]. The P value was calculated by the Student t test and Mann-Whitney U test as appropriate.
The association between LDL-C and each SNVs was analyzed by univariate linear regression analysis. Only APOB (c.293G>A) and APOE (c.526C>T) SNVs showed a statistically significant association with LDL-C concentration when introduced together in the same model. The relationship remained significant after adjustment for confounding factors (Table 2 of the supplementary material).
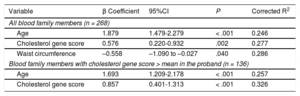
Linear regression showed that the percentage of LDL-C concentration explained by age, the genetic score, and waist circumference was 28.6%, adjusting for sex and body mass index. The percentage explained by the score was only 3.1%; however, this percentage increased to 6.9% in the subgroup of participants with the highest score in the proband (Table 6).
Linear Regression Analysis of Clinical, Biochemical and Genetic Variables With the Low-density Lipoprotein Cholesterol Concentration in Blood Nonfamilial Hypercholesterolemia Genetic Hypercholesterolemia Relatives
| Variable | β Coefficient | 95%CI | P | Corrected R2 |
|---|---|---|---|---|
| All blood family members (n = 268) | ||||
| Age | 1.879 | 1.479-2.279 | < .001 | 0.246 |
| Cholesterol gene score | 0.576 | 0.220-0.932 | .002 | 0.277 |
| Waist circumference | –0.558 | –1.090 to –0.027 | .040 | 0.286 |
| Blood family members with cholesterol gene score > mean in the proband (n = 136) | ||||
| Age | 1.693 | 1.209-2.178 | < .001 | 0.257 |
| Cholesterol gene score | 0.857 | 0.401-1.313 | < .001 | 0.326 |
95%CI, 95% confidence interval.
Linear regression model adjusted for body mass index, age, sex, and waist circumference.
Corrected R2 explains the variability percentage of the dependent variable (low-density lipoprotein cholesterol concentration) that would be explained by the independent variables included in the model (age, genetic cholesterol score, body mass index, sex and waist circumference).
Binary logistic regression showed that for every increase of 0.016 units of the genetic score, the risk of having LDL-C above the 90th percentile increased by 1.017-fold (95% confidence interval, 1.001-1.033), regardless of confounding factors (age, sex, and body mass index), by determining 19.1% of its variability (area under the curve 0.726).
DiscussionLow-density lipoprotein cholesterol concentrations result from the interaction of multiple genetic and environmental factors; hence, hypercholesterolemia tends to cluster in some families that share predisposing genetic and environmental backgrounds, mimicking a monogenic disease.19 Furthermore, the interaction of certain genetic and environmental factors, especially being overweight and consuming a high-calorie diet, have an exponential effect on lipid concentrations, as occurs in familial combined hyperlipidemia, formerly considered as a monogenic disease, but has since been established to be a complex disease with a polygenic component.20 The consequence is that diagnosis in certain families with high LDL-C in several members is not easy, and in many cases (between 20% and 40% of patients with a clinical diagnosis of FH), a single-gene defect is not detected and their hypercholesterolemia is due to polygenic causes.8 It has been recommended that the term “familial” be reserved for single-gene disorders,21 and, when this cannot be demonstrated, that the diagnosis of FH is misleading for the physician and for the patient; therefore the designation of NFHGH better defines the characteristics of this group of hypercholesterolemia patients.11
Several genome-wide association studies have shown that at least 100 loci are associated with LDL-C concentration in the population,22,23 and that some individuals carrying multiple LDL-C raising SNVs have high LDL-C concentrations mimicking the FH phenotype.13 We have analyzed, for the first time, the best validated SNVs associated with high LDL-C in groups of families with NFHGH and our results show several important aspects. First, our results confirm previous results of the clustering of certain SNVs in participants with a diagnosis of NFHGH and indicate for the first time that these families concentrate predisposing alleles to increase LDL-C compared with the general population and explain part of their phenotype. This has great value in suggesting the conceptual polygenic nature of this hypercholesterolemia, although the amount of LDL-C explained by these genetic factors is small. Second, our study indicates that the inclusion of lipoprotein(a) in the gene score substantially improves the percentage of the variation of LDL-C explained by SNVs. Since the concentration of lipoprotein(a) is mostly a consequence of genetic factors,24 we believe it must be included in the scores used to identify NFHGH participants. Third, as expected, the contribution of the genetic factors varies greatly among families, indicating the complexity and heterogeneity of the genetic basis of these forms of hypercholesterolemia, and questions the diagnostic value of a single genetic score based on a small group of SNVs that may be useful for selected cases, but with limited efficacy in other circumstances. Undoubtedly, we are still far from having an effective score that correctly identifies this population, and more studies are needed to further identify the causative genes. Finally, and most importantly, the absence of a causative mutation and the presence of a high polygenic score should not limit familial cascade screening. However, this screening should be based on clinical rather than in genetic information.8 Although hypercholesterolemia in these families is not monogenic, many individuals have very high LDL-C concentrations, which require early identification. The aim of cascade screening is not to identify participants with certain mutations, but to identify individuals at high risk because of their high concentrations of LDL-C25; our study shows that familial cascade screening based on LDL-C should be performed despite the absence of a monogenic defect.
LimitationsOur study has the following limitations: the small number of SNVs, perhaps not the most important association with LDL-C in our population; the extrapolation of cholesterol associated with a lipoprotein(a) particle based on a uniform formula, although this content may vary between participants depending on the different apolipoprotein(a) isoforms; the weight of each SNV used for score calculation was the average in the population, and the effect on each family and each individual may differ, depending on other unknown genetic and environmental factors. However, strengths of this study are that phenotype and genotype were studied in depth in all participants; they were recruited in a single center, decreasing variability, and from a genetically homogeneous population. Furthermore, the 6-SNV score used in our study has been demonstrated to be as good at discriminating between FH and non-FH as other scores with multiple SNVs13 because additional SNVs had very limited effects on the gene score and on LDL-C variations and do not improve diagnosis.10
In conclusion, the study of SNVs and lipoprotein(a) in families with clinical criteria of FH without mutations in candidate genes demonstrates the polygenic nature of the disease. However, the genetic score based on 7 genetic markers explained only a small percentage of hypercholesterolemia, which limits its use in diagnosis. The polygenic component of the hypercholesterolemia in these NFHGH families should not exclude family screening based on LDL-C because it is common to find severe hypercholesterolemia in other family members.
- –
Some forms of hypercholesterolemia classified as FH have a polygenic origin. Six SNVs have previously been described associated with a diagnosis of polygenic hypercholesterolemia. The value of a genetic score based on those SNVs associated with hypercholesterolemia has not been previously studied in affected families.
- –
This is the first study to analyze the genetic variation associated with polygenic hypercholesterolemia in families with a clinical diagnosis of FH.
- –
Familial genetic study confirms the polygenic nature of this phenotype.
- –
However, it is not clinically useful to differentiate between participants with hypercholesterolemia and normolipemic participants.
- –
Diagnosis of polygenic hypercholesterolemia should not exclude cascade screening among relatives, since these families concentrate members with severe hypercholesterolemia.
This work was funded by the Spanish Ministry of Health FIS PI13/02507, FIS PI15/01983, RD12/0042/0055, CIBERCV (Supported with European grants) and Cuenca Villoro Foundation.
CONFLICTS OF INTERESTNone declared.
Genetic analyses were performed in the Sequencing and Functional Genomics facility of Servicios Científico Técnicos of CIBA (IACS-Universidad de Zaragoza), Zaragoza, Spain. The authors thank Maclean S. Panshin for his valuable help in revising the English.