
Obesity is a public health concern with a strong impact on the health of the population. The aim of this study was to analyze the trend in the prevalence of obesity and to identify changes in this trend in Spain and its 17 autonomous communities (AC) among the population aged ≥ 15 years from 1987 to 2020.
MethodsA trend analysis of the prevalence of obesity was conducted with data extracted from the complete historical series of the Spanish National Health Survey and the European Health Survey in Spain using joinpoint regression models. For each period identified in the trend analysis, we estimated the annual percentage change (APC) and its 95% confidence interval (95%CI). The results are presented for crude and standardized prevalences by the direct method accompanied by 95%CI, sex ratios, and relative changes in prevalences between periods.
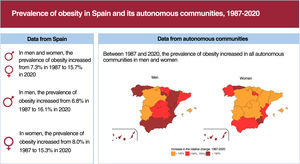
ResultsThe prevalence of obesity increased from 7.3% (95%CI, 7.0-7.7) in 1987 to 15.7% (95%CI, 15.1-16.3) in 2020. In men, the prevalence increased until 2009 (APC,4.3; [95%CI, 3.8-5.0]) and then stabilized. In women, the prevalence increased until 2001 (APC,4.2; [95%CI, 2.7-8.8]) and subsequently also stabilized. The prevalence of obesity and its trend varied between AC, with three different patterns being observed with standardized prevalences: AC with a continuous increase, AC with an increase and subsequent stabilization, and AC with an increase and subsequent decrease.
ConclusionsThe prevalence of obesity has increased in Spain since 1987, although in the last decade it has remained stable at values above 15%. However, in the group aged 15 to 24 years, the prevalence of obesity showed an increasing trend throughout the study period.
Keywords
Obesity is a public health concern with ever-greater impact in recent decades. In 2022, according to the World Health Organization (WHO), 2500 million adults had excess weight; of these, 890 million were obese.1 Since 1975, the global prevalence of obesity has almost tripled.2 The WHO estimates that, in 2025, there will be 167 more people with overweight or obesity.3 This trend is worrying given the numerous comorbidities associated with obesity, such as cardiovascular disease, type 2 diabetes, and certain types of cancer.1
Various factors are contributing to the increase in population obesity. One of the main factors is reduced physical activity and the adoption of sedentary lifestyles caused by changes in work and leisure time habits.4 Another factor is the move to a more Western diet, characterized by greater consumption of processed foods rich in refined sugars and saturated fats and a lower intake of fresh fruit and vegetables. In addition, other major contributors to obesity are socioeconomic factors, with a worsening in social conditions associated with an increased prevalence of obesity.5,6
Various studies have analyzed obesity trends in Spain. However, few have examined the changes over time in adults. In the most recent work, a systematic review including 47 studies performed between 1987 and 2024 found an increase in overweight, obesity, and morbid obesity.7 In addition, hardly any studies have analyzed the changes over time in obesity prevalence in Spanish autonomous communities (ACs). The few studies available are focused on a single community, analyze a relatively short period of time, or rely on less than recent data.8,9
The aim of the present study was to analyze the trends and identify the changes over time in the prevalence of obesity in Spain (overall, by sex, and by age) and in the 17 ACs (by sex) in the population aged ≥ 15 years from 1987 to 2020.
METHODSData sourcesThe data used in this study were extracted from the complete historical series of the Spanish National Health Survey (SNHS) and the European Survey of Health in Spain (ESHS). The first SNHS was performed in 1987 (n = 29 647) and was repeated in 1993 (n = 21 061), 1995 (n = 6397), 1997 (n = 6396), 2001 (n = 21 067), 2003 (n = 21 650), 2006 (n = 29 478), 2011 and 2012 (n = 21 007), and 2017 (n = 23 089). The ESHS was performed in 2009 (n = 22 188), 2014 (n = 22 842), and 2020 (n = 22 072). Overall, 246 892 individuals participated in the SNHS and ESHS, comprising 113 549 men (46%) and 133 296 women (54%). All SNHS/ESHS studies were weighted and are representative of the national population and, except the 1995 and 1997 releases, of the ACs.10
The target population of these surveys is the noninstitutional population resident in Spain ≥ 16 years old. From the SNHS-2011 onward, the age limit was changed to ≥ 15 years. From SNHS-1987 to SNHS-2001, participants were selected based on multistage cluster sampling, with the primary sample units (municipalities) and secondary units (census tracts) selected by random proportional sampling. Since SNHS-2003, sample selection was conducted by applying a stratified 3-stage sampling approach and the primary units were census tracts.11
Definition of obesityObesity was defined by using self-reported height and weight data obtained with the following questions: “How much do you weigh, approximately, without shoes or clothes?” and “How tall are you, approximately, without shoes?”
The population was classified by body mass index, calculated as the ratio between weight in kilograms and height in meters squared. Obesity was defined as a body mass index ≥ 30kg/m2 in accordance with WHO definitions.12
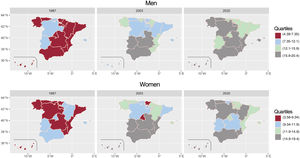
Statistical analysisCrude obesity prevalences for Spain as a whole were calculated as the total, by sex, by age group, and by year of survey performance; for the 17 ACs, the prevalences were calculated by sex and survey year. These prevalences were accompanied by 95% confidence intervals (95%CIs). Age-standardized prevalences were calculated in the 17 ACs by sex and survey year. Prevalences were standardized by the direct method, using as reference the standard European population in the Eurostat Task Force.13 To compare obesity prevalences by sex, the male-to-female ratio with the corresponding 95% confidence interval (95%CI) was calculated with Poisson regressions. In addition, the crude prevalence data in the ACs in 1987, 2003, and 2020 are presented in maps categorized in quartiles. These years were chosen to have an overview of the situation at the start, middle, and end of the study period.
To identify changes in obesity prevalence trends in Spain and in the 17 ACs, joinpoint regression models were applied (segmented Poisson models). We considered a maximum of 2 change points, 4499 permutations by the Monte Carlo method, a 5% significance value, and Bonferroni correction. This model estimated, for each period identified, the annual percentage change (APC) with its 95%CI. These models were applied by sex and age group (15-24, 25-44, 45-64, ≥ 65 years) in Spain as a whole and by sex in the ACs.
To obtain the percentage change between prevalences during the period analyzed, we calculated the relative change in the estimated prevalences at the start and end of the study period as:

where P is obesity prevalence.
Estimates were performed with the statistical software Stata 16.0 and with Joinpoint Regression Program 4.9.1.0; the spatial representation was performed with R version 4.1.1.
RESULTSThe analyzed data corresponded to 221 711 individuals with complete height and weight data, comprising 98 051 men (47.8%) and 115 660 women (52.2%).
The overall prevalence of obesity in Spain was 7.3% (95%CI, 7.0-7.7) in 1987 and 15.7% (95%CI, 15.1-16.3) in 2020 (figure 1). In 1987 and 2001, the prevalence of obesity was higher in women (male-to-female ratio < 1) while no differences by sex were detected in the remaining period (figure 2 and table 1 of the supplementary data).


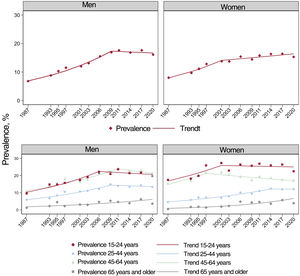
In all years of the study period (1987-2020), the obesity prevalence increased with the age group, except in 1995, in which the prevalence was similar in the groups aged 45 to 64 years and ≥ 65 years. In the final survey (2020), the prevalence was 3.7% (95%CI, 2.8-4.9) in the group aged 15 to 24 years vs 21.2% (95%CI, 20.0-22.5) in those ≥ 65 years. The group aged 15 to 24 years showed a major change in prevalence in the study period (relative change, 3.4%) (figure 2 and table 2 of the supplementary data). The obesity prevalence data by sex and age group are shown in table 3 of the supplementary data.
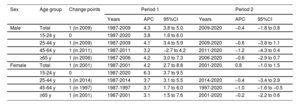
In men, the obesity prevalence increased between 1987 and 2009, with an APC of 4.3 (95%CI, 3.8-5.0), and was stable between 2009 and 2020 (APC = −0.4 [95%CI, −1.8 to 0.8]). In women, the prevalence increased between 1987 and 2001, with an APC of 4.2 (95%CI, 2.7-8.8), and was stable between 2001 and 2020 (APC = 0.8 [95%CI, −1.0 to 1.5]) (table 1).
Analysis of the trends in the crude prevalence of obesity and 95% confidence intervals by age group and sex in adults ≥ 15 years* between 1987 and 2020
| Sex | Age group | Change points | Period 1 | Period 2 | ||||
|---|---|---|---|---|---|---|---|---|
| Years | APC | 95%CI | Years | APC | 95%CI | |||
| Male | Total | 1 (in 2009) | 1987-2009 | 4.3 | 3.8 to 5.0 | 2009-2020 | −0.4 | –1.8 to 0.8 |
| 15-24 y | 0 | 1987-2020 | 3.8 | 1.6 to 6.0 | ||||
| 25-44 y | 1 (in 2009) | 1987-2009 | 4.1 | 3.4 to 5.9 | 2009-2020 | −0.6 | −3.8 to 1.1 | |
| 45-64 y | 1 (in 2011) | 1987-2011 | 3.2 | −2.7 to 4.2 | 2011-2020 | −1.2 | −4.3 to 0.4 | |
| ≥65 y | 1 (in 2006) | 1987-2006 | 4.2 | 3.0 to 7.3 | 2006-2020 | −0.6 | −2.9 to 0.7 | |
| Female | Total | 1 (in 2001) | 1987-2001 | 4.2 | 2.7 to 8.8 | 2001-2020 | 0.8 | −1.0 to 1.5 |
| 15-24 y | 0 | 1987-2020 | 6.3 | 3.7 to 9.5 | ||||
| 25-44 y | 1 (in 2014) | 1987-2014 | 3.7 | 3.1 to 5.5 | 2014-2020 | −0.4 | −3.4 to 2.9 | |
| 45-64 y | 1 (in 1997) | 1987-1997 | 3.7 | 1.7 to 6.0 | 1997-2020 | –1.0 | –1.6 to –0.5 | |
| ≥65 y | 1 (in 2001) | 1987-2001 | 3.1 | 1.5 to 7.6 | 2001-2020 | −0.2 | −2.2 to 0.6 | |
95%CI, 95% confidence interval; APC, annual percentage change.
In men aged 15 to 24 years, prevalence continuously increased between 1987 and 2020 (APC = 3.8 [95%CI, 1.6-6.0]). In the groups aged 25 to 44, 45 to 64, and ≥ 65 years, an increase was detected until 2009, 2011, and 2006, respectively, followed by a period with a stable trend (table 1 and figure 2).
In women aged 15 to 24 years, an upward trend was seen during the entire series (APC = 6.3 [95%CI, 3.7-9.5]). In the groups aged 25 to 44, 45 to 64, and ≥ 65 years, a progressive increase was seen until 2014, 1997, and 2001, respectively, followed by a stable trend, except in the group aged 45 to 64 years, which showed a fall between 1997 and 2020 (APC = −1.0 [95%CI, −1.6 to −0.5]) (table 1 and figure 2).
In 2020, Andalusia and the Principality of Asturias were the ACs with the highest prevalence of obesity in men; the ACs with the highest prevalences for women were Andalusia and the Region of Murcia. While obesity prevalence increased in all ACs, the changes were more gradual in the ACs in the center of the country and more abrupt in the south (figure 3). There was a notable increase in the ACs in the northeast, such as the Principality of Asturias, and in the Region of Murcia in the south (table 4 of the supplementary data).

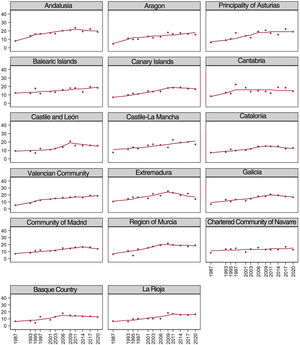
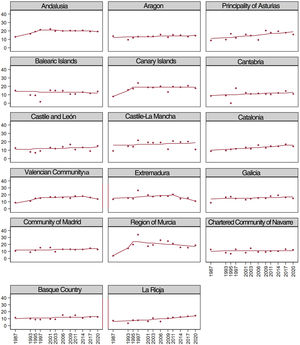
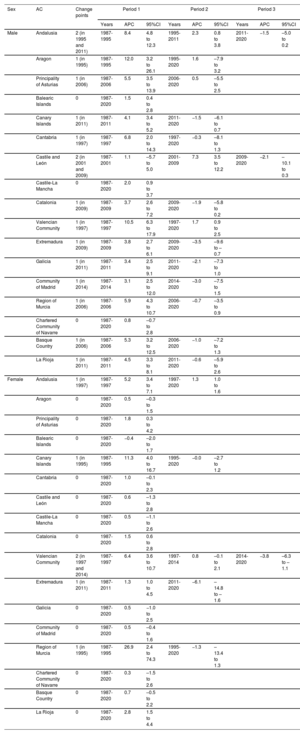
Trend analysis using crude and standardized obesity prevalences showed differences among the ACs. In men, the crude prevalences revealed an upward trend and subsequent stabilization in Andalusia, the Canary Islands, Catalonia, Extremadura, the Community of Madrid, the Region of Murcia, and the Basque Country. A continuous increase in the trend was detected in the remaining ACs. Analysis of the standardized prevalences in men revealed an upward trend and subsequent stabilization in most ACs, except in the Valencian Community, which showed a continuous increase, and Extremadura, which demonstrated an upward trend and subsequent decrease. In women, the crude prevalences showed a continuous increase in most ACs, except in the Balearic Islands, the Canary Islands, the Valencian Community, and Extremadura, which had stable prevalences (figure 1). With the standardized prevalences, a continuous increase in the trend was seen in Andalusia, the Principality of Asturias, Catalonia, and La Rioja, an upward trend and subsequent decrease in the Valencian Community and Extremadura, and a stabilization in the remaining ACs (table 2, figure 4, figure 5, table 5 of the supplementary data, and figure 1 of the supplementary data).
Analysis of the trends in the crude prevalence of obesity and 95% confidence intervals by autonomous community in adults aged ≥ 15 years* between 1987 and 2020
| Sex | AC | Change points | Period 1 | Period 2 | Period 3 | ||||||
|---|---|---|---|---|---|---|---|---|---|---|---|
| Years | APC | 95%CI | Years | APC | 95%CI | Years | APC | 95%CI | |||
| Male | Andalusia | 2 (in 1995 and 2011) | 1987-1995 | 8.4 | 4.8 to 12.3 | 1995-2011 | 2.3 | 0.8 to 3.8 | 2011-2020 | −1.5 | –5.0 to 0.2 |
| Aragon | 1 (in 1995) | 1987-1995 | 12.0 | 3.2 to 26.1 | 1995-2020 | 1.6 | –7.9 to 3.2 | ||||
| Principality of Asturias | 1 (in 2006) | 1987-2006 | 5.5 | 3.5 to 13.9 | 2006-2020 | 0.5 | –5.5 to 2.5 | ||||
| Balearic Islands | 0 | 1987-2020 | 1.5 | 0.4 to 2.8 | |||||||
| Canary Islands | 1 (in 2011) | 1987-2011 | 4.1 | 3.4 to 5.2 | 2011-2020 | −1.5 | −6.1 to 0.7 | ||||
| Cantabria | 1 (in 1997) | 1987-1997 | 6.8 | 2.0 to 14.3 | 1997-2020 | −0.3 | –8.1 to 1.3 | ||||
| Castile and León | 2 (in 2001 and 2009) | 1987-2001 | 1.1 | –5.7 to 5.0 | 2001-2009 | 7.3 | 3.5 to 12.2 | 2009-2020 | −2.1 | –10.1 to 0.3 | |
| Castile-La Mancha | 0 | 1987-2020 | 2.0 | 0.9 to 3.7 | |||||||
| Catalonia | 1 (in 2009) | 1987-2009 | 3.7 | 2.6 to 7.2 | 2009-2020 | −1.9 | –5.8 to 0.2 | ||||
| Valencian Community | 1 (in 1997) | 1987-1997 | 10.5 | 6.3 to 17.9 | 1997-2020 | 1.7 | 0.9 to 2.5 | ||||
| Extremadura | 1 (in 2009) | 1987-2009 | 3.8 | 2.7 to 6.1 | 2009-2020 | −3.5 | –9.6 to –0.7 | ||||
| Galicia | 1 (in 2011) | 1987-2011 | 3.4 | 2.5 to 9.1 | 2011-2020 | −2.1 | –7.3 to 1.0 | ||||
| Community of Madrid | 1 (in 2014) | 1987-2014 | 3.1 | 2.5 to 12.0 | 2014-2020 | −3.0 | –7.5 to 1.5 | ||||
| Region of Murcia | 1 (in 2006) | 1987-2006 | 5.9 | 4.3 to 10.7 | 2006-2020 | −0.7 | –3.5 to 0.9 | ||||
| Chartered Community of Navarre | 0 | 1987-2020 | 0.8 | –0.7 to 2.8 | |||||||
| Basque Country | 1 (in 2006) | 1987-2006 | 5.3 | 3.2 to 12.5 | 2006-2020 | −1.0 | –7.2 to 1.3 | ||||
| La Rioja | 1 (in 2011) | 1987-2011 | 4.5 | 3.3 to 8.1 | 2011-2020 | −0.6 | –5.9 to 2.6 | ||||
| Female | Andalusia | 1 (in 1997) | 1987-1997 | 5.2 | 3.4 to 7.1 | 1997-2020 | 1.3 | 1.0 to 1.6 | |||
| Aragon | 0 | 1987-2020 | 0.5 | –0.3 to 1.5 | |||||||
| Principality of Asturias | 0 | 1987-2020 | 1.8 | 0.3 to 4.2 | |||||||
| Balearic Islands | 0 | 1987-2020 | −0.4 | –2.0 to 1.7 | |||||||
| Canary Islands | 1 (in 1995) | 1987-1995 | 11.3 | 4.0 to 16.7 | 1995-2020 | −0.0 | –2.7 to 1.2 | ||||
| Cantabria | 0 | 1987-2020 | 1.0 | –0.1 to 2.3 | |||||||
| Castile and León | 0 | 1987-2020 | 0.6 | –1.3 to 2.8 | |||||||
| Castile-La Mancha | 0 | 1987-2020 | 0.5 | –1.1 to 2.6 | |||||||
| Catalonia | 0 | 1987-2020 | 1.5 | 0.6 to 2.8 | |||||||
| Valencian Community | 2 (in 1997 and 2014) | 1987-1997 | 6.4 | 3.6 to 10.7 | 1997-2014 | 0.8 | –0.1 to 2.1 | 2014-2020 | −3.8 | –6.3 to –1.1 | |
| Extremadura | 1 (in 2011) | 1987-2011 | 1.3 | 1.0 to 4.5 | 2011-2020 | −6.1 | –14.8 to –1.6 | ||||
| Galicia | 0 | 1987-2020 | 0.5 | −1.0 to 2.5 | |||||||
| Community of Madrid | 0 | 1987-2020 | 0.5 | –0.4 to 1.6 | |||||||
| Region of Murcia | 1 (in 1995) | 1987-1995 | 26.9 | 2.4 to 74.3 | 1995-2020 | −1.3 | –13.4 to 1.3 | ||||
| Chartered Community of Navarre | 0 | 1987-2020 | 0.3 | –1.5 to 2.6 | |||||||
| Basque Country | 0 | 1987-2020 | 0.7 | –0.5 to 2.2 | |||||||
| La Rioja | 0 | 1987-2020 | 2.8 | 1.5 to 4.4 | |||||||
95%CI, 95% confidence interval; AC, autonomous community; APC, annual percentage change.


In Spain, the prevalence of obesity in adults increased from 1987 to about 2011 but stabilized thereafter at approximately 15% to 17%. Since 2003, the obesity prevalence has been similar in men and women. In both sexes, the obesity prevalence increased most in young people. The prevalence of obesity and its trends vary among ACs.
According to a WHO report published in 2022, Spain has a higher obesity prevalence than some other European countries, such as France, Germany, Italy, and Portugal, although the prevalence is lower than that of other countries, such as the United Kingdom, Greece, and Hungary.14 Based on the NCD Risk Factor Collaboration (NCD-RisC), the prevalence of obesity increased in Spain, particularly in men, but showed a lower increase in the period between 2005 and 2014 in both sexes. The pattern of a higher prevalence in men has also been seen in other European countries, such as France, Germany, Italy, Portugal, and Sweden.2,15,16 However, in the United States, prevalences were higher in women until 2017, when the prevalences equalized.17,18
The trend for similar obesity prevalences in both sexes and even higher rates in men in some studies could be due to several factors. The first factor could be the greater preoccupation of women with their body image, particularly in developed countries.9,19 A second possible contributor is the time spent in sedentary activity. The ENRICA study showed that, during the 2000 to 2010 period, the time spent in sedentary activity decreased more in women than in men.20 Indeed, in Spain, a decrease was seen in sedentary behavior in leisure time in the 1987 to 2020 period that was greater in women and in the group aged 45 to 64 years.21 In Spain, according to ESHS-2020 data, women aged 25 to 74 years have a higher daily intake of fresh fruit and vegetables than men while, in the groups aged 15 to 24 years and ≥ 75 years, intake is similar in the 2 sexes.22
The increase in obesity prevalences in Spain could also be related to the gradual replacement of the Mediterranean diet with more calorie-dense foods. Data from the Spanish National Dietary Survey (ENIDE) and the National Survey of the Eating Habits of Adults, the Elderly, and Pregnant Women (ENALIA 2) show an elevated intake of meat-based products and foods high in salt, saturated fat, and added sugars, together with low intake of fruit and vegetables and the replacement of olive oil with oils such as sunflower.23–25
Even though the prevalence of obesity in Spain increased between 1987 and 2020, the trends have stabilized in the last decade. This stabilization may be due to various factors. First, the prevalence of regular physical exercise increased in Spain from 22.4% in 2011 to 37.7% in 2022.26 Second, the prevalence of sedentary behavior in leisure time is falling, from 55.1% in 1993 to 36.4% in 2020.21 The development of strategies aimed at decreasing overweight and obesity in Spain, such as the implementation in 2005 of the Nutrition, Physical Activity, and Obesity Prevention (NAOS) strategy, could also have influenced the stabilization of obesity in the Spanish population.
The present results revealed that the youngest groups exhibited an upward trend in obesity prevalence, as observed in Switzerland27 and France.28 The continued uptick in obesity in the younger population may be related to various factors. A large part of the young adult population is composed of students, who have the highest prevalence of sedentary behavior as a primary activity, associated with study time.21 Although young people aged between 16 and 24 years exhibit the lowest prevalence of sedentary behavior in leisure time,21 the transition toward sedentary lifestyles associated with screen time may also have influenced the increase in the prevalence of obesity.29 The elevated prevalence of obesity is also seen in childhood and adolescence.30
In 2020, Andalusia, the Region of Murcia, the Canary Islands, Castile and León, Galicia, and the Principality of Asturias were the ACs with the highest prevalences of obesity, contrasting with the Community of Madrid, the Chartered Community of Navarre, and the Basque Country, which had the lowest prevalences. Similar results were obtained in the ENPE study, performed in 2014 and 2015, in which the Principality of Asturias and Galicia were the ACs with the highest obesity prevalences.31,32 However, the prevalences observed in the ENPE study are higher than those estimated with the SNHS/ESHS. This could be because the ENPE study participants were weighed and measured while the SNHS/ESHS data are self-reported. Self-reported data typically underestimate body mass index because people tend to overestimate their height and underestimate their weight.33 In addition, the age ranges of the participants differed between the studies.
The highest obesity prevalences seen in the present study and in the ENPE,31,32,34 DORICA,35 and ENRICA36,37 studies in the south and northeast of Spain may be due to demographic and social factors. An advanced age and a lower educational or socioeconomic level have been associated with a higher risk of being obese.38,39 In the case of Galicia, Castile and León, and the Principality of Asturias, the higher prevalence of obesity could at least partly be because these 3 ACs have the highest aging index in Spain.40 In the case of Andalusia and the Region of Murcia, the high prevalences may be because these are the ACs with the lowest gross domestic product in Spain38 and with a lower percentage of people with higher education.41
LimitationsThe present study has some limitations. The use of self-reported data suggests an underestimation of obesity, given that participants tend to underestimate weight and overestimate height.33 Obesity prevalences could not be calculated in the autonomous cities of Ceuta and Melilla due to the small sample size of the surveys. The limited sample sizes must also be considered for certain ACs, particularly after stratification by sex. This prevents our ability to analyze the changes over time in prevalences by age in the ACs. Information on the prevalences of obesity in the ACs by sex and age would be highly valuable because the youngest age groups exhibited the greatest increase in obesity prevalence in Spain.
The study also has several strengths, such as the stable definition of the study variable and the use of representative surveys in both national and AC settings (except ACs in 1995 and 1997).
CONCLUSIONSBetween 1987 and 2020, changes occurred in obesity prevalence and trends in the adult Spanish population. These changes resulted in a stabilization in the prevalences of obesity, which develops earlier in women than in men. However, an upward trend is still visible in young adults, particularly women. Although the prevalence of obesity appears to have stabilized in Spain, this is not homogeneous in all ACs. We must remember that obesity is a major risk factor for the development of cardiovascular diseases associated with excess weight. Between 1990 and 2017, mortality due to excess weight-related cardiovascular disease decreased by 5% in Spain, even though disability-adjusted life years increased.42 This resulted in an increase in healthy life years lost due to excess weight-related cardiovascular disease. Accordingly, we must continue to develop preventive interventions aimed at reducing excess weight from young ages that consider the sex ratios and characteristics of each AC.
Obesity is a major health concern with repercussions for cardiovascular health and a negative impact on other chronic diseases. The trends observed in previous studies performed in Spain indicate that obesity prevalences are increasing. However, the available studies for autonomous communities are scarce, with most focused on a single region, conducted in childhood populations, or containing out-of-date data.
WHAT DOES THIS STUDY ADD?This study provides recent data on the trends in obesity prevalence in the adult population at both the national and autonomous community levels during a greater than 30-year period. In Spain, the prevalence of obesity almost doubled in the study period and currently exceeds 15%. The largest increase in prevalences was detected in the youngest age groups in both men and women. Differences were found among ACs, and those in the northeast and south had the highest obesity prevalences.
None.
ETHICAL CONSIDERATIONSNo ethics approval was required because the study was not conducted using human participants, did not include identifiable human material or data, and did not involve human interventions. Sex was taken into account in the study design and analysis.
STATEMENT ON THE USE OF ARTIFICIAL INTELLIGENCENone.
AUTHORS’ CONTRIBUTIONSL. Feijoo: preparation of databases, method, analysis of data and results, and writing of the original draft. J. Rey-Brandariz: method, analysis of data and results, and manuscript revision and editing. C. Guerra-Tort: preparation of databases, analysis of data and results, and manuscript revision and editing. C. Candal-Pedreira: method and manuscript revision and editing. M.I. Santiago-Pérez: data analysis and manuscript revision and editing. A. Ruano-Ravina: study conception, method, and manuscript revision and editing. M. Pérez-Ríos: study conception, method, analysis of results, manuscript revision and editing, and manuscript supervision.
CONFLICTS OF INTERESTNone declared.