
This issue of the journal includes a publication on the adaptation of the Systematic COronary Risk Evaluation (SCORE) to estimate the risk of death from preventable diseases such as cerebrovascular disease (CVD) and coronary heart disease (CHD), among other cardiovascular diseases.1 The original system was designed to help guide clinicians responsible for the primary prevention of cardiovascular disease and provides risk estimates for non-diabetic patients aged 40-65 years based on sex, age, systolic blood pressure, total cholesterol, and smoking history. The function exists for countries with high and low cardiovascular risk.2
Three functions are currently available to calculate cardiovascular risk in Spain: the classic Framingham function, which overestimates risk in the Spanish population,3 a version of this function which was adapted for the Spanish population by the REGICOR (Registre Gironí del Cor) study investigators in collaboration with investigators from the Framingham Heart Study, and which provides estimates whose validity for Spain was shown in the VERIFICA (Validez de la Ecuación de Riesgo Individual de Framingham de Incidentes Coronarios Adaptada) study,4,5 and, more recently, the SCORE function adjusted in a cohort of over 100 000 Europeans aged 40-65 years and selected about 20 years ago.1 In light of the fact that this function appears to overestimate risk in several European populations, both low and high risk, it became necessary to calibrate it for use in each country.6-8
As the number of people with low (never null) cardiovascular risk is very high in any population (generally over 50%), a large number of events will occur in this group simply because of it contains such a high number of individuals. For example, in a population of 1000 people, 500 will have low risk (eg, a mean of 5%) and 60 will have high risk (eg, a mean of 25% calculated using the REGICOR function); 25 events will occur in the first group and only 15 in the second. One of the characteristics of risk functions is their limited sensitivity, as they are designed to estimate risk in populations which share certain risk factor characteristics, ie, sex and age. This leads to a high degree of uncertainty when they are used at individual level. In countries with a high incidence of cardiovascular disease, the sensitivity of the original Framingham function stands at around 40%.9 Such figures would be unacceptable for a diagnostic test; however, in the case of a screening test for disease risk, which is intended to help structure primary prevention for cardiovascular disease, the importance of this characteristic becomes relative. When the result from the first screening is available, using whichever function seems appropriate, then additional factors can be taken into account. These might include family history of cardiovascular disease, obesity, overweight, or waist circumference, highly sensitive C-reactive protein, lipoprotein (a), microalbuminuria or kidney failure test, and ankle-arm index (or, alternatively, pedal pulse palpation, where absence or weakness can be a sign of cardiovascular ill health), or even the quality of diet and levels of physical activity. Clinical judgment might lead physicians to reclassify low-risk patients as high-risk if their profile is unfavorable in, for example, more than two of the factors described. In patients initially classified as being at medium risk, the presence of one additional factor would be sufficient to reclassify them as high-risk. Figure 1 shows a possible algorithm for the primary prevention of coronary disease. The uncertainty in the figure could, in a perhaps not very distant future, be resolved by the use of non-invasive imaging tests, such as heart scans using multidetector computed tomography. This technique is currently being perfected in terms of image quality and resolution, and cost. Exposure to high levels of radiation, which was necessary in the earlier models, is also being reduced.10

Figure 1. A proposed treatment algorithm for patients in primary prevention for coronary heart disease. aCalculated using the function with the greatest guarantee of validity. bHighly sensitive C-reactive protein >1 g/L, lipoprotein (a) >30 mg/dL, family history of early-onset cardiovascular disease, weak or non-existent pedal pulse or ankle-arm index <0.9, microalbuminuria or kidney failure, obesity (body mass index >30), or waist circumference above the recommended limits by sex. Adapted from Braunwald.15
Until that future, or an alternative one, arrives, prevention based on lifestyle advice (smoking cessation, physical exercise, a healthy diet and weight reduction) can be applied without restrictions, and is based on solid scientific evidence. Such advice should be universally indicated in the prevention of cardiovascular disease, independently of the degree of cardiovascular risk.
Achieving 100% sensitivity in detecting those who will have a cardiovascular event within 10 years would imply treating the whole population. Even then, it would not be possible to avoid all events because of the limited efficacy of preventive methods. The amount of effort put into preventive strategies will also be defined by the threshold in cardiovascular risk beyond which pharmacological treatment is deemed to be necessary. That threshold is completely arbitrary, although it is accepted that it will be close to the risk level in patients who have already had a cardiovascular event. In choosing the threshold, the most important factor is the test's specificity, as the decision to treat has a greater impact on the number of people treated unnecessarily (false positives) than on the number of patients treated correctly (true positives). Figure 2 shows an example of how the choice of threshold would impact on patients who participated in the VERIFICA study (unpublished data). The result indicates that 39.1% of individuals who are going to develop a coronary event would be identified using this threshold, a figure which is similar to that obtained with the original Framingham function using a threshold of 20%.

Figure 2. Distribution of results from the risk algorithm in individuals who developed and did not develop ischemic heart disease in the VERIFICA study. FN indicates false negatives; FP, false positives; TN, true negatives; TP, true positives.
In their adaptation, the authors have used prevalence data on cardiovascular risk factors from the mid-1990's and cardiovascular mortality rates from 2002, to control for the latency of effect. The adaptation is based on a series of assumptions, some of which are made explicit in the text. Others are implicit. Among the explicit assumptions, is the idea that the prevalence of risk factors in the part of Catalonia from which data was obtained is similar to the rest of Spain. This is reasonably true for total cholesterol, but there could be differences in terms of the main risk factor for cerebrovascular disease (high blood pressure), whose prevalence in males aged 35 to 64 years appears to be the lowest of all the countries who participated in a World Health Organization MONICA (Monitoring Trends and Determinants of Cardiovascular diseases) sub-study.11 It also appears to the lowest in Spain, as is shown in table 2 in the article itself.1 The authors' argument that the "standard mercury sphygmomanometers...lead to higher readings (than random zero sphygmomanometers)" is not very convincing as nobody uses the latter in clinical practice. Not only that, but random zero sphygmomanometers have been shown to systematically underestimate blood pressure.12 However, given the fact that mercury sphygmomanometers will shortly be banned in the European Union, and given the reliability and current widespread use of aneroids, this problem is now largely irrelevant.
In estimating the number of individuals aged 40 to 74 years at high risk in the Spanish population, the authors implicitly assume that the SCORE risk chart provides acceptable predictions for those aged over 65. Although SCORE does provide estimates of the 10-year risk of fatal cardiovascular disease for individuals aged 64, current knowledge suggests that its estimates of the 10-year risk of presenting a coronary event for those aged 65-74 years are not reliable. Some publications have indicated that the opposite is in fact true,13 even in patients aged 40-65 years. In this age group, the uncalibrated SCORE risk chart produces a figure for individuals at high risk which is double that of the original Framingham function.8 The authors also extrapolate prevalence data on risk factors for this age group to the whole country based on evidence from only 25 males and 26 females included in the MONICA-Catalonia study. This introduces a considerable element of uncertainty into the estimate, which potential users should be aware of. This is also particularly important as the population aged 65-74 years will present the highest number of fatal and non-fatal cardiovascular events over the next 10 years.5 Indeed, it was for that reason that the low-risk SCORE chart could not be validated in Spain in the VERIFICA study, as most of the fatal cardiovascular events occurred in subjects who were initially older than 64 years, and the original publication suggested that the function could not be used in this group.2
As well as the obvious benefits for Spain of having another instrument available to estimate population cardiovascular risk, some of the study characteristics warrant mention, including the fact that the low-risk SCORE classification and that proposed by the authors were compared in fewer than 20% (400 of 2218) of the participants included in the population study. The latter was the source of prevalence data for cardiovascular risk factors in the present study, and it remains uncertain whether the exclusion of subjects could have led to systematic bias.
What is truly alarming is that this calibration suggests that 35% of the Spanish population aged 40-74 years is at high risk of 10-year cardiovascular mortality. Some countries with high levels of cardiovascular risk have indicated that the SCORE risk chart and current guidelines for cardiovascular prevention mean considerable numbers of the population are classified as being at high risk for cardiovascular disease and mortality.14 The figures for Spain are double those for the United States using the Framingham algorithm which suggests that 17% of the adult US population is at high risk of a fatal or non-fatal coronary event.15
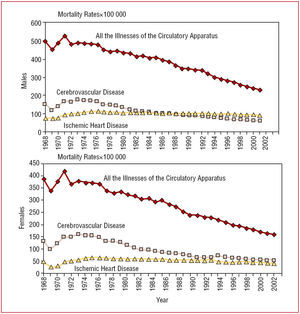
If the validity of this new proposal is confirmed in future studies, the adaptation will require periodic updating to adjust for changes in mortality rates associated with the causes of death included in the SCORE risk chart. It is well known that the standardized cardiovascular mortality rate has declined considerably since the 1970s (Figure 3)16 due to efforts in care and prevention since that time.

Figure 3. Trends in mortality from cardiovascular disease in general, and from ischemic heart disease and cerebrovascular disease, in the last 30 years. Adapted from Llacer.16
We welcome this new instrument to estimate cardiovascular risk, and hope that it helps to reduce the uncertainty surrounding such estimations.
See article on pages 476-85
Correspondence: Dr. J. Marrugat.
Institut Municipal de Investigación Médica.
Dr. Aiguader, 88. 08003 Barcelona. España.
E-mail: jmarrugat@imim.es